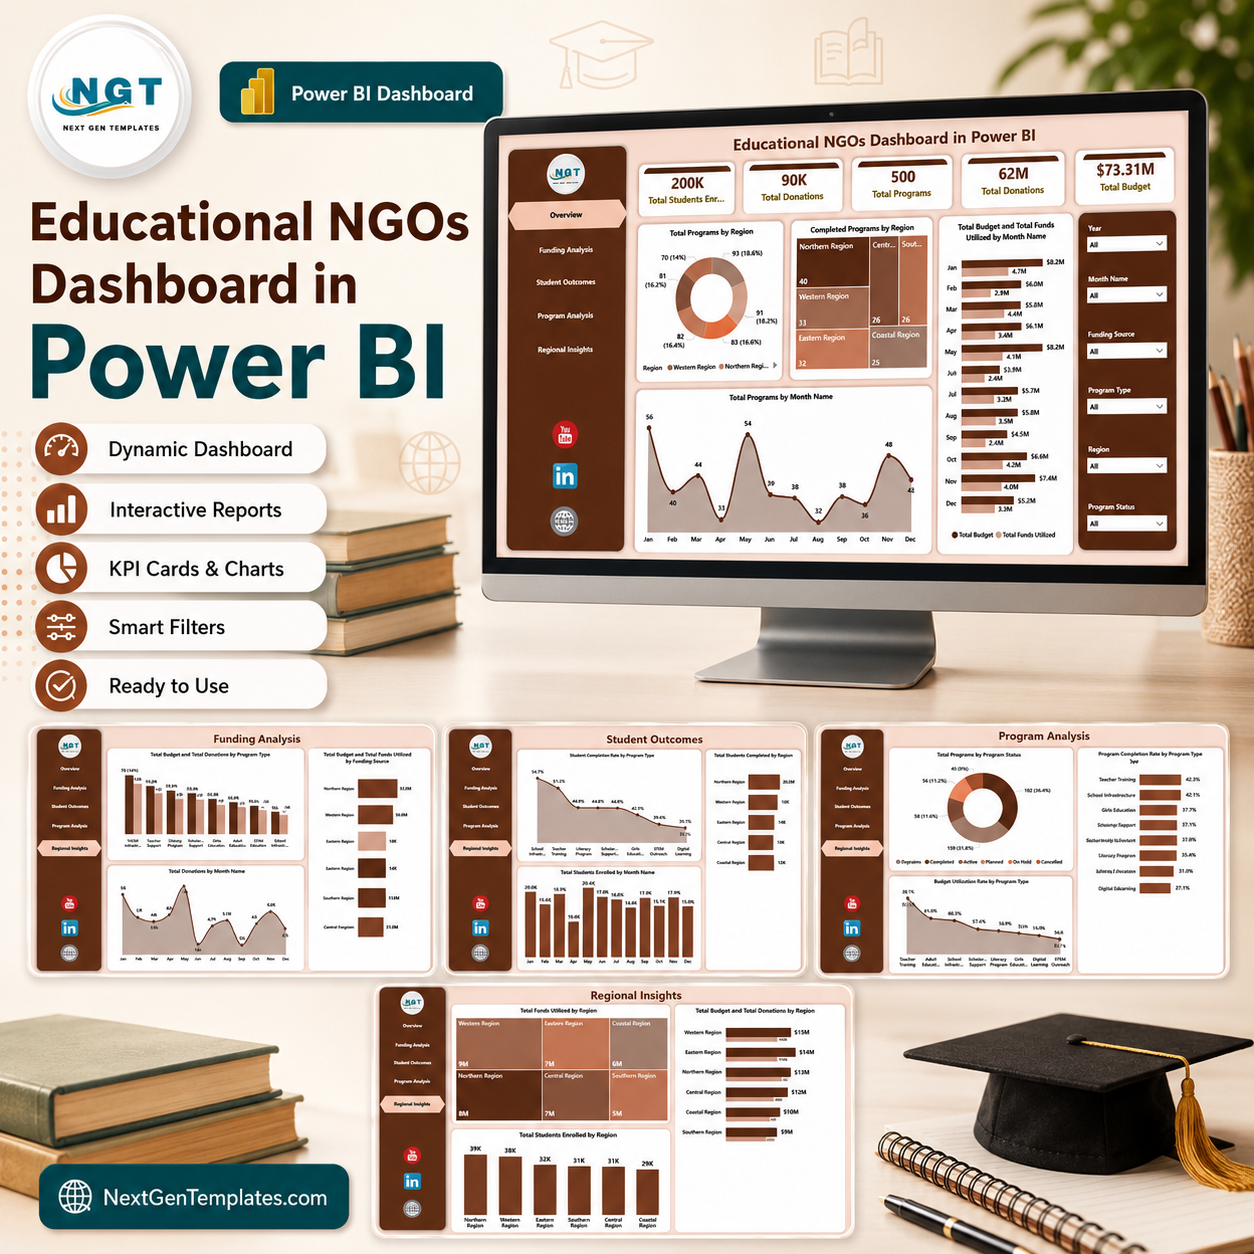
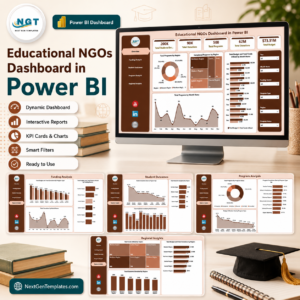
Educational NGOs Dashboard in Power BI helps education-focused nonprofits track student enrollment, donations, programs, budgets, funds utilized, completion rates, and regional impact in one interactive Power BI report. The template includes 5 report pages, executive KPI cards, multiple slicers, and 12+ ready visuals for funding, student outcomes, program delivery, and regional reporting. It is built for teams that need donor-ready analysis without starting a Power BI model from scratch. Instant download. One-time payment. Editable .pbix file. No monthly SaaS fee. Built by PK, a Microsoft Certified Professional with 15+ years of Excel and Power BI experience.
Key Features of Educational NGOs Dashboard in Power BI
- 5 report pages covering Overview, Funding Analysis, Student Outcomes, Program Analysis, and Regional Insights.
- High-level KPI cards for Total Students Enrolled, Total Donations, Total Programs, Total Budget, and Total Funds Utilized.
- Interactive slicers to filter the dashboard by key NGO reporting dimensions.
- Funding visuals for budget, donations, funds utilized, program type, month, and funding source.
- Student outcome visuals for enrollment trends, completion rates, completed students, and regional performance.
- Program delivery analysis for program status, budget utilization, and completion rate by program type.
- Regional comparison for funds utilized, students enrolled, budget, and donations by region.
- Power BI Desktop format so users can edit visuals, fields, colors, data model logic, and source connections.
What’s Inside the Educational NGOs Dashboard in Power BI
1. Overview Page
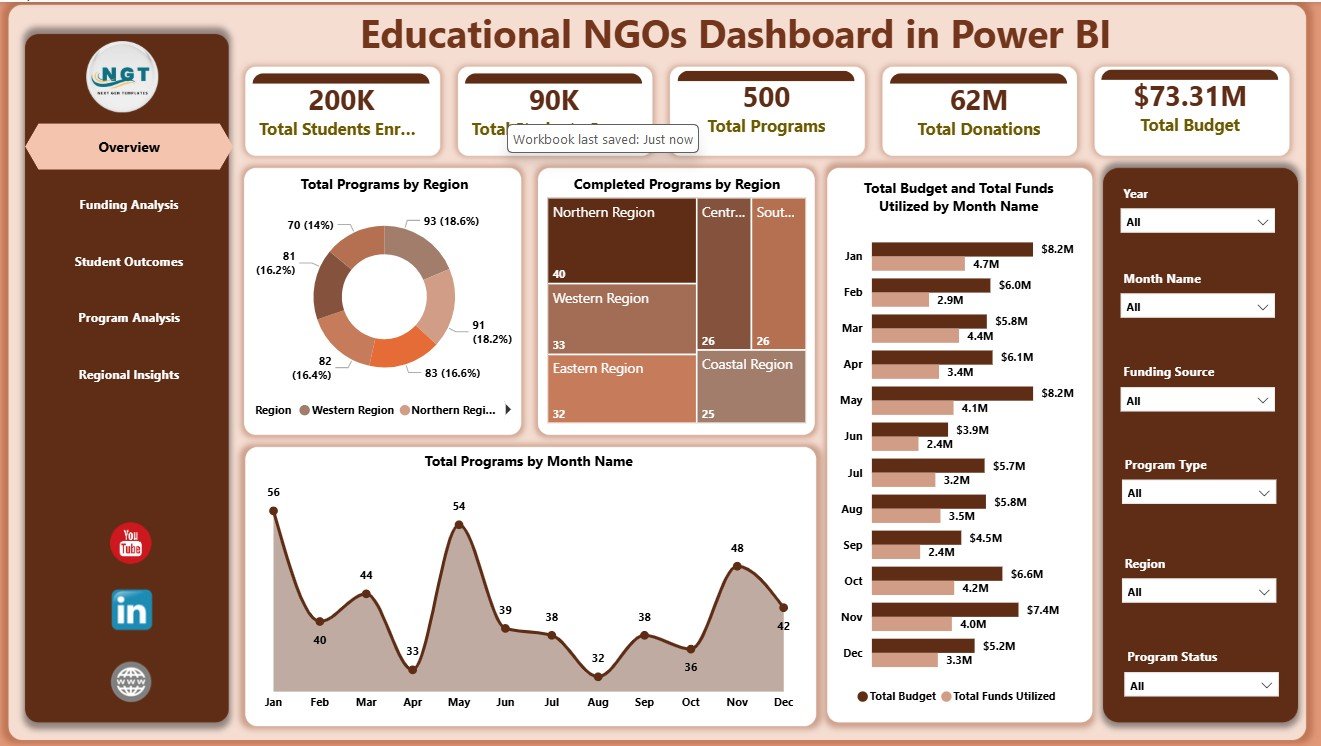
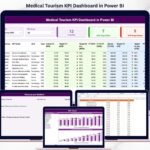
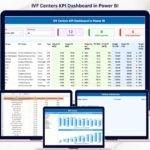
The Overview page gives leadership a fast snapshot of the education NGO portfolio. The cards summarize Total Students Enrolled, Total Donations, Total Programs, Total Budget, and Total Funds Utilized so teams can review scale, funding, and delivery activity before moving into deeper analysis.
Total Programs by Region: This chart shows how programs are distributed across regions. It helps leaders understand program coverage, regional workload, and where expansion or consolidation may be needed.
Completed Programs by Region: This visual compares completed program counts by region. It helps program managers spot strong delivery areas and locations where completion performance may need closer attention.
Total Budget and Total Funds Utilized by Month Name: This chart compares planned budget with actual utilization by month. It is useful for tracking spending pace, funding pressure, and under-utilized budget periods.
Total Programs by Month Name: This chart shows program activity across months. It helps users identify seasonal patterns, planning cycles, and months with heavier program delivery.
Educational NGOs Dashboard in Power BI
2. Funding Analysis
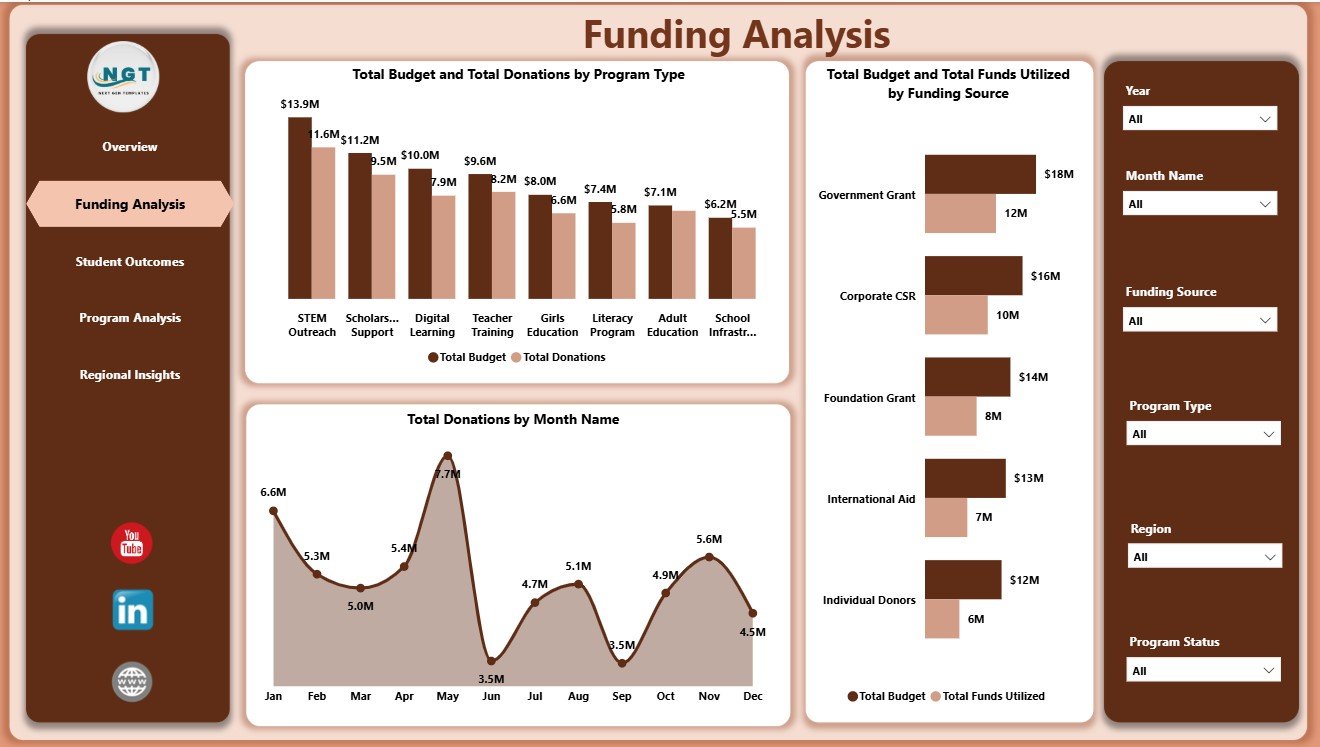
The Funding Analysis page focuses on the relationship between budgets, donations, funding sources, and utilization. Total Budget and Total Donations by Program Type shows which education program categories attract the most funding support. Total Donations by Month Name highlights donation movement over time for monthly donor reporting.
Total Budget and Total Funds Utilized by Funding Source compares approved funding against actual spending by source. This helps NGO finance teams explain whether grants, donations, or other funding channels are being used as planned.
Funding Analysis
3. Student Outcomes
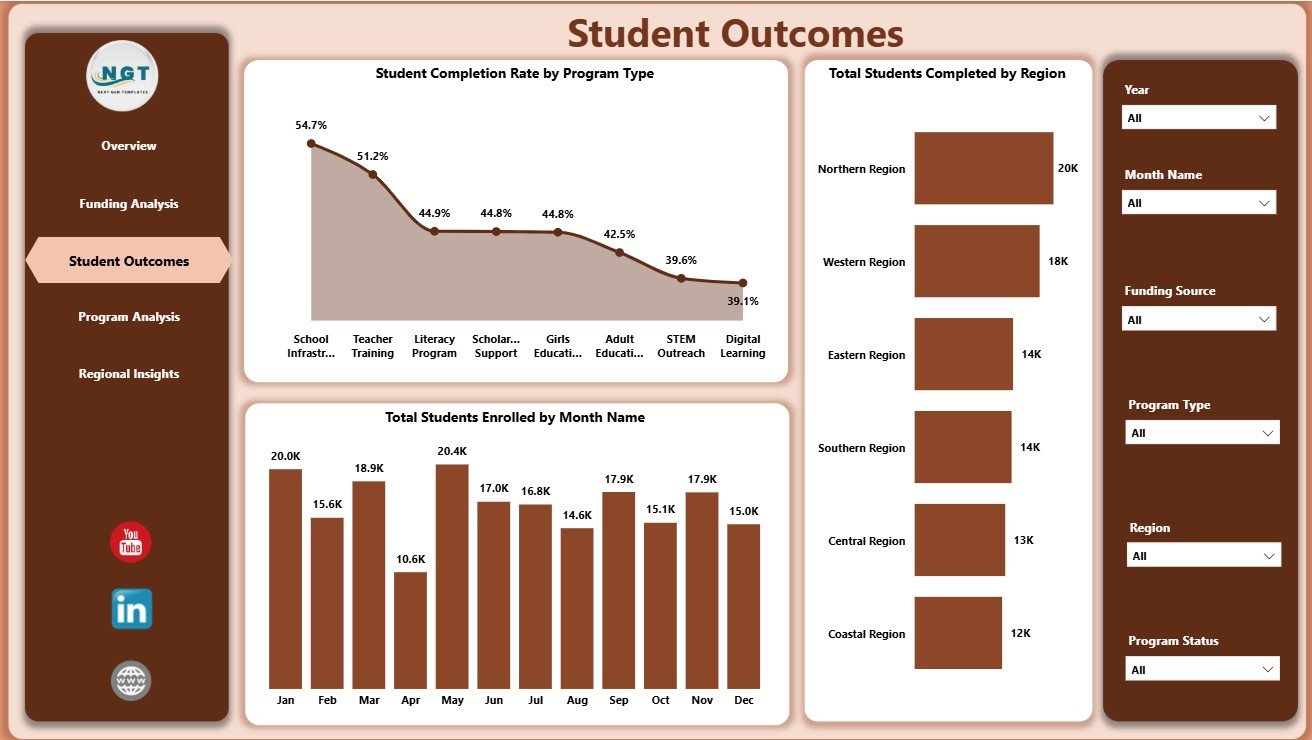
The Student Outcomes page links program activity with learner results. Student Completion Rate by Program Type compares outcome quality across education interventions. Total Students Enrolled by Month Name shows enrollment movement and helps teams monitor campaign or intake cycles.
Total Students Completed by Region identifies where completed student outcomes are strongest. This view is useful for regional reviews, board reports, and donor updates focused on impact.
Student Outcomes
4. Program Analysis
The Program Analysis page reviews operational progress and delivery health. Total Programs by Program Status shows how many programs are active, completed, delayed, pending, or in another status. This gives management a clear delivery pipeline view.
Budget Utilization Rate by Program Type compares spending efficiency by program category. Program Completion Rate by Program Type helps users see which interventions are finishing successfully and which may require attention.
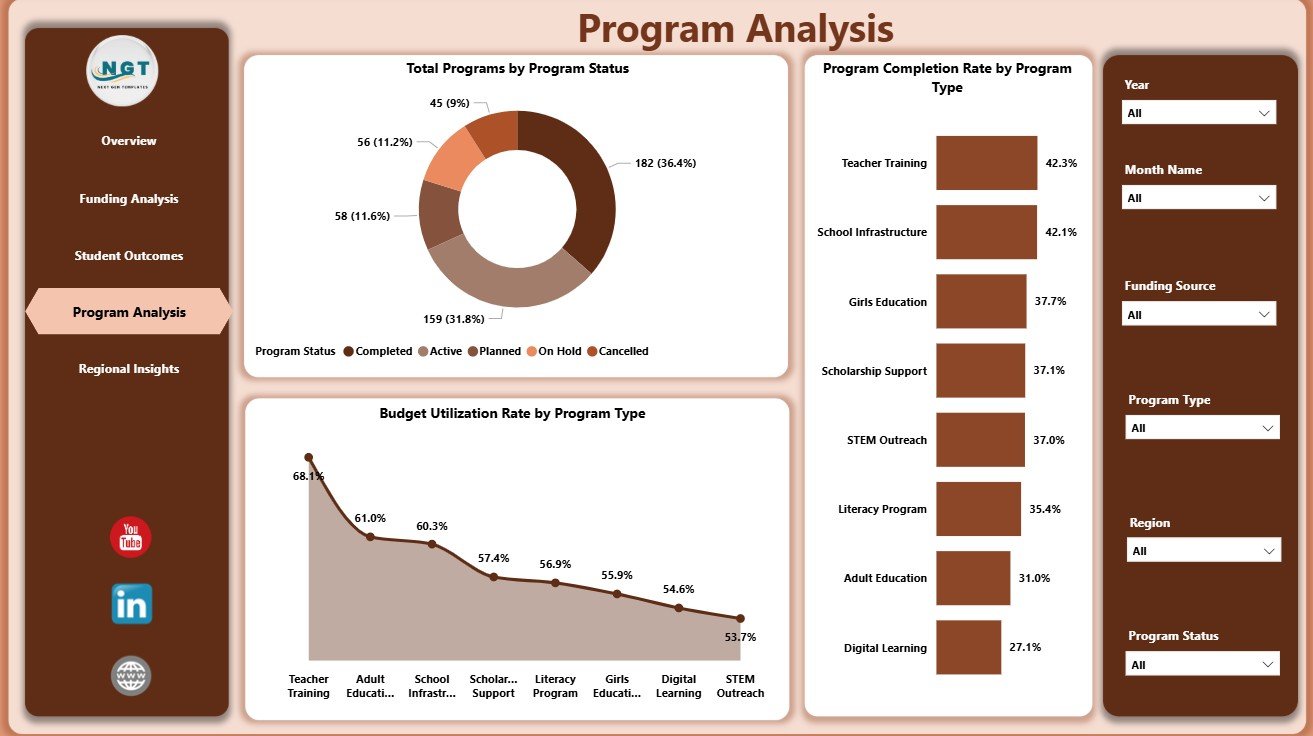
Program Analysis
5. Regional Insights
The Regional Insights page compares funding and education reach by location. Total Funds Utilized by Region shows actual spending across regions, while Total Students Enrolled by Region highlights where student reach is highest.
Total Budget and Total Donations by Region helps users compare planned funding and donation support geographically. It is useful for donor conversations, regional planning, and balancing resources across operating areas.
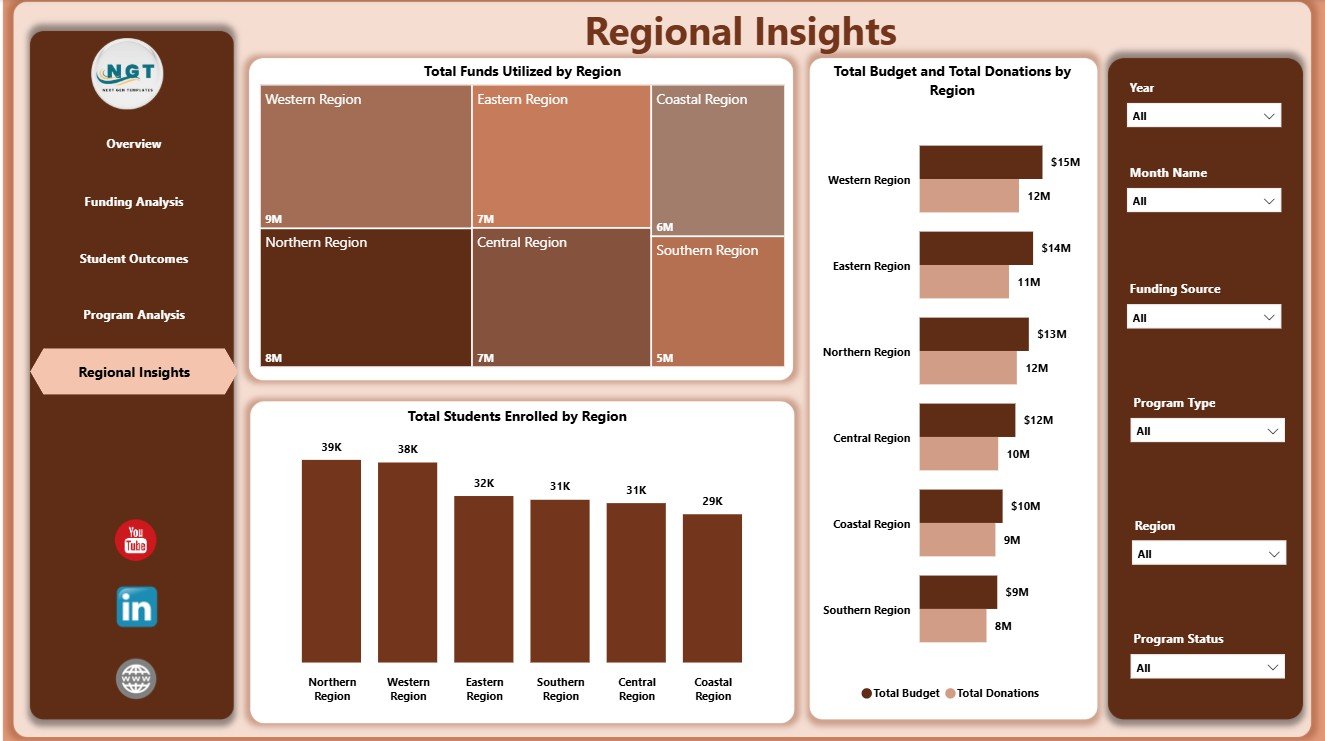
Regional Insights
Educational NGOs Dashboard in Power BI vs. Tableau vs. Paid NGO SaaS – Where This Fits
| Feature | This Power BI Template | Tableau Alternative | Paid NGO SaaS |
|---|---|---|---|
| Cost | $17.99 one-time | Requires Tableau licensing | Monthly or annual subscription |
| Platform | Power BI Desktop | Tableau Desktop or Cloud | Vendor cloud platform |
| Setup time | Open .pbix, replace data, refresh | Build workbook and data model | Requires onboarding |
| Customizable fields | Editable report, model, and visuals | Editable if you build it | Limited by vendor settings |
| Share with link | Available through Power BI Service | Available through Tableau Cloud | Usually account based |
| Year-1 cost at 5 users | $17.99 plus any Power BI licensing | Usually higher license cost | Often hundreds or thousands |
| Education NGO reporting | Pre-built across 5 pages | Must be designed | Depends on module or plan |
Who This Template Is For – and Who It’s Not For
This template is for education NGOs, nonprofit program teams, donor-funded learning projects, scholarship teams, literacy organizations, regional coordinators, and finance analysts who need a ready reporting layer in Power BI. It works best when your data is already structured by month, region, program type, funding source, budget, donations, students enrolled, students completed, and program status.
It is not a donor CRM, accounting system, grant approval workflow, student information system, or case management platform. It does not replace Power BI Service licensing if you want secure online sharing with multiple users.
How to Use the Educational NGOs Dashboard in Power BI
- Download and unzip the product file.
- Open the .pbix file in Power BI Desktop.
- Replace the sample data with your own education NGO data source.
- Refresh the report and review each page.
- Use slicers to filter by region, month, program type, funding source, or status.
- Customize visuals, colors, fields, and labels if needed.
Real-World Use Cases
Amina, NGO director: Amina uses the Overview and Regional Insights pages before board meetings to explain student reach, donation movement, budgets, utilization, and regional delivery.
Ravi, program manager: Ravi reviews Program Analysis and Student Outcomes to identify which program types are completing successfully and where completion rates need attention.
Sofia, donor reporting analyst: Sofia uses Funding Analysis to prepare monthly donor updates showing budget, donations, utilization, program type, and funding source performance.
Frequently Asked Questions
What is included in the Educational NGOs Dashboard in Power BI?
The .pbix file includes 5 report pages, KPI cards, slicers, and visuals for funding, student outcomes, program delivery, and regional insights.
Do I need Power BI Desktop?
Yes. Open the file in Power BI Desktop, which is free from Microsoft. Sharing through Power BI Service may require Microsoft licensing.
Can I use my own NGO data?
Yes. Replace the sample source with your own structured data and refresh the report.
Can I customize the visuals?
Yes. You can edit charts, colors, fields, relationships, measures, and report page layouts in Power BI Desktop.
Is this only for educational NGOs?
It is designed for education-focused nonprofit reporting, but similar program-based nonprofits can adapt the model if their data fields are close.
Does the dashboard include a donor CRM?
No. It is an analytics dashboard, not a CRM, accounting tool, or donor communication system.
About the Author
Built by PK – Microsoft Certified Professional with 15+ years of Excel, Google Sheets, and Power BI experience. Founder of NextGenTemplates, reaching 300K+ subscribers across YouTube channels. Every template is hand-built and tested before release.
Explore Related Templates
- Educational NGOs Dashboard in Excel
- Disability Support NGOs Dashboard in Power BI
- Nonprofit Grant Dashboard in Power BI
- Browse Power BI Dashboard Templates
Download the Educational NGOs Dashboard in Power BI today and turn education program data into clear, interactive reporting for donors, leadership, and field teams.
Last updated: June 7, 2026.
Watch the step-by-step video tutorial:


Reviews
There are no reviews yet.