

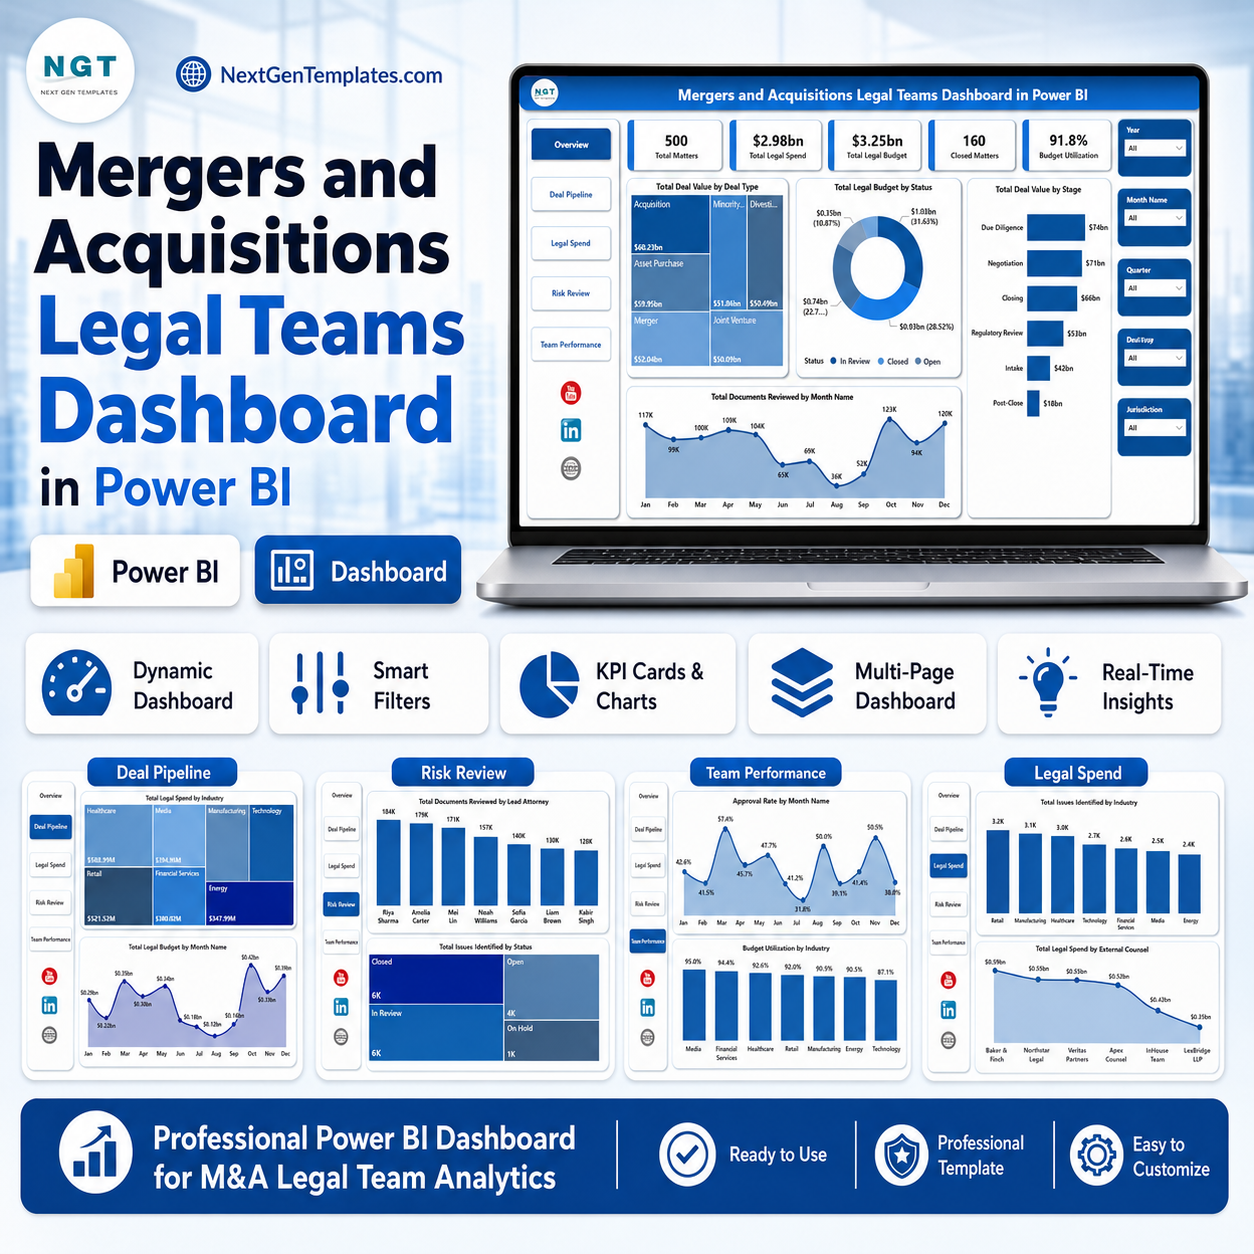
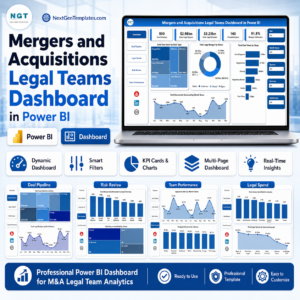
Mergers and Acquisitions Legal Teams Dashboard in Power BI gives legal operations leaders, M&A counsel, due diligence managers, and corporate legal teams a ready PBIX report with 5 Power BI pages, 5 executive cards, 16 focused visuals, and interactive slicers. M&A legal work can involve hundreds of documents, multiple deal stages, shifting budgets, external counsel, and approval gates; this template turns that activity into a clear reporting layer. Built by PK, trusted by 300K+ learners across YouTube channels, it is a one-time download with no monthly SaaS commitment.
Key Features of Mergers and Acquisitions Legal Teams Dashboard in Power BI
- 5 report pages: Overview Page, Deal Pipeline, Legal Spend, Risk Review, and Team Performance.
- Executive KPI cards: Total Matters, Total Legal Spend, Total Legal Budget, Closed Matters, and Budget Utilization.
- Deal analytics: Review total deal value by deal type and stage, plus legal budget by status.
- Spend control: Analyze legal spend by industry, external counsel, lead attorney, and month.
- Risk and document review: Track documents reviewed, issues identified, approval rate, and matter status.
- Editable PBIX file: Open in Power BI Desktop, replace the sample data, refresh, and customize visuals.
What’s Inside the Mergers and Acquisitions Legal Teams Dashboard in Power BI
1 – Overview Page
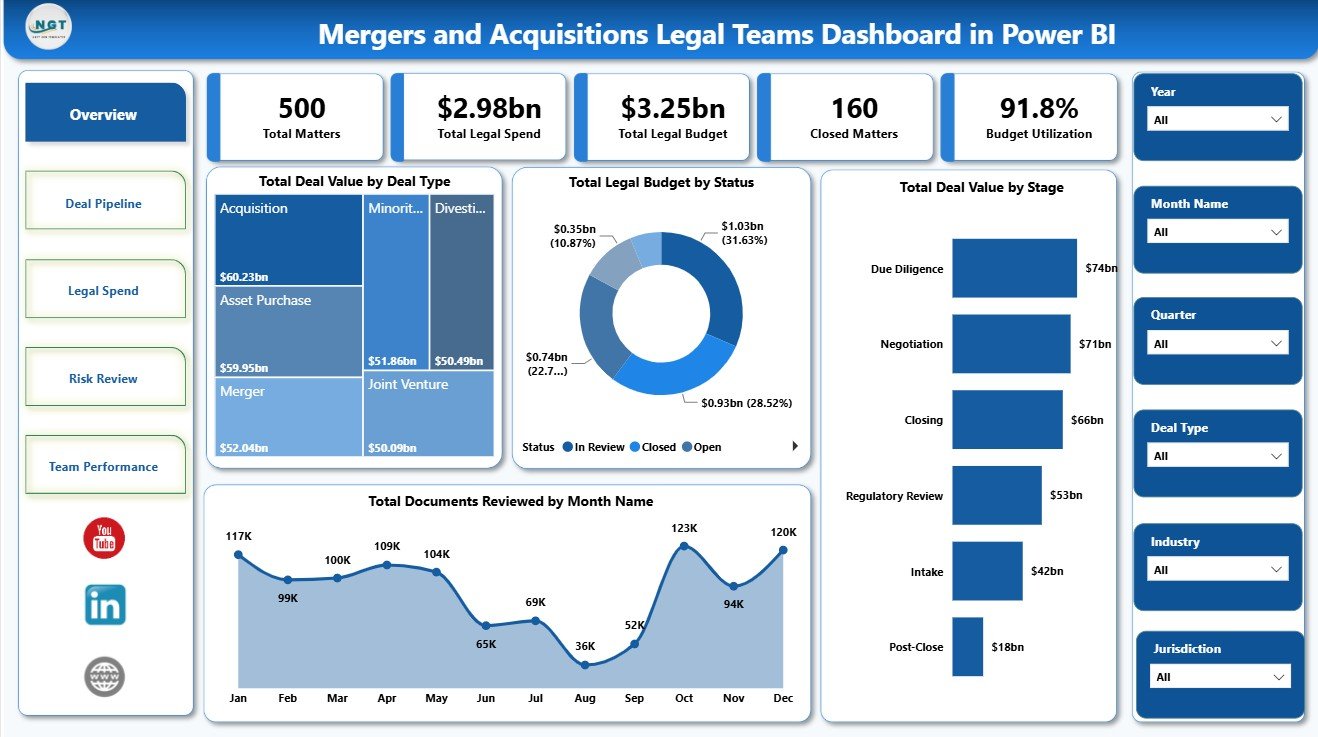
The Overview Page gives a high-level snapshot of M&A legal activity. The top cards show Total Matters, Total Legal Spend, Total Legal Budget, Closed Matters, and Budget Utilization so leadership can check volume, cost, progress, and budget pressure quickly.
Total Deal Value by Deal Type: This chart compares deal value across acquisition, merger, divestiture, joint venture, or other deal types. It helps legal leaders understand where the largest transaction exposure sits.
Total Legal Budget by Status: This visual shows budget distribution by matter status. It helps teams see how much budget is tied to active, closed, pending, or delayed matters.
Total Deal Value by Stage: This chart tracks deal value across pipeline stages. It helps counsel review whether major value is concentrated in diligence, negotiation, approval, or closing.
Total Documents Reviewed by Month Name: This monthly view shows document review workload over time. It helps teams plan reviewer capacity around diligence peaks.
2 – Deal Pipeline
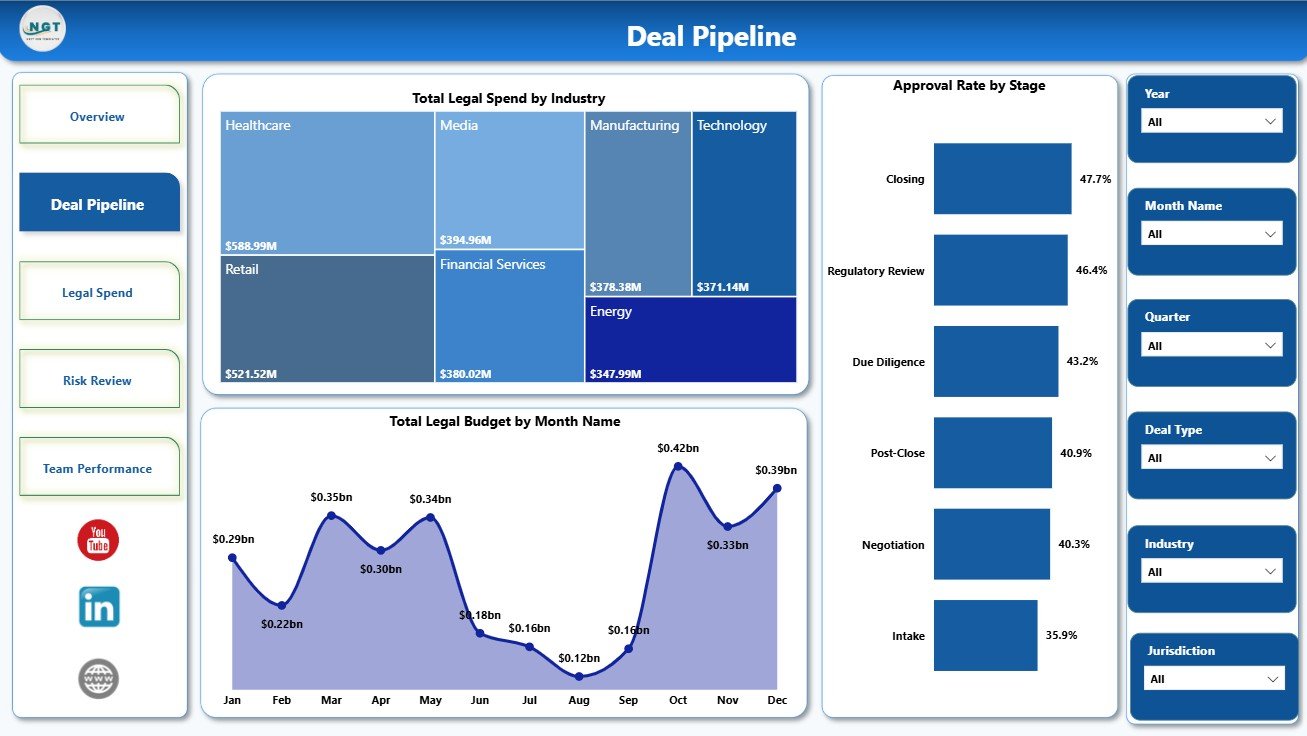
The Deal Pipeline page focuses on industry, monthly budget movement, and approval progress by stage.
Total Legal Spend by Industry: This chart compares legal spend across industries involved in the deal pipeline. It helps teams understand which sectors require heavier legal support.
Total Legal Budget by Month Name: This monthly trend shows how planned legal budget changes across the year. It supports forecasting, accrual reviews, and budget planning.
Approval Rate by Stage: This visual compares approval success across deal stages. It helps identify where reviews slow down or approvals need tighter coordination.
3 – Legal Spend
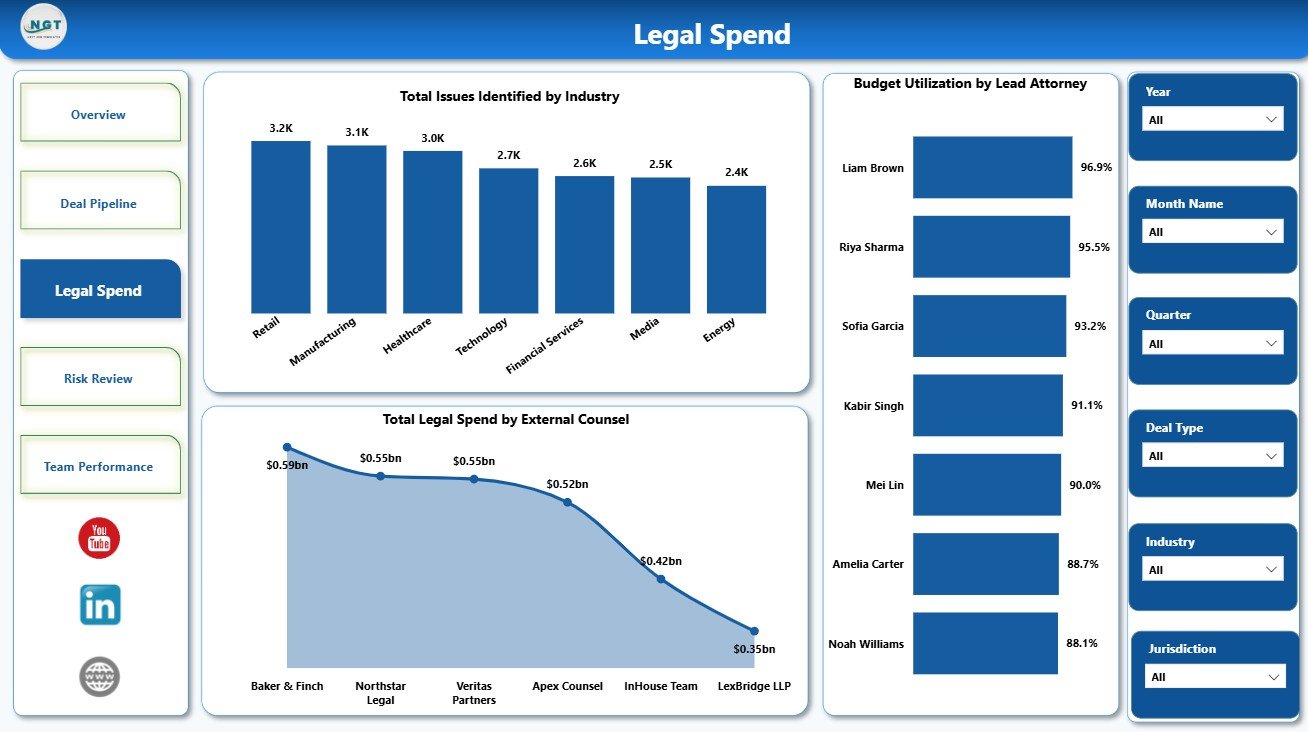
The Legal Spend page helps finance, legal ops, and matter owners compare issues, counsel cost, and attorney-level budget utilization.
Total Issues Identified by Industry: This chart shows where diligence issues are concentrated by industry. It helps teams see which sectors create higher legal review complexity.
Total Legal Spend by External Counsel: This visual compares spend across outside counsel. It helps manage vendor cost, matter allocation, and fee conversations.
Budget Utilization by Lead Attorney: This chart compares how budget is being used by lead attorney. It supports workload review and early identification of budget overruns.
4 – Risk Review
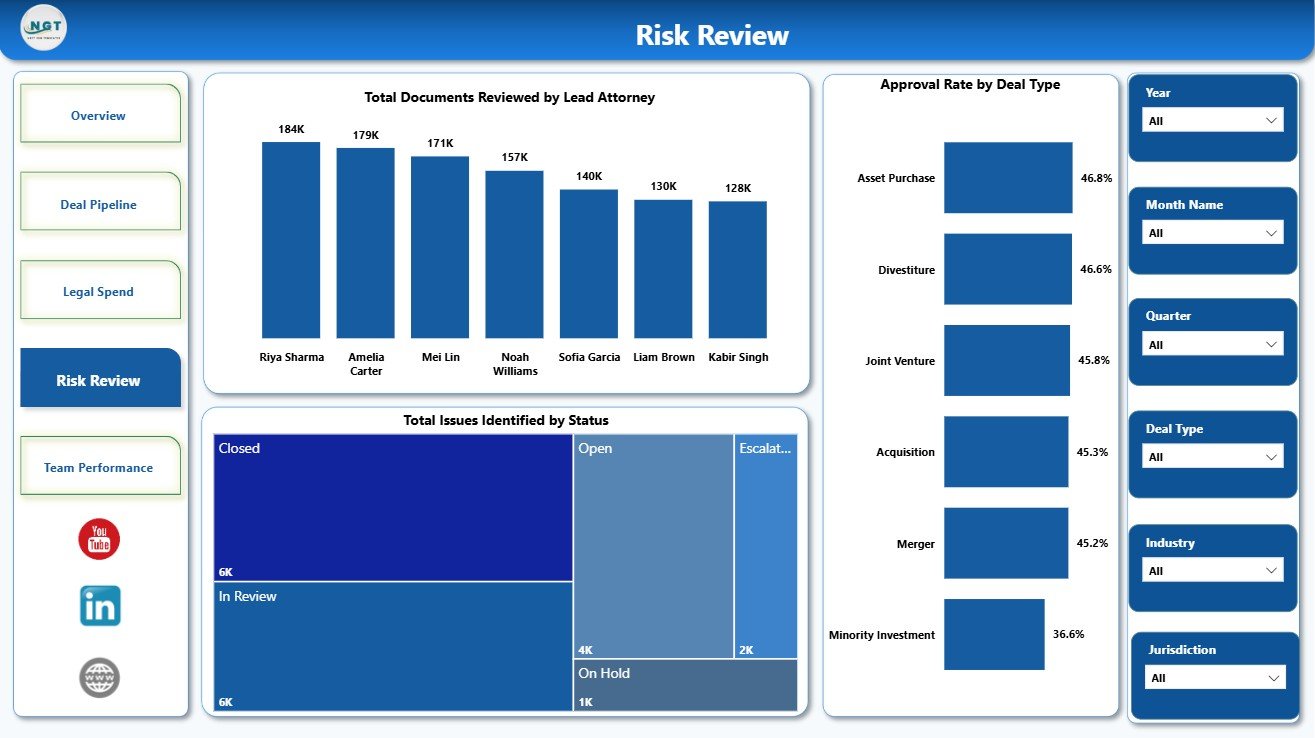
The Risk Review page connects document review workload, issue status, and approval performance.
Total Documents Reviewed by Lead Attorney: This chart compares review volume by attorney. It helps leaders understand workload balance and diligence ownership.
Total Issues Identified by Status: This visual shows issues grouped by status. It helps teams focus on open, escalated, resolved, and pending risk items.
Approval Rate by Deal Type: This chart compares approval performance across deal types. It helps legal teams see where deal structures create friction.
5 – Team Performance
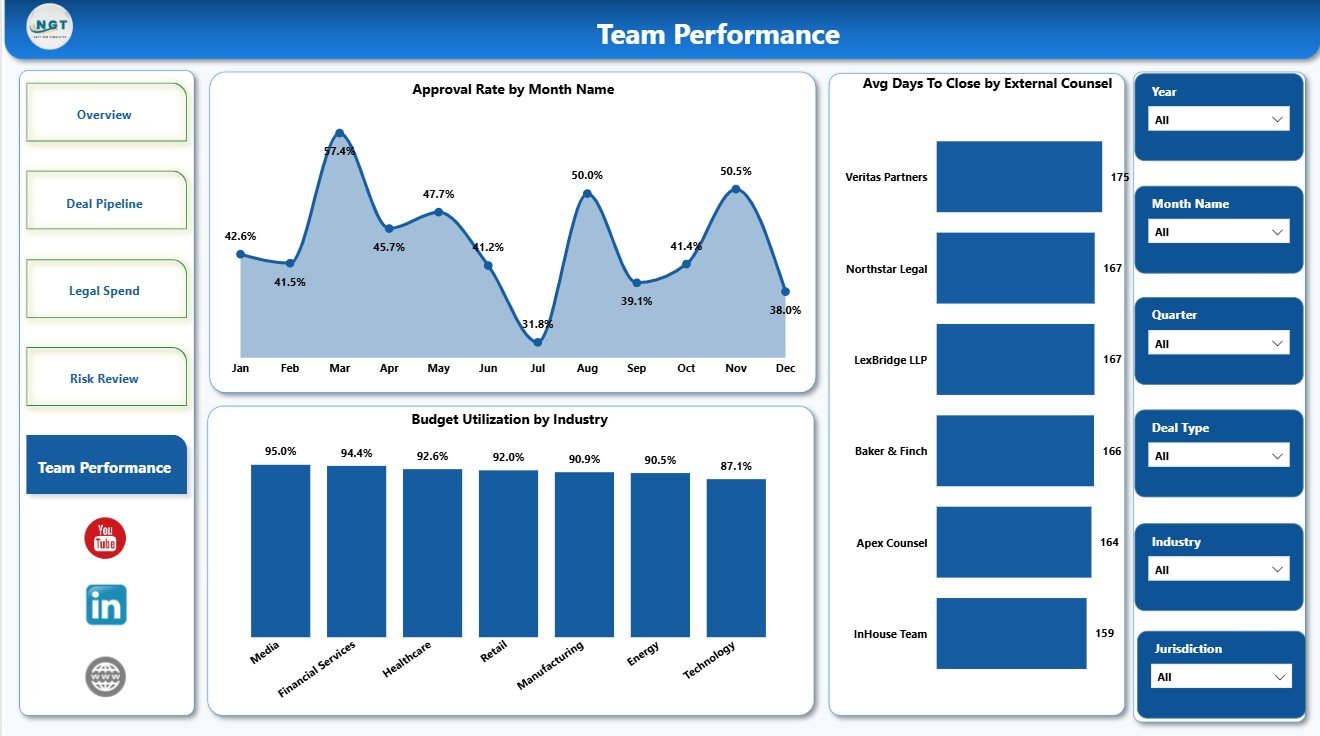
The Team Performance page helps managers review approval trends, industry utilization, and external counsel cycle time.
Approval Rate by Month Name: This trend shows approval performance by month. It helps teams see whether governance reviews are improving or slowing.
Budget Utilization by Industry: This chart compares budget consumption across industries. It helps explain where spend pressure is highest.
Avg Days To Close by External Counsel: This visual compares closing speed by outside counsel. It helps evaluate counsel responsiveness and matter throughput.
Mergers and Acquisitions Legal Teams Dashboard in Power BI vs. Tableau vs. Paid Legal SaaS – Where This Fits
| Feature | This Power BI dashboard | Tableau or Qlik alternative | Paid legal SaaS |
|---|---|---|---|
| Cost | $17.99 sale price, one-time | License plus build time | Recurring subscription |
| Platform | Power BI Desktop / Service | BI platform required | Vendor-hosted system |
| Setup time | Open PBIX, replace data, refresh | Design and model required | Implementation and onboarding |
| Customizable fields | Editable pages, fields, visuals, and measures | Editable with BI skills | Limited by vendor settings |
| Year-1 cost at 5 users | $17.99 plus any Microsoft licensing | License dependent | Often hundreds or thousands |
| M&A legal analysis | Matters, spend, budget, deal value, approvals, risk, documents, and team performance | Must be built | Depends on module and export access |
Who This Template Is For – and Who It’s Not For
This template is for M&A legal teams, in-house counsel, legal operations managers, corporate development analysts, due diligence leaders, external counsel managers, and consultants who already maintain matter or deal data and need an editable Power BI reporting layer.
It is not a legal document repository, contract lifecycle management platform, e-signature system, virtual data room, timekeeping system, or matter management database. Use it after your data is structured enough for Power BI reporting.
How to Use the Mergers and Acquisitions Legal Teams Dashboard in Power BI
- Download and unzip the product file.
- Open the PBIX file in Power BI Desktop.
- Review the sample pages, cards, charts, slicers, and fields.
- Replace the sample data or connect your prepared legal matter dataset.
- Refresh the report and validate matters, spend, budget, deal value, documents, issues, approvals, and close days.
- Customize visuals, colors, page names, or measures as needed.
Real-World Use Cases
Anika, legal operations manager: reviews legal spend by external counsel and budget utilization by attorney before a monthly finance meeting.
Marcus, corporate development counsel: uses deal value by stage and approval rate by stage to prepare an acquisition pipeline review.
Priya, due diligence lead: monitors documents reviewed, issues identified, and average days to close to keep deal reviews moving.
Frequently Asked Questions
What does this dashboard track?
It tracks matters, legal spend, legal budget, closed matters, budget utilization, deal value, documents reviewed, issues identified, approval rate, lead attorneys, external counsel, industry, status, stage, and close days.
Do I need Power BI Desktop?
Yes. The PBIX file is designed for Microsoft Power BI Desktop.
Can I use my own M&A legal data?
Yes. Replace the sample data or connect your prepared data source, then refresh the report.
Can I customize the report?
Yes. You can edit pages, slicers, visuals, fields, measures, colors, and labels.
Does it manage documents directly?
No. It reports on document review activity; it is not a document management system or data room.
Can I publish it to Power BI Service?
Yes, if your Microsoft account, license, and organization permissions allow publishing and sharing.
About the Author
Built by PK – Microsoft Certified Professional with 15+ years of Excel, Google Sheets, and Power BI experience. Founder of NextGenTemplates, reaching 300K+ subscribers across YouTube channels. Every template is hand-built and tested before release.
Explore Related Templates
- Legal Research Dashboard in Power BI
- Legal Research KPI Dashboard in Power BI
- Intellectual Property Law Firms Dashboard in Power BI
- Legal Dashboard in Power BI
- Browse Power BI Dashboard templates
Download the Mergers and Acquisitions Legal Teams Dashboard in Power BI and start reviewing matter volume, legal budget, counsel spend, deal value, approval rate, document review, risk issues, and team performance in one editable PBIX report.
Last updated: July 8, 2026.























Reviews
There are no reviews yet.