Fertilizer Manufacturing Dashboard in Power BI gives plant leaders, production supervisors, quality teams, costing analysts, and operations managers a ready .pbix reporting template with 5 Power BI pages, 5 high-level KPI cards, 16 analytical visuals, and slicer-based filtering. For $17.99 one-time, teams can review raw material cost, energy cost, labor cost, quality score, good units, output quantity, production status, product performance, shifts, operators, grades, plants, and production lines without building a report from zero. Built by PK, Microsoft Certified Professional with 15+ years of Excel, Google Sheets, and Power BI experience and 300K+ YouTube subscribers, this template is designed for faster manufacturing reviews with instant access, lifetime use, and no dashboard SaaS subscription.
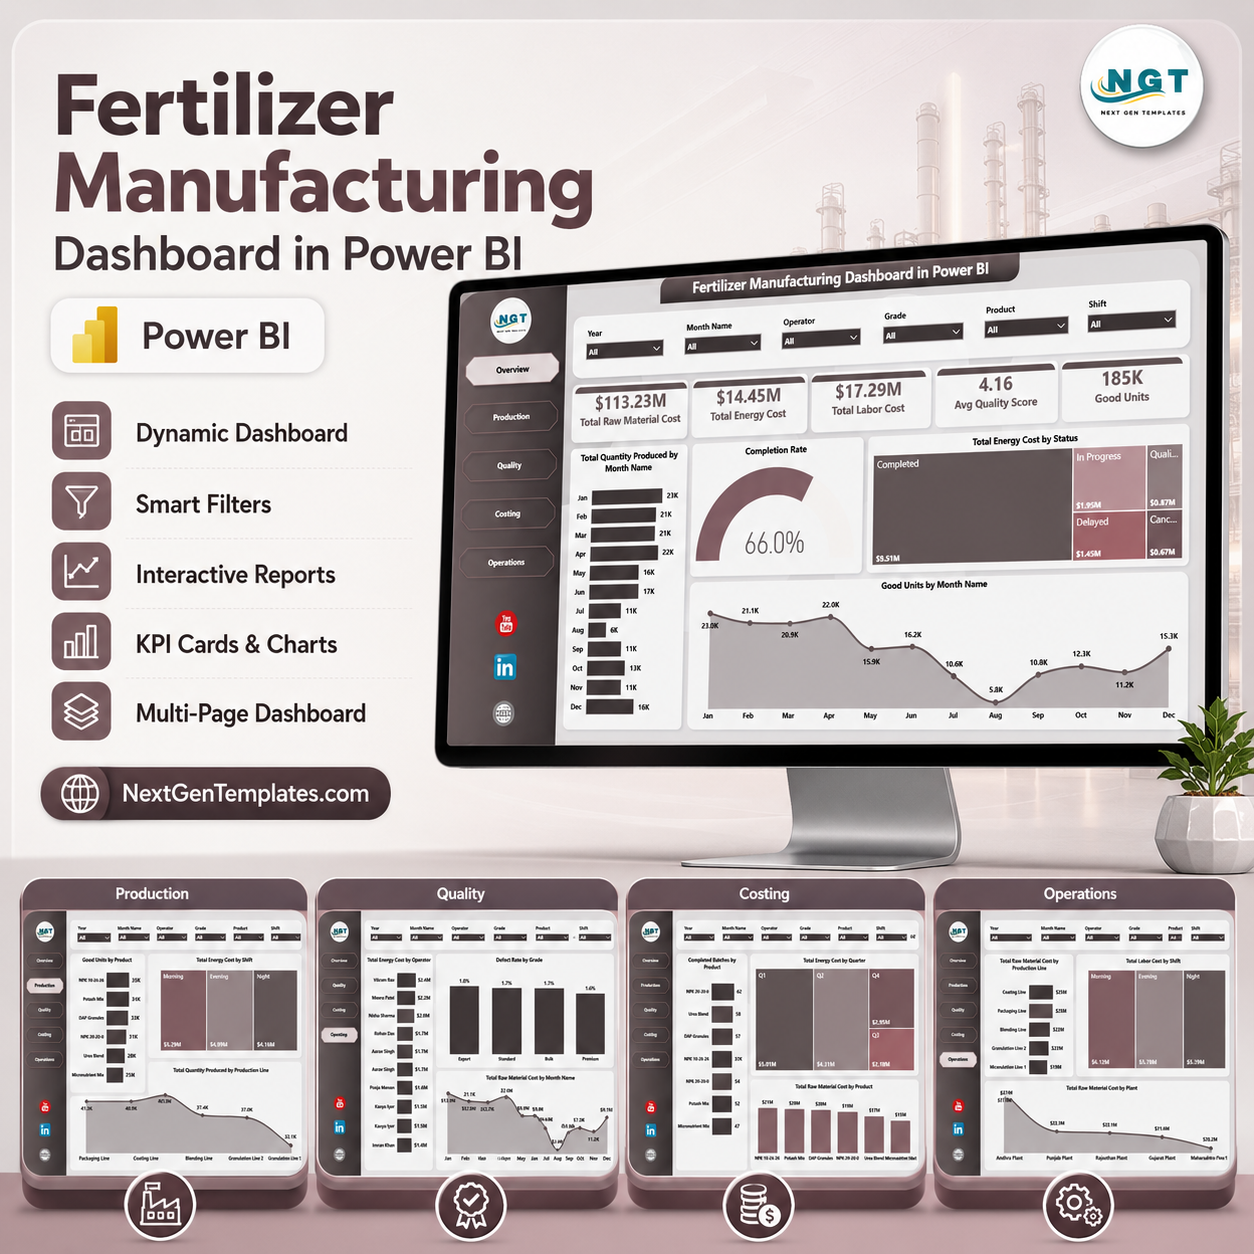
Key Features of Fertilizer Manufacturing Dashboard in Power BI
- 5 Power BI report pages covering Overview, Production, Quality, Costing, and Operations.
- 5 KPI cards for Total Raw Material Cost, Total Energy Cost, Total Labor Cost, Avg Quality Score, and Good Units.
- Interactive slicers so users can filter the report quickly by available manufacturing fields.
- Production output analysis by month, product, production line, production status, and shift.
- Quality monitoring by operator, grade, defect rate, and raw material cost trend.
- Costing views for completed batches, quarterly energy cost, and raw material cost by product.
- Editable Power BI file so users can adjust measures, visuals, colors, labels, filters, and report pages in Power BI Desktop.
What’s Inside the Fertilizer Manufacturing Dashboard in Power BI
1. Overview Page
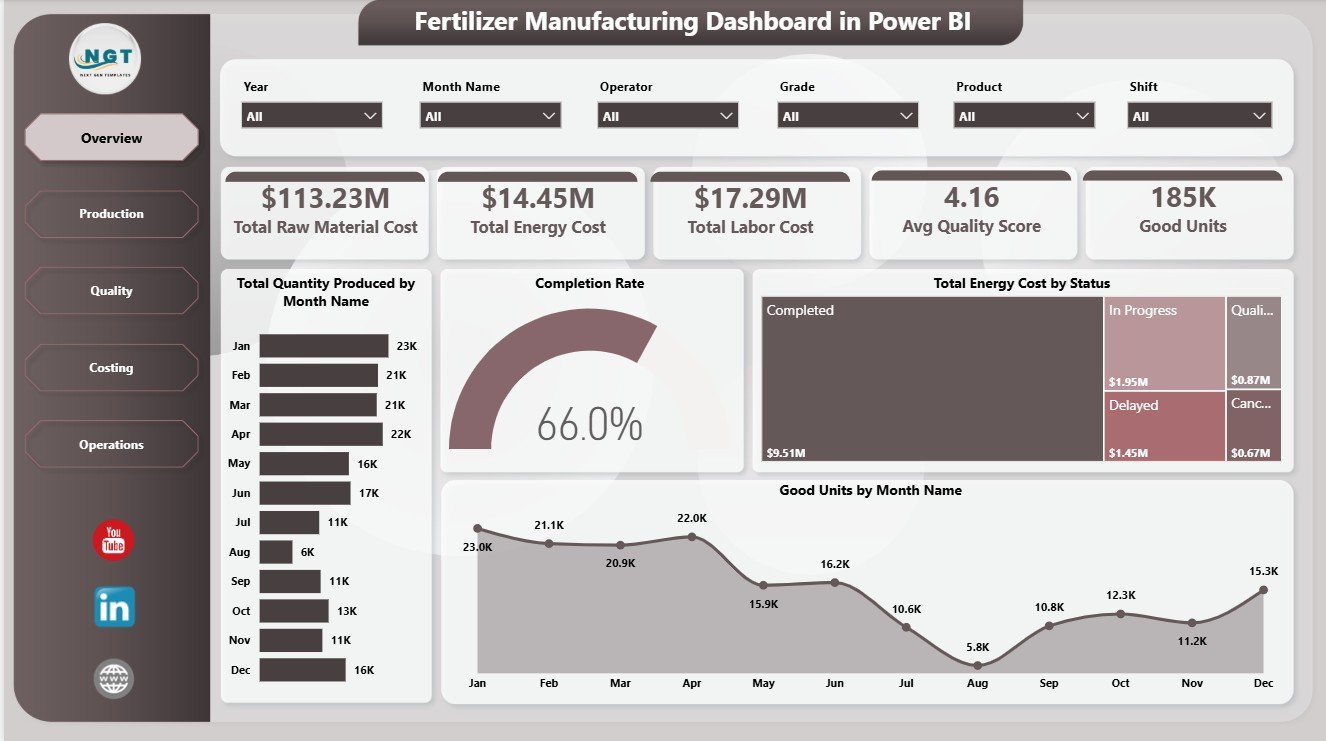
The Overview page gives decision-makers a fast summary of production cost, quality, and output. The top cards show Total Raw Material Cost, Total Energy Cost, Total Labor Cost, Avg Quality Score, and Good Units so teams can review the main manufacturing performance signals before drilling into detailed visuals.
Total Quantity Produced by Month Name: This chart tracks monthly production volume and helps managers identify seasonality, capacity pressure, and output changes. It is useful for spotting whether production is increasing, declining, or staying flat across the reporting period.
Completion Rate by Production Status: This visual summarizes completion performance by production status. It helps teams see where work is finished, delayed, pending, or still in progress.
Total Energy Cost by Status: This chart connects energy cost with production status. It helps finance and operations teams see whether certain statuses are linked with higher energy spend.
Good Units by Month Name: This trend focuses on accepted output rather than total production. It helps quality and production teams compare usable output across months.
2. Production Page
The Production page focuses on product output, shift-level energy cost, and line-level quantity. Good Units by Product shows which fertilizer products produce the highest accepted units. Total Energy Cost by Shift helps compare energy spend across shifts, while Total Quantity Produced by Production Line highlights line-level capacity and production contribution.

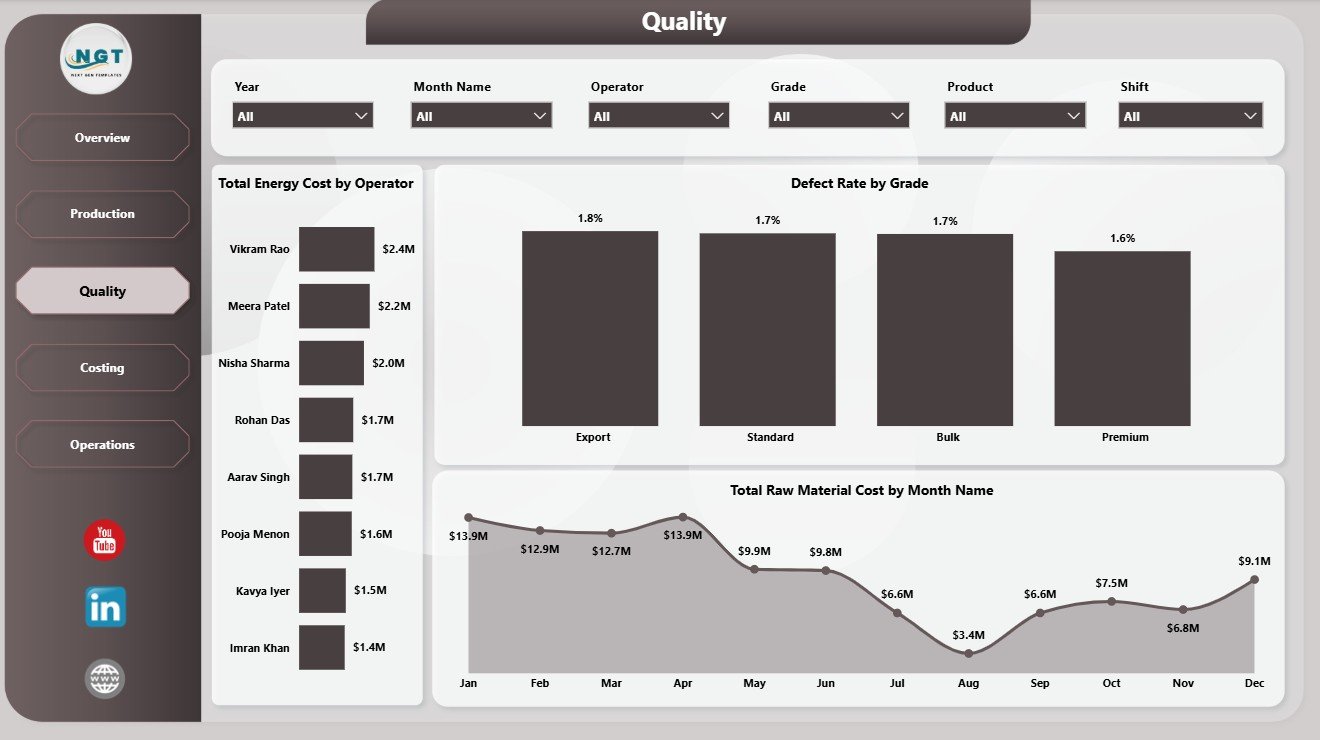
3. Quality Page
The Quality page helps teams review operator cost, defect rate, grade performance, and monthly raw material cost. Total Energy Cost by Operator compares operating cost at the operator level. Defect Rate by Grade highlights where quality issues are concentrated, and Total Raw Material Cost by Month Name shows cost movement over time.
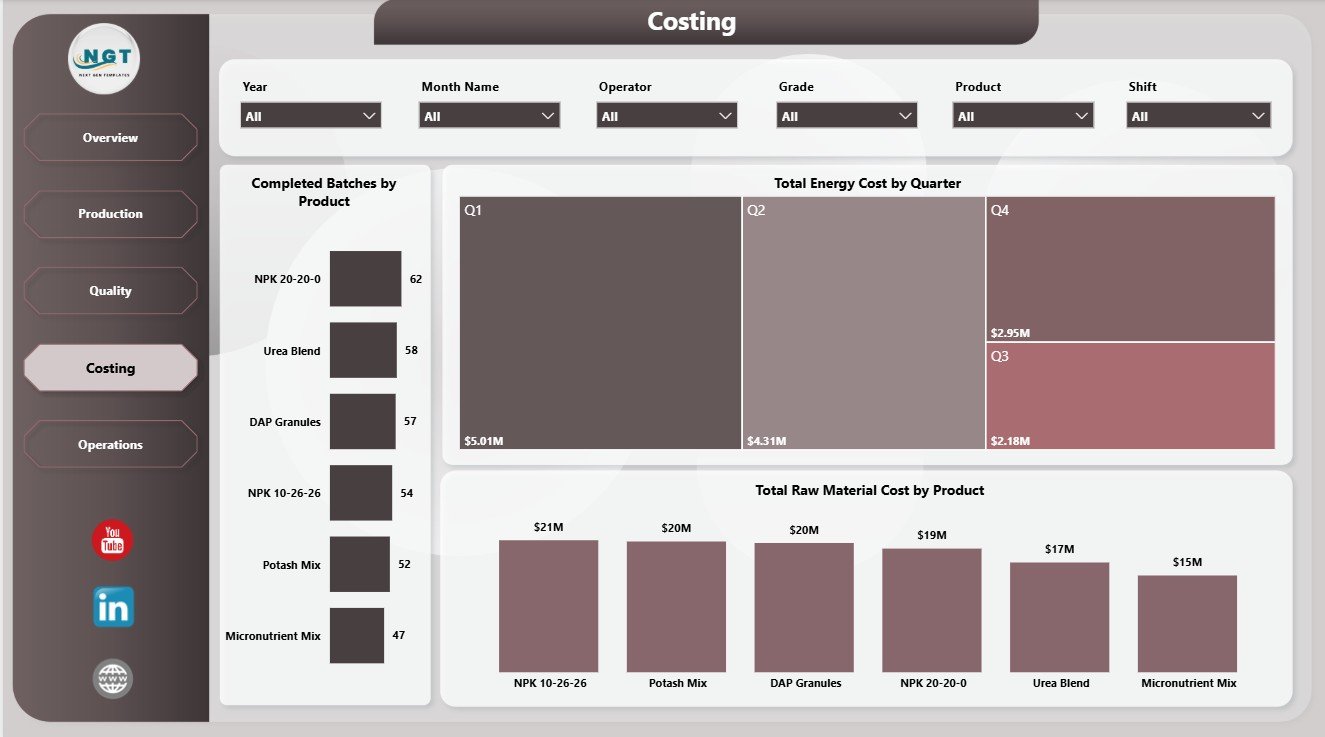
4. Costing Page
The Costing page gives finance and plant teams a focused view of batch completion and cost. Completed Batches by Product shows which products are moving through production successfully. Total Energy Cost by Quarter supports quarterly cost review, while Total Raw Material Cost by Product identifies products with the highest material spend.
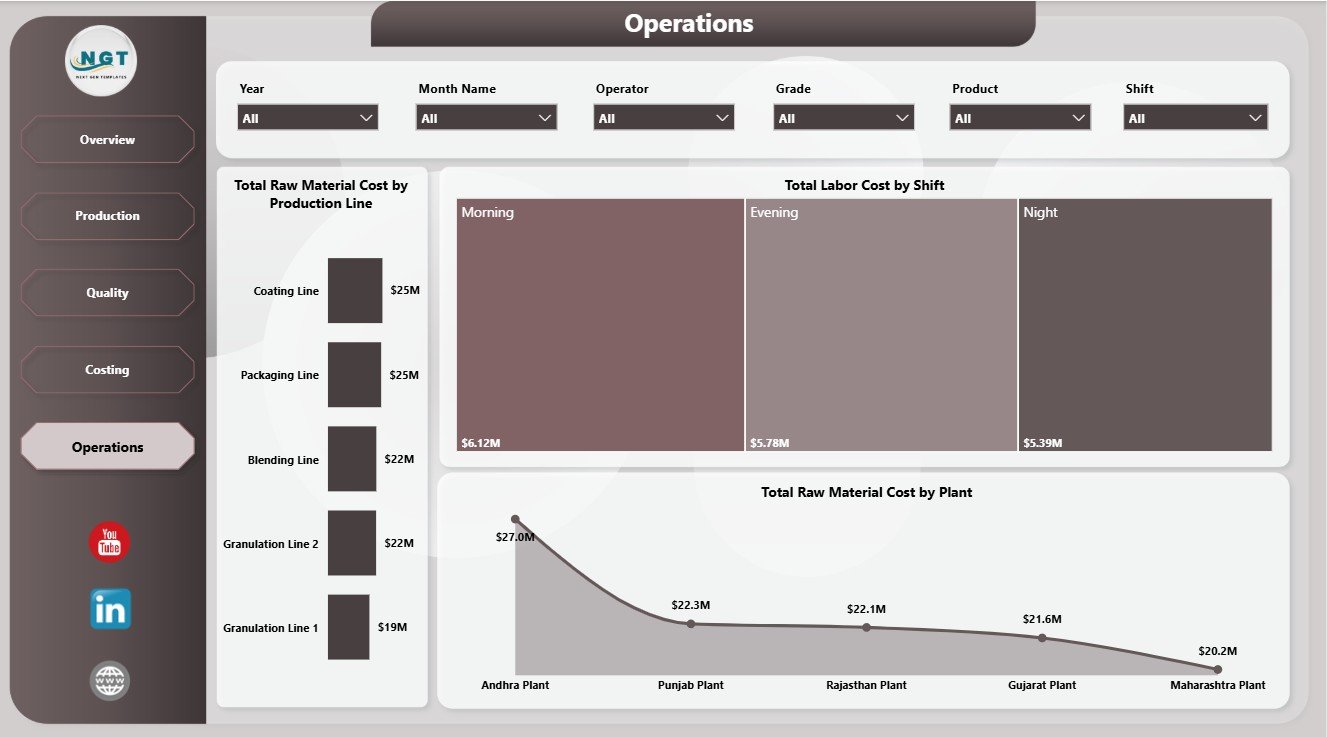
5. Operations Page
The Operations page supports plant, shift, and line-level review. Total Raw Material Cost by Production Line helps locate line-level material pressure. Total Labor Cost by Shift compares labor spend across shifts, and Total Raw Material Cost by Plant identifies plants with higher material consumption or cost exposure.
Fertilizer Manufacturing Dashboard in Power BI vs. Tableau vs. Paid Manufacturing SaaS – Where This Fits
| Feature | This Power BI Dashboard | Tableau Alternative | Paid Manufacturing SaaS |
|---|---|---|---|
| Cost | $17.99 one-time | License plus dashboard build time | Monthly or annual subscription |
| Platform | Power BI Desktop and Power BI Service | Tableau Desktop or Cloud | Vendor cloud platform |
| Setup time | Open .pbix, replace data, refresh | Build or adapt workbook | Requires onboarding and configuration |
| Real-time team collaboration | Available through Power BI Service setup | Available through Tableau Cloud | Usually included by plan |
| Mobile access | Available after publishing | Available after publishing | Usually included |
| Customizable fields | Editable model, visuals, fields, and measures | Editable if you own the workbook | Limited by vendor settings |
| Share with link | Available through Power BI Service | Available through Tableau Cloud | Login controlled |
| Year-1 cost at 5 users | $17.99 plus any Microsoft licensing | Usually much higher | Often hundreds or thousands |
| Manufacturing page structure | 5 ready pages included | Requires dashboard design | Depends on reporting module |
Who This Template Is For – and Who It’s Not For
This template is for fertilizer manufacturers, plant managers, production supervisors, quality leads, finance analysts, operations teams, and Power BI users who need recurring visibility into production volume, batch completion, raw material cost, energy cost, labor cost, defects, grades, shifts, operators, plants, and production lines.
It is not a live MES, ERP, MRP, inventory planning system, equipment sensor platform, or shop-floor data capture tool. It works best when your source data is already available in clean tables that can be refreshed in Power BI Desktop.
How to Use the Fertilizer Manufacturing Dashboard in Power BI
- Download and unzip the dashboard package.
- Open the .pbix file in Power BI Desktop.
- Review the sample manufacturing fields and report pages.
- Replace or connect your own fertilizer manufacturing data source.
- Refresh the report and validate the KPI cards.
- Use slicers to filter by product, plant, line, shift, operator, grade, month, quarter, status, and other available fields.
- Customize visuals, labels, measures, and colors as needed.
Real-World Use Cases
Anita, Plant Manager: Anita reviews the Overview and Operations pages before weekly production meetings to compare cost, output, and plant-level material usage.
Rahul, Quality Lead: Rahul uses the Quality page to track defect rate by grade and operator-level cost patterns before investigating process issues.
Meera, Cost Analyst: Meera uses Costing to explain energy cost by quarter and raw material cost by product during month-end reviews.
Frequently Asked Questions
What does this Power BI dashboard track?
It tracks raw material cost, energy cost, labor cost, average quality score, good units, quantity produced, production status, products, shifts, operators, grades, months, quarters, production lines, and plants.
How many pages are included?
The report includes five pages: Overview, Production, Quality, Costing, and Operations.
Do I need Power BI Desktop?
Yes. Power BI Desktop is used to open, edit, refresh, and customize the .pbix file. Publishing to Power BI Service may require Microsoft licensing.
Can I customize the dashboard?
Yes. The .pbix file is editable, so you can adjust visuals, measures, filters, colors, page names, and data fields.
Does this replace manufacturing software?
No. It is an analytics dashboard for reporting and review, not a live production execution, inventory, scheduling, or shop-floor automation system.
Can I publish this report online?
Yes. You can publish it to Power BI Service if you have the required Microsoft account and licensing.
About the Author
Built by PK – Microsoft Certified Professional with 15+ years of Excel, Google Sheets, and Power BI experience. Founder of NextGenTemplates, reaching 300K+ subscribers across YouTube channels. Every template is hand-built and tested before release.
Explore Related Templates
- Fertilizer Manufacturing Dashboard in Excel
- Fertilizer Manufacturing KPI Dashboard in Power BI
- Seed & Fertilizer Manufacturing KPI Dashboard in Power BI
- Browse Power BI Dashboard Templates
- Browse Power BI Templates
Download the Fertilizer Manufacturing Dashboard in Power BI and turn production, quality, costing, and operations data into clear Power BI reporting.
Last updated: June 11, 2026.


Reviews
There are no reviews yet.