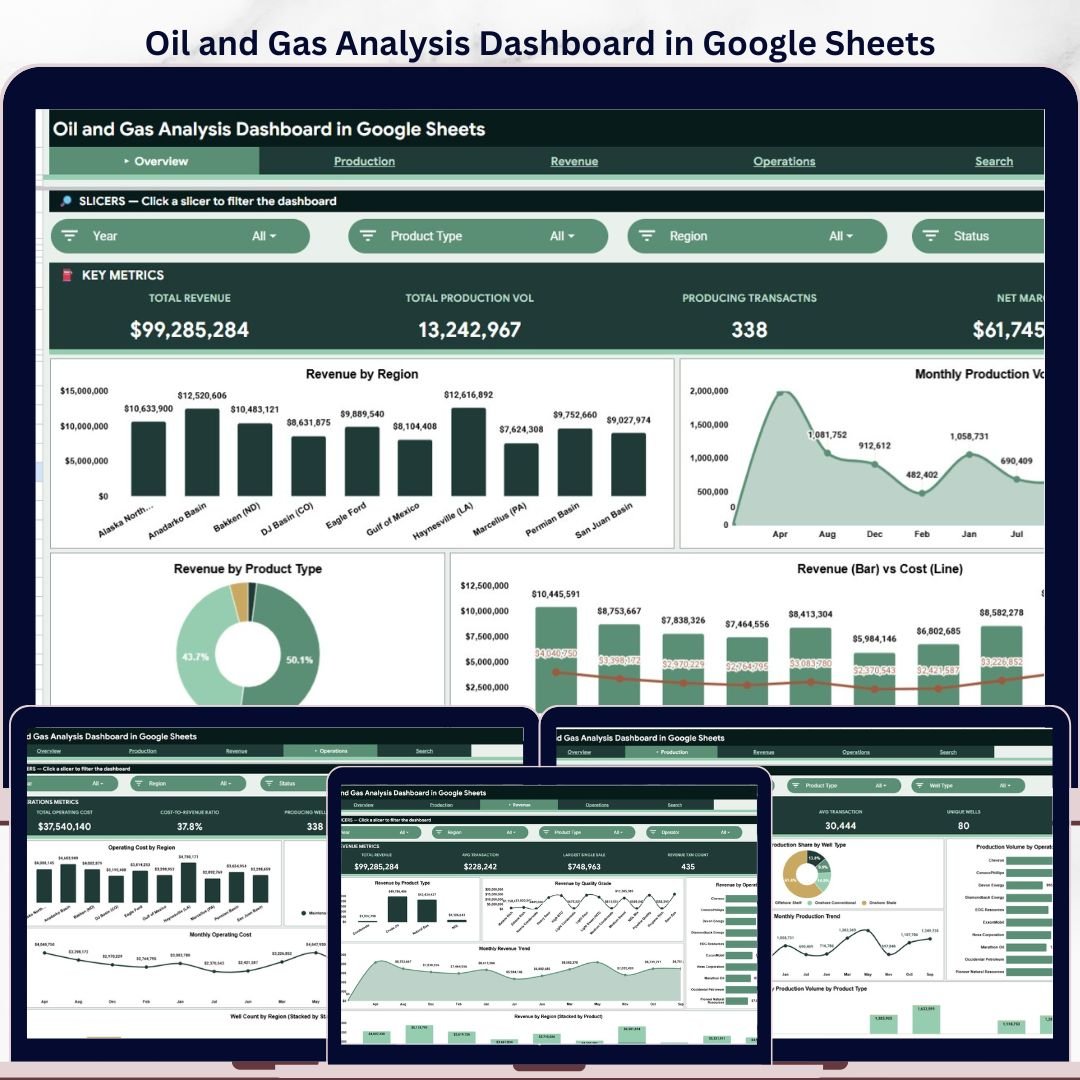
The Oil and Gas Analysis Dashboard in Google Sheets turns revenue, production volume, operating cost, well status, product type, and transaction-level data into a 6-tab analytics system with 4 executive KPI cards, 20+ analysis views, slicer-based filtering, and a searchable transaction lookup page. Built for oil and gas operators, analysts, finance teams, and energy consultants, it gives teams a collaborative Google Sheets alternative to costly BI tools. Join 8,400+ teams in 40+ countries using NextGenTemplates to replace subscription reporting tools with one-time-purchase templates. One-time payment, editable Google Sheets copy, no per-user fee, and no vendor lock-in.Oil and Gas Analysis Dashboard in Google Sheets
Key Features of Oil and Gas Analysis Dashboard in Google Sheets
- 6 dashboard tabs covering Overview, Production Analysis, Revenue Analysis, Operations Analysis, Search Analysis, and the Data sheet.Oil and Gas Analysis Dashboard in Google Sheets
- 4 executive KPI cards for Total Revenue, Total Production Volume, Producing Transactions, and Net Margin.
- Multiple slicers to filter charts by region, month, product type, operator, well type, status, and quality grade.Oil and Gas Analysis Dashboard in Google Sheets
- Production analytics for volume by region, operator, well type, month, and product type.
- Revenue analytics for product type, quality grade, operator, month, and regional product mix.
- Operations analytics for operating cost, well status distribution, and well count by region/status.
- Search analysis page to look up a transaction ID and return all related fields instantly.
- Editable sample data structure so you can replace the demo records with your own production exports.
What’s Inside the Oil and Gas Analysis Dashboard in Google Sheets
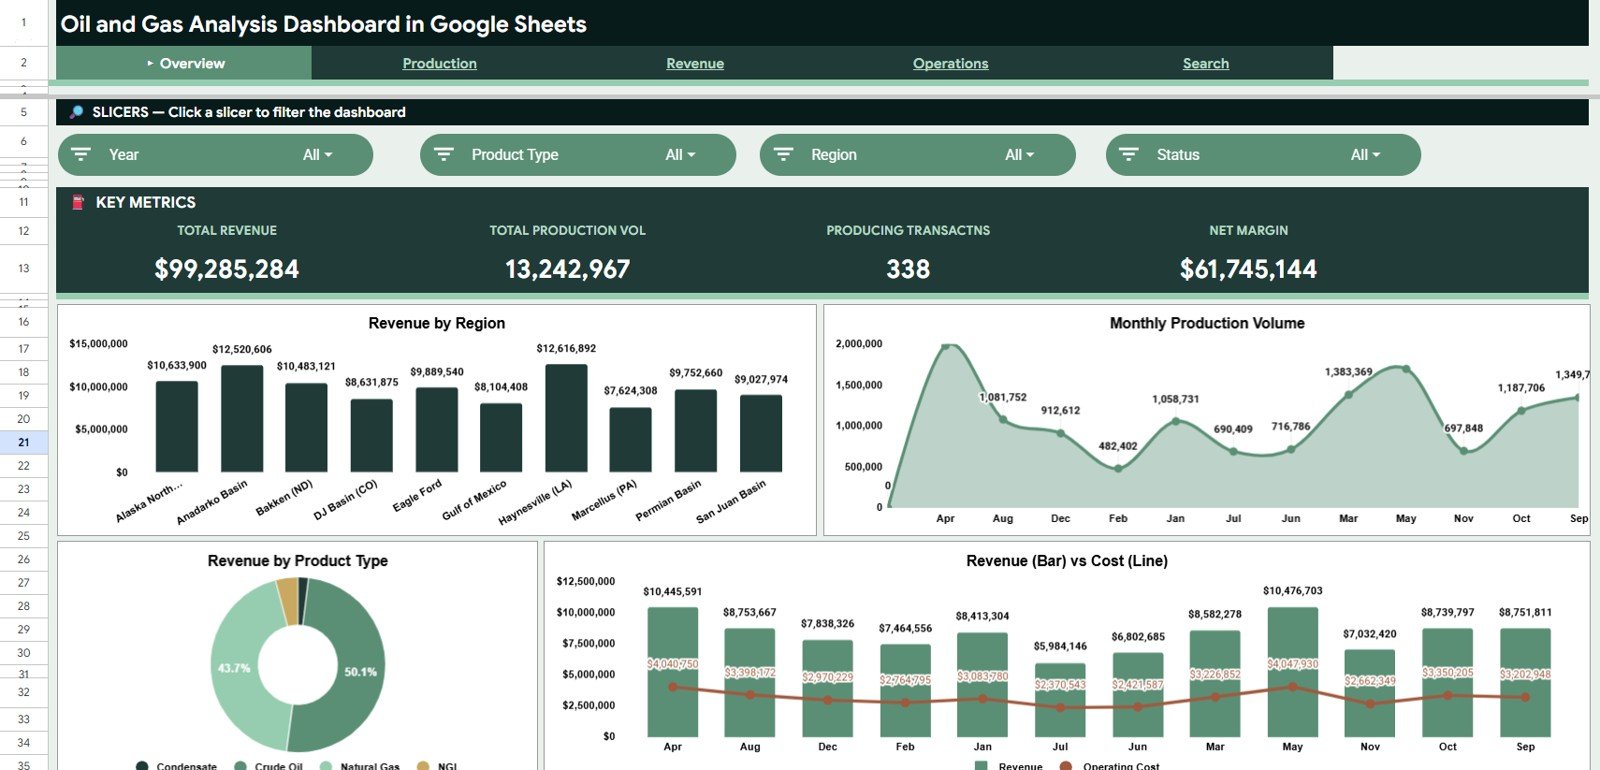
1. Overview Page
The Overview page is the executive summary. It opens with Total Revenue, Total Production Volume, Producing Transactions, and Net Margin cards so managers can see the business position before drilling into detailed charts.
Revenue by Region compares revenue contribution across operating regions. It helps identify which fields, basins, or territories are driving the highest commercial value.
Production Volume by Month shows how production changes across the year. Use it to spot seasonal swings, maintenance effects, and month-over-month production movement.
Revenue by Product Type breaks revenue into oil, gas, condensate, or other product categories used in your data. This view helps teams understand whether revenue is concentrated in one product line or balanced across multiple streams.
Revenue and Operating Cost by Month compares income and cost trends on one view. It makes margin pressure visible when operating cost grows faster than revenue.
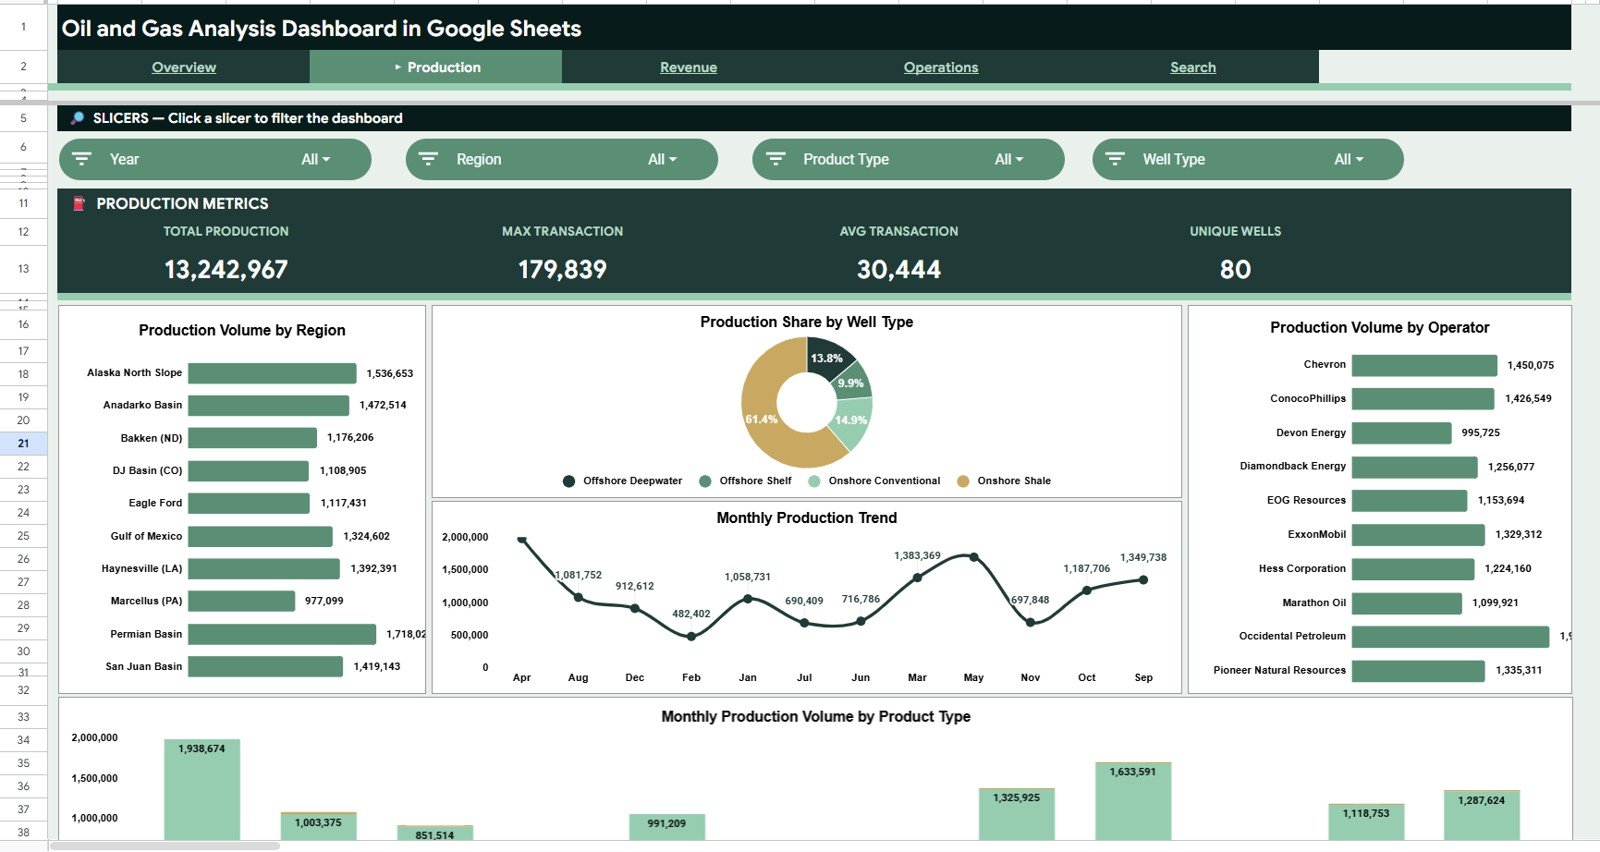
2. Production Analysis
Production Volume by Region ranks regions by total output. Operations leaders can quickly see which regions need more capacity planning or production review.
Production Share by Well Type shows the share of production coming from each well type. This is useful for comparing horizontal, vertical, offshore, or other well classifications in the data.
Production Volume by Operator compares operators based on produced volume. It helps teams review partner performance, contractor output, and operator-level accountability.
Production Volume by Month tracks monthly output over time. This chart is useful for identifying production dips, ramp-up periods, and operational recovery after downtime.
Production Volume by Product Type and Month combines product mix with time trend analysis. It shows which product categories are growing or declining month by month.
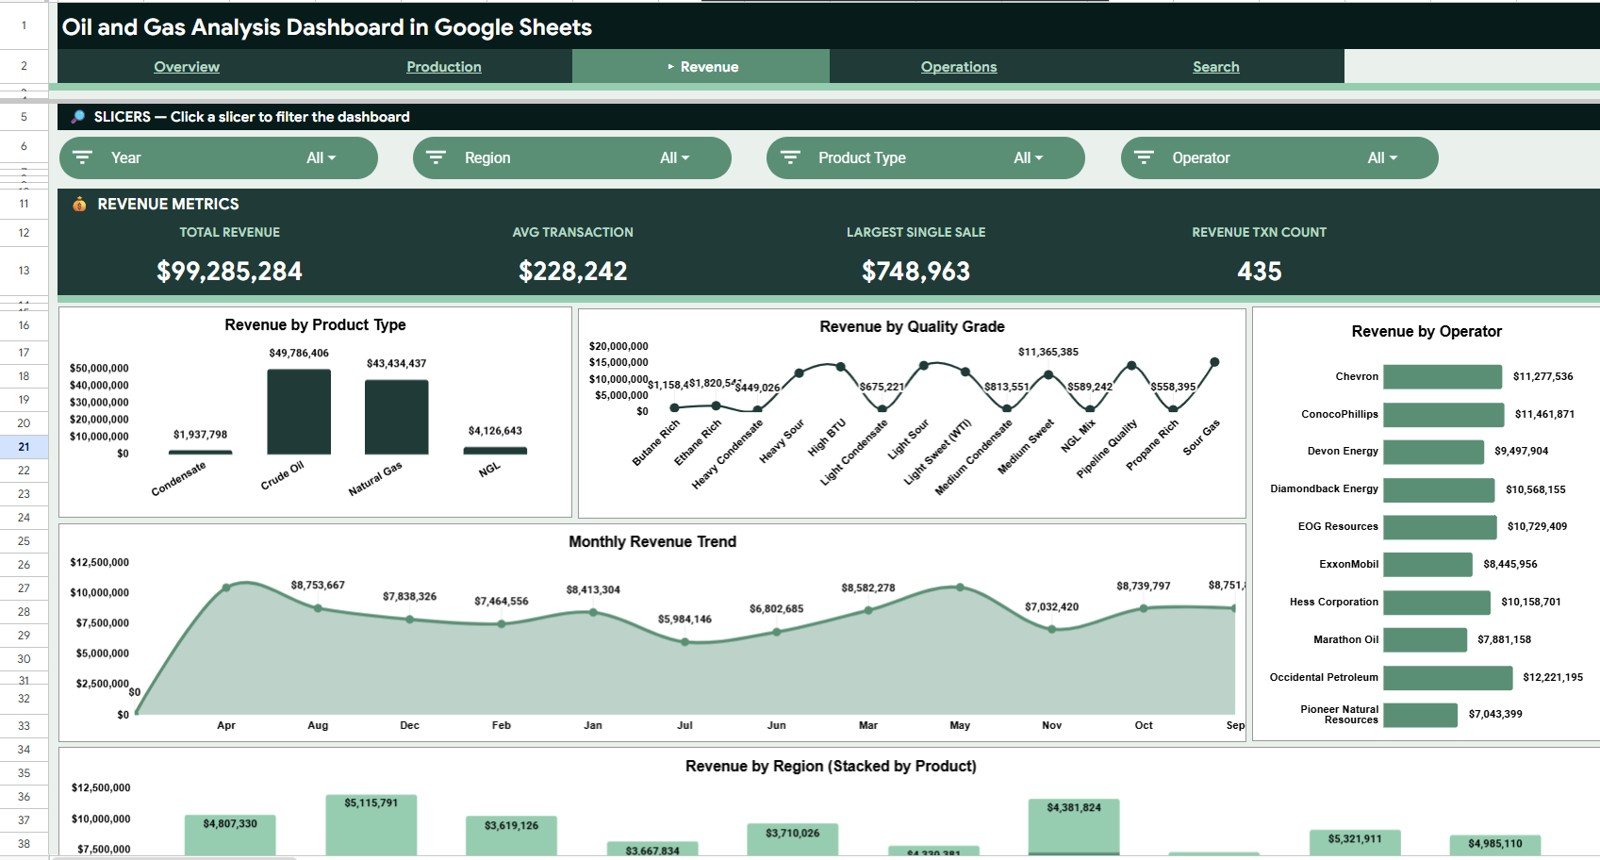
3. Revenue Analysis
Revenue by Product Type highlights the strongest revenue-generating product categories. It helps finance teams compare product performance without manually rebuilding pivot tables.
Revenue by Quality Grade shows how quality classification affects revenue. Use it to understand whether premium grades are consistently creating higher commercial value.
Revenue by Operator compares revenue contribution by operating partner or team. It is useful for monthly reviews, vendor scorecards, and partner-level profitability checks.
Revenue by Month visualizes top-line movement across the year. This helps finance and planning teams identify revenue seasonality and pricing-cycle impacts.
Revenue by Region and Product Type combines geography and product mix in one analysis. It shows whether a region is dependent on one product category or diversified across revenue streams.
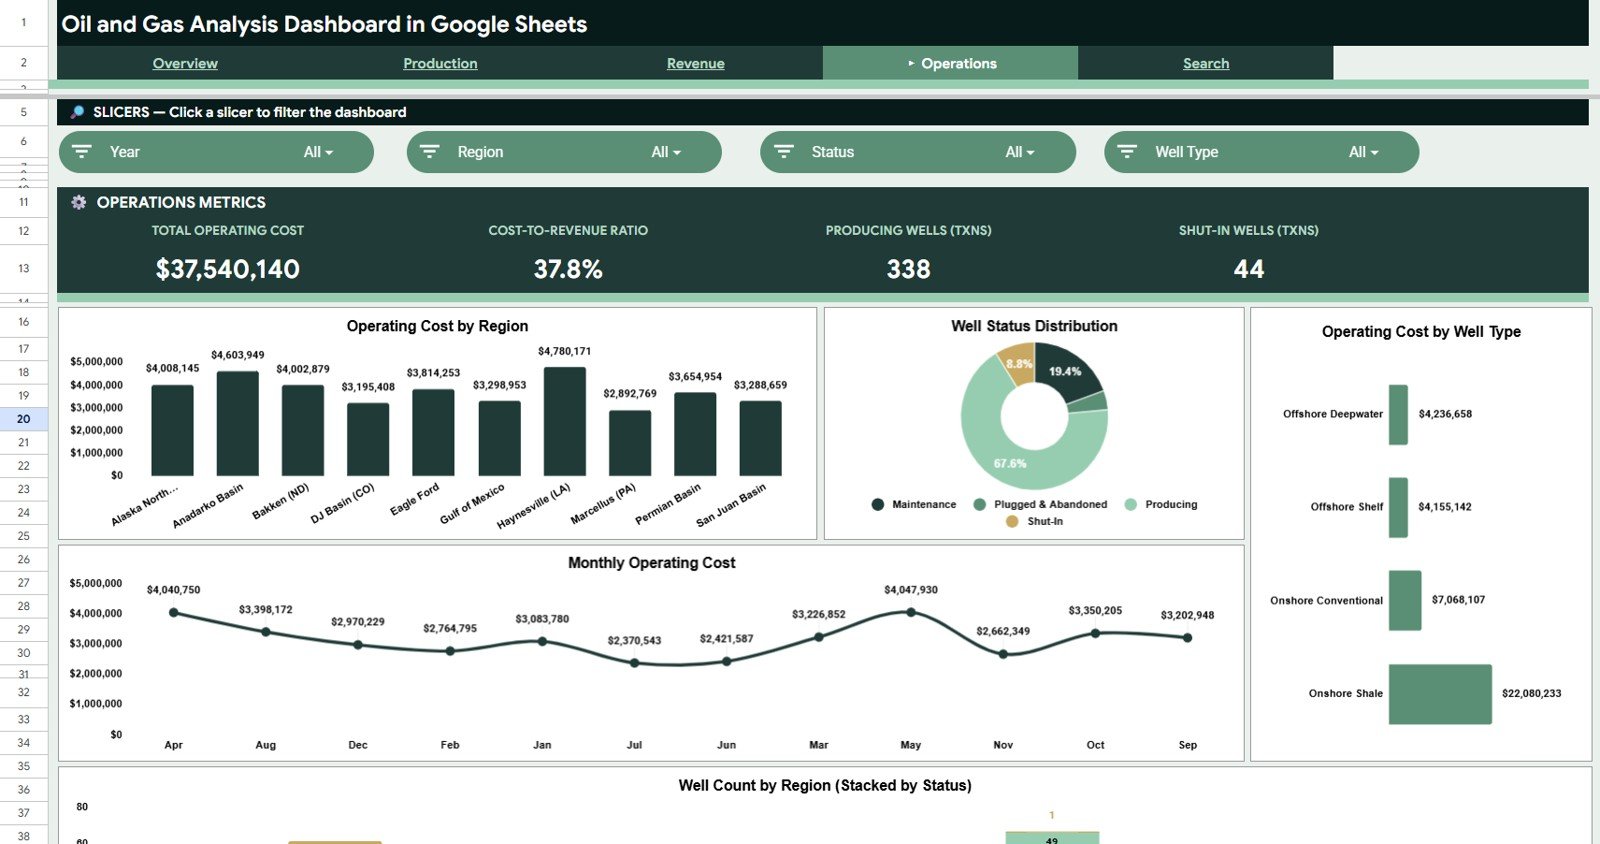
4. Operations Analysis
Operating Cost by Region compares cost burden across operating regions. This helps leaders identify high-cost regions before margins shrink further.
Well Status Distribution by Status shows how many wells are producing, shut-in, under maintenance, or inactive. It gives operations teams a fast read on asset availability.
Operating Cost by Well Type compares cost by well classification. It helps teams see whether specific well types are absorbing disproportionate operating expense.
Operating Cost by Month tracks cost movement over time. It is useful for detecting cost spikes related to maintenance cycles, labor, transportation, or service activity.
Well Count by Region and Status combines region and operational state. It helps managers see where non-producing wells are concentrated and where action is needed first.
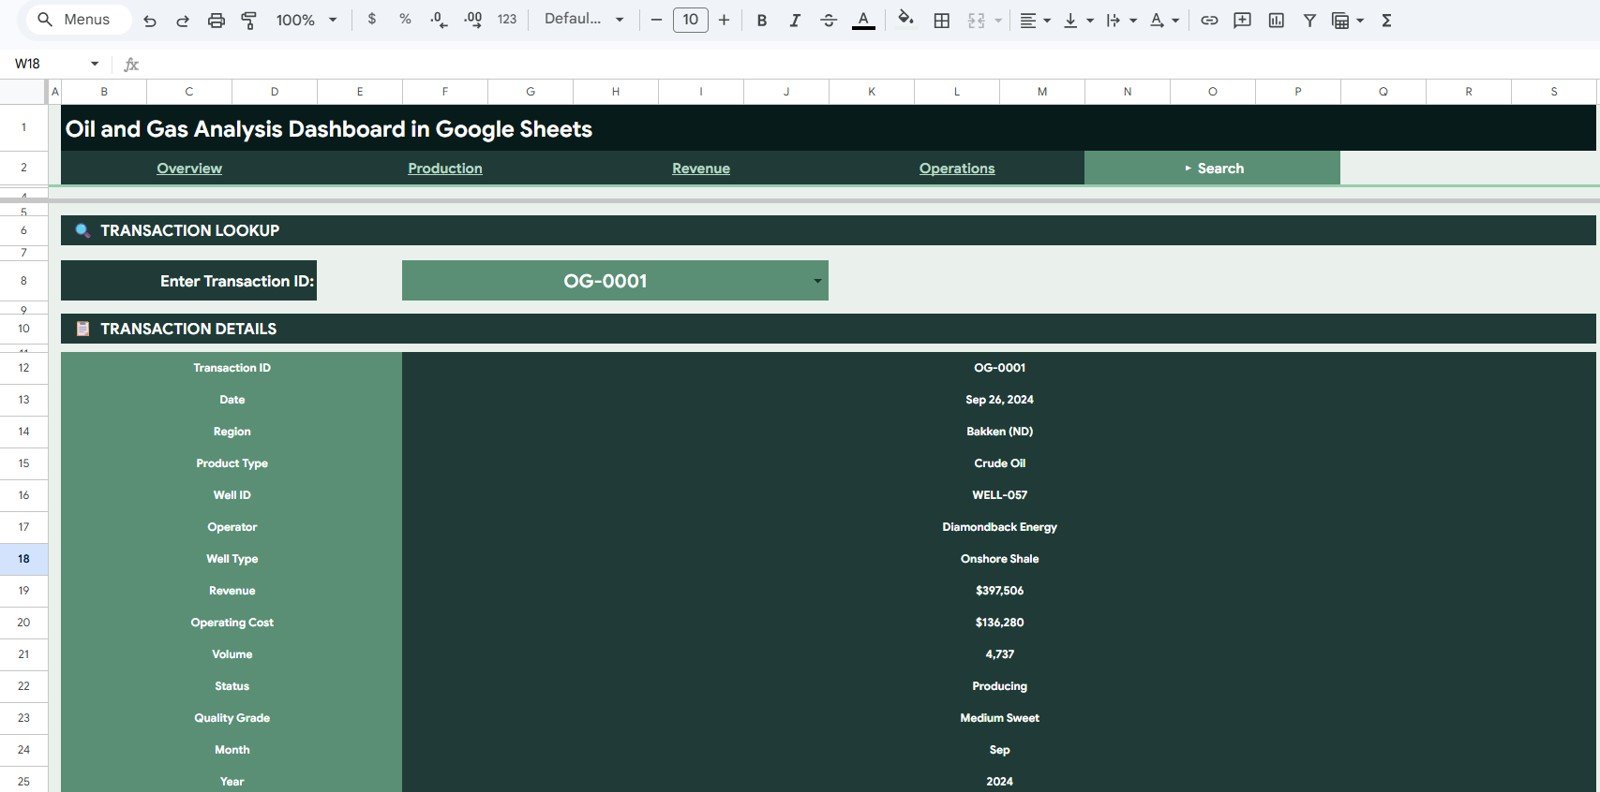
5. Search Analysis
The Search Analysis tab is designed for transaction-level lookup. Enter or select a Transaction ID and review Date, Region, Product Type, Well ID, Operator, Well Type, Revenue, Operating Cost, Volume, Status, Quality Grade, Month, and Year in one place.
This is helpful when a manager wants to investigate one unusually high-cost transaction, verify a well record, or answer a finance question without searching through the raw data sheet.
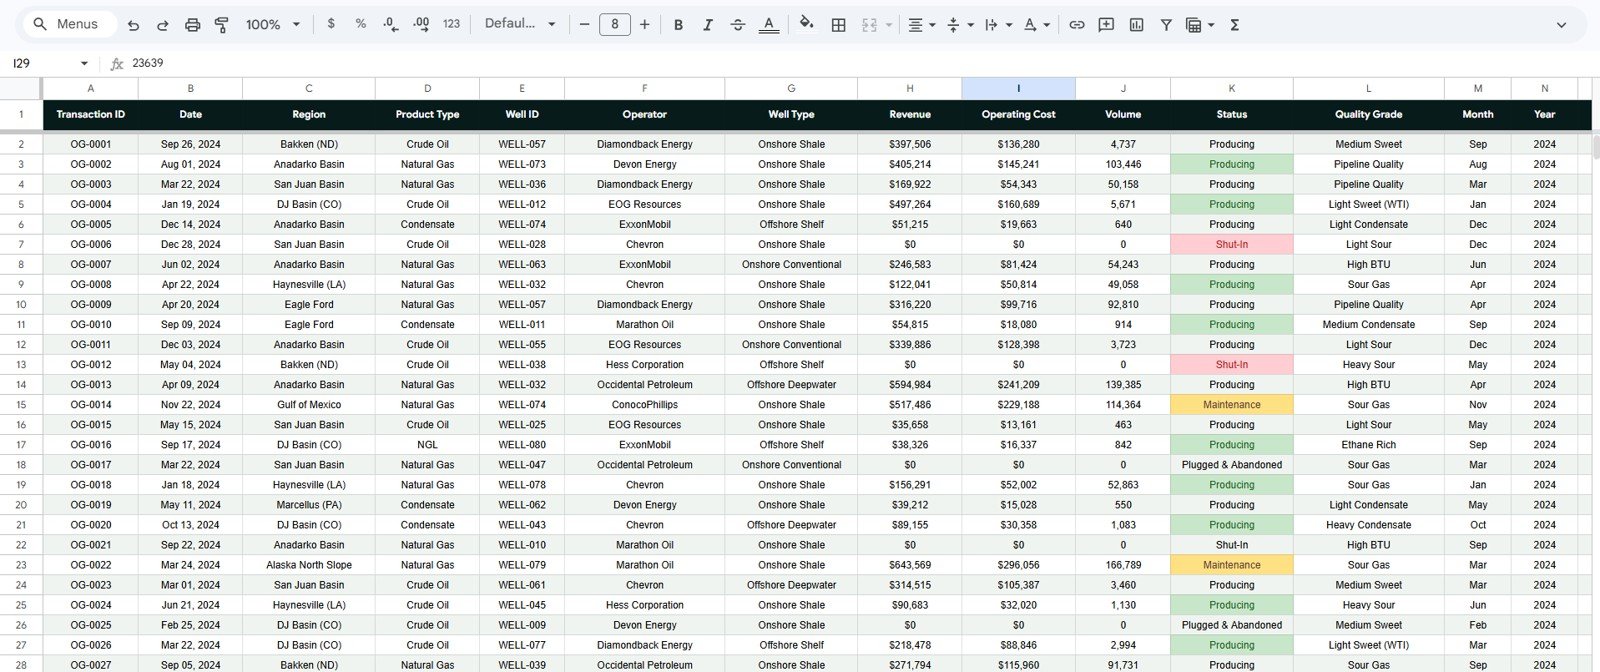
6. Data Sheet Tab
The Data sheet is the source table behind every chart, card, slicer, and lookup. Replace the sample records in the same column format, refresh the calculations, and the dashboard pages update from the new data.
Oil and Gas Analysis Dashboard in Google Sheets vs. Excel vs. Paid Energy BI SaaS – Where This Fits
| Feature | This Google Sheets Dashboard | Excel Dashboard | Paid Energy BI SaaS |
|---|---|---|---|
| Cost | $9.99 one-time | One-time template purchase | Often $100+ per user/month or custom quote |
| Platform | Google Sheets in the browser | Microsoft Excel desktop | Vendor-hosted web platform |
| Setup time | Under 10 minutes with matching data columns | Under 10 minutes | Days or weeks of onboarding |
| Team collaboration | Built into Google Sheets sharing | Limited without OneDrive/SharePoint | Usually included, subscription required |
| Customizable fields | Fully editable sheets, formulas, and charts | Fully editable workbook | Limited by vendor configuration |
| Year-1 cost at 5 users | $9.99 total | Template price only | $6,000+ possible depending on vendor |
Who This Template Is For – and Who It’s Not For
This template is built for:
- Oil and gas analysts who need a clean Google Sheets reporting model for production and revenue analysis.
- Operations managers reviewing regional production, well status, and operating cost trends.
- Finance controllers comparing revenue, cost, and net margin by month, region, and product type.
- Energy consultants preparing a lightweight dashboard deliverable for small and mid-sized clients.
- Teams that prefer browser-based collaboration instead of sending static spreadsheet files.
This template is not for:
- Teams needing real-time SCADA, PI Historian, ERP, or sensor-stream integration.
- Reservoir engineering teams needing decline-curve forecasting or geological simulation.
- Enterprise users requiring role-based security, audit logs, and managed data pipelines out of the box.
How to Use the Oil and Gas Analysis Dashboard in Google Sheets
- Open the PDF guide in your download and click the Google Sheets copy link.
- Create your own editable copy in Google Drive.
- Review the Data sheet columns and keep the same structure for your operating data.
- Paste or import your revenue, production, cost, operator, well, and status records.
- Use slicers on the dashboard tabs to filter by region, month, product type, operator, well type, status, or quality grade.
- Use the Search Analysis tab to investigate individual transaction IDs.
Real-World Use Cases
Amir, an operations analyst at an upstream operator, uses the Production Analysis page every Monday to compare production volume by region and operator. Instead of rebuilding pivot tables, he changes slicers and exports the view for the weekly operations meeting.
Leah, a finance controller for an energy services company, uses the Revenue Analysis and Operations Analysis pages to compare revenue and operating cost movement by month. When net margin changes, she can see whether the shift came from product mix, regional cost, or volume change.
Marco, an independent energy consultant, uses the Search Analysis tab during client reviews. When a client questions a specific transaction, he enters the Transaction ID and immediately shows the related well, operator, cost, volume, and quality grade.
Frequently Asked Questions
What KPIs are included in this Google Sheets dashboard?
The dashboard includes Total Revenue, Total Production Volume, Producing Transactions, and Net Margin on the Overview page, plus supporting charts for production, revenue, operating cost, well status, and transaction-level lookup.
Can I replace the sample data with my own oil and gas records?
Yes. The Data sheet is designed as the source table. Keep the same column structure, paste your own records, and the dashboard calculations and charts update from your data.
Does this require paid Google Workspace?
No. The template works in Google Sheets. A standard Google account is enough for personal use, while Google Workspace may be useful for company sharing and permissions.
Can multiple people work on the dashboard?
Yes. Because it is built in Google Sheets, you can share the file with teammates, assign view or edit access, and collaborate in the browser.
Is this a live oilfield monitoring system?
No. This is a reporting and analysis dashboard based on structured spreadsheet data. It does not connect directly to SCADA, sensors, or live production systems unless you add your own integration.
Can I customize the charts and fields?
Yes. The workbook is editable, so you can rename fields, adjust charts, change colors, add tabs, or expand the source data model for your internal reporting style.
About the Author
Built by PK – Microsoft Certified Professional with 15+ years of Excel, Google Sheets, and Power BI experience. Founder of NextGenTemplates, reaching 300K+ subscribers across YouTube channels. Every template is hand-built and tested before release.
Explore Related Templates
- Oil and Gas Analysis Dashboard in Power BI – use this version when you need Power BI Desktop, DAX measures, and advanced publishing options.Oil and Gas Analysis Dashboard in Google Sheets
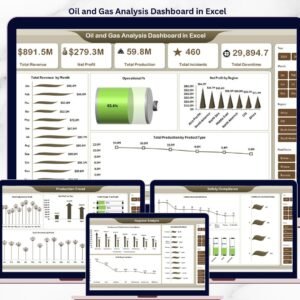
- Oil and Gas Analysis Dashboard in Excel – use this version when your team prefers Microsoft Excel and pivot-table workflows.
- Industrial Safety KPI Dashboard in Google Sheets – pair operational production reporting with safety performance tracking.
- Textiles & Apparel Manufacturing Dashboard in Excel – another operations dashboard for production and cost analysis.
Browse more Google Sheets Dashboard Templates and Google Sheets Templates on NextGenTemplates.
Ready to analyze production, revenue, and operations in Google Sheets? Add the Oil and Gas Analysis Dashboard in Google Sheets to your toolkit and turn raw operational data into decision-ready reports.Oil and Gas Analysis Dashboard in Google Sheets
Watch the step-by-step video tutorial:
Last updated: May 2026


Reviews
There are no reviews yet.