Industrial Gas Production Dashboard in Power BI gives production, plant, quality, cost, and operations teams a 5-page Power BI reporting file with 4 executive KPI cards, 20 focused visuals, and slicer-based filtering. Industrial gas teams often monitor revenue, target volume, purity, energy cost, gross profit, shifts, regions, operators, plants, and production units in separate reports. This dashboard brings those measures into one interactive Power BI template for a one-time $17.99 purchase. Built by PK, a Microsoft Certified Professional with 15+ years of Excel, Google Sheets, and Power BI experience and 300K+ subscribers across YouTube channels.
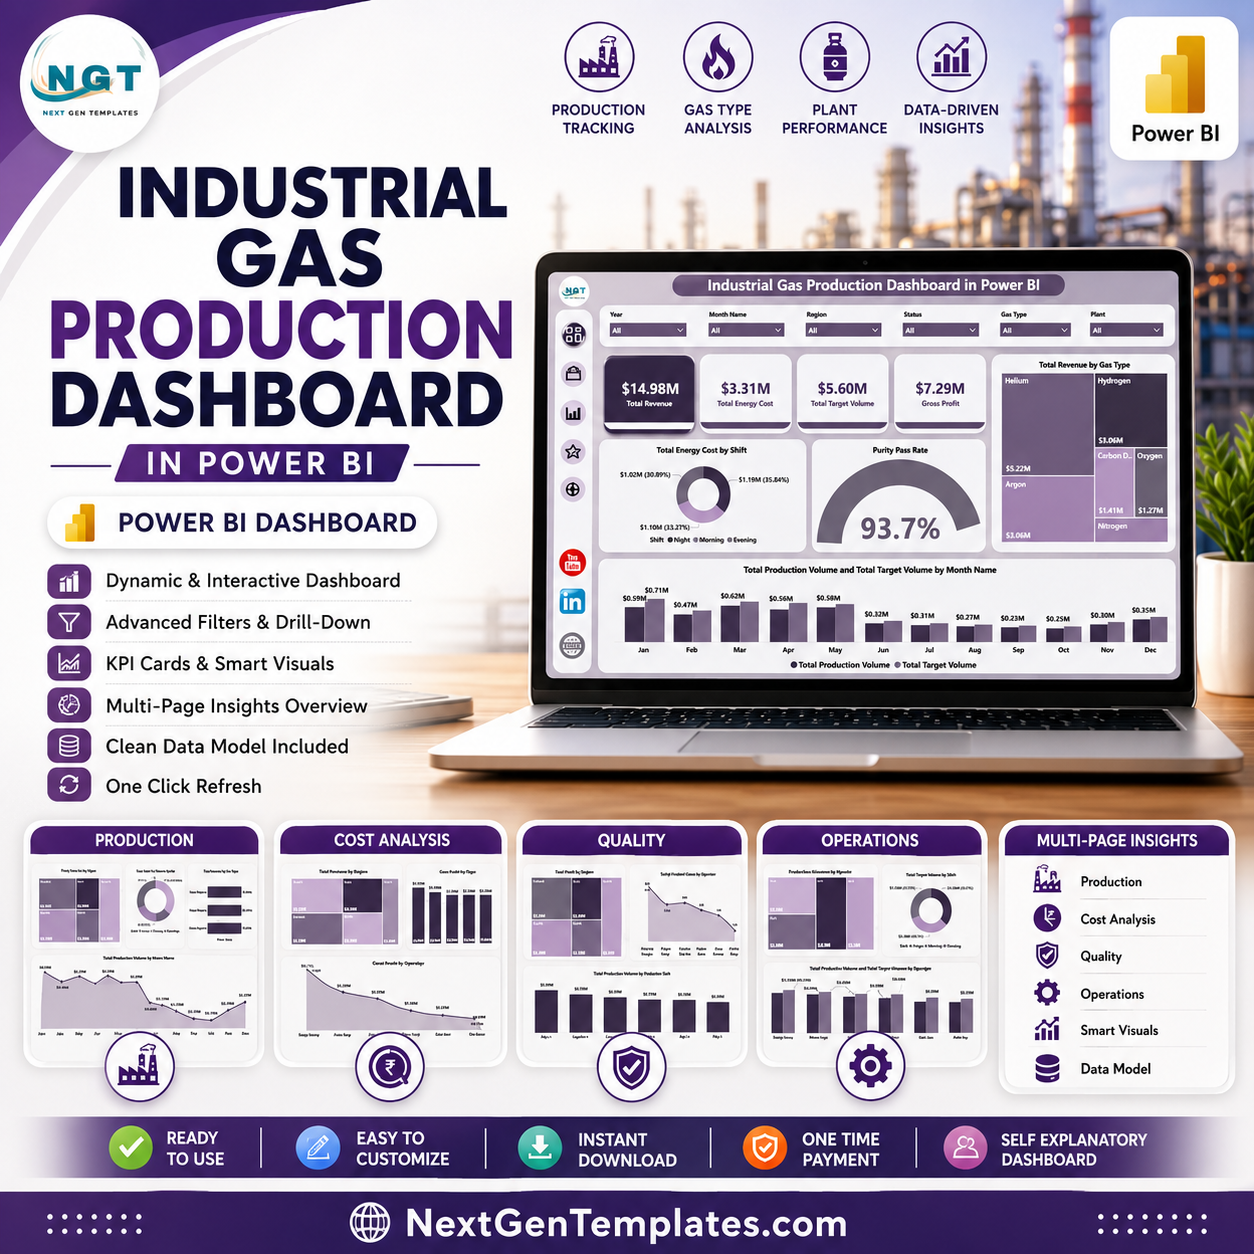
Key Features of Industrial Gas Production Dashboard in Power BI
- 5 report pages: Overview, Production, Cost Analysis, Quality, and Operations.
- 4 KPI cards: Total Revenue, Total Energy Cost, Total Target Volume, and Gross Profit.
- 20 analysis visuals: Track revenue, energy cost, target volume, production volume, gross profit, purity pass rate, safety incidents, production attainment, shifts, plants, regions, gas types, operators, and production units.
- Interactive slicers: Filter the report quickly by available production, time, plant, gas, shift, operator, and region fields.
- Power BI format: Open in Power BI Desktop, connect or replace the sample data, and adapt the report to your process.
- Management-ready layout: Separate pages support executive overview, production review, cost control, quality follow-up, and operating performance.
What’s Inside the Industrial Gas Production Dashboard in Power BI
1. Overview Page
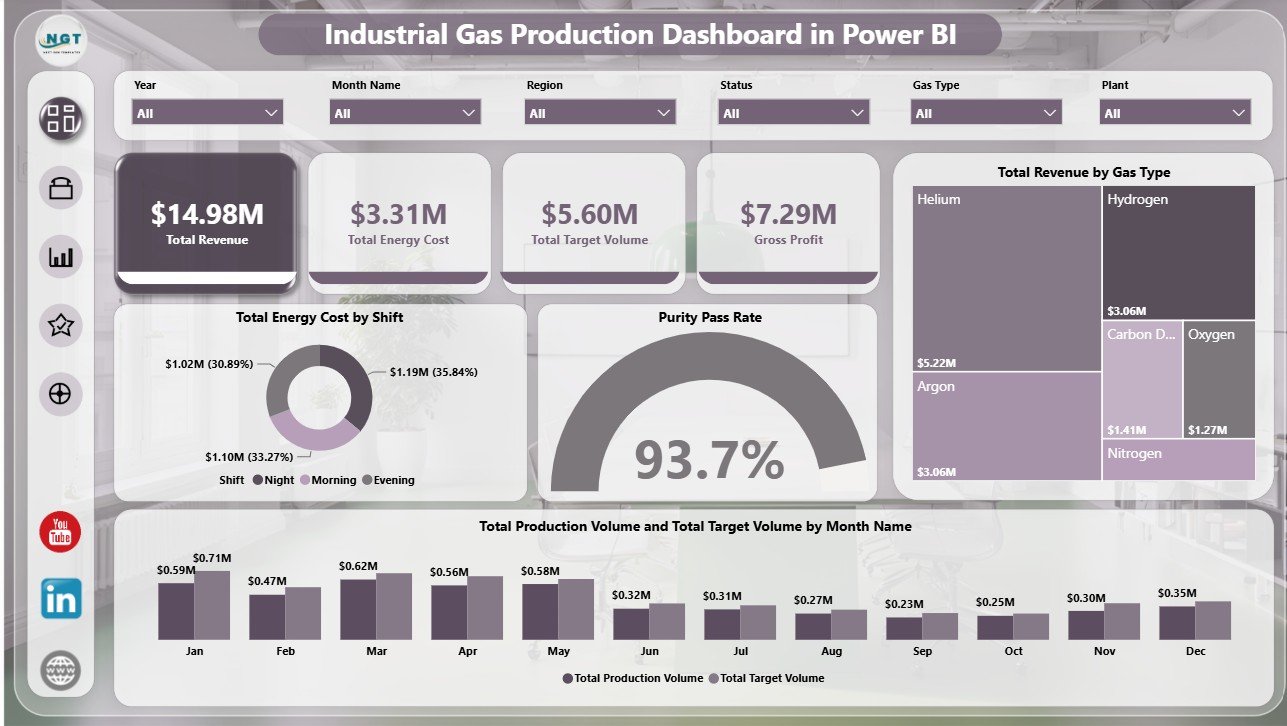
The Overview page gives a high-level management view of industrial gas production performance. The KPI cards show Total Revenue, Total Energy Cost, Total Target Volume, and Gross Profit so leaders can review financial, production, and cost status in one place.
Total Energy Cost by Shift compares energy cost across production shifts and helps identify where operating cost is concentrated. It is useful for shift review, staffing discussion, and cost-saving investigation.
Purity Pass Rate by Overall Production connects quality performance with production output. Teams can quickly see whether production volume is being achieved with acceptable purity results.
Total Revenue by Gas Type shows which gas categories contribute the most revenue. This helps commercial and plant teams understand product mix and revenue concentration.
Total Production Volume and Total Target Volume by Month Name compares actual production volume against target volume by month. It helps managers see monthly attainment patterns and production gaps.
2. Production
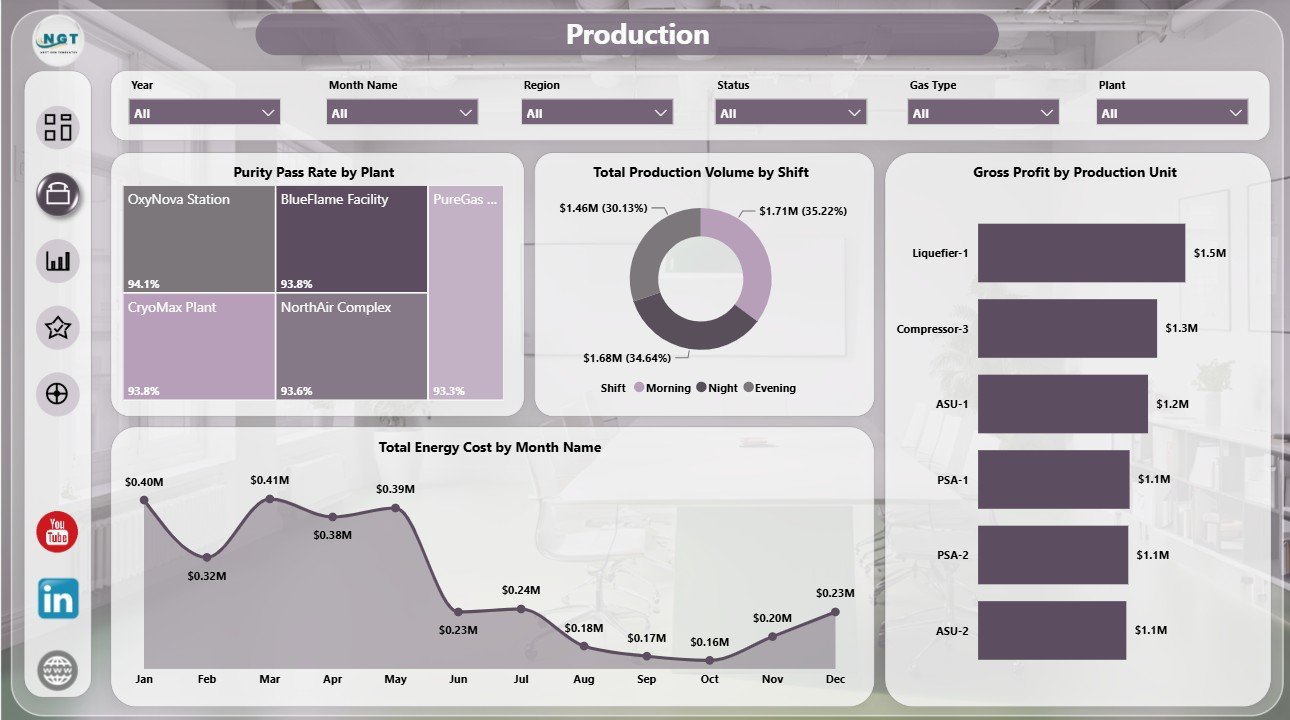
The Production page focuses on plant, shift, production unit, and month-level operating performance. Purity Pass Rate by Plant compares quality pass results across plants, while Total Production Volume by Shift shows how output is distributed between shifts.
Gross Profit by Production Unit highlights which units create the strongest margin. Total Energy Cost by Month Name tracks energy cost movement over time and supports monthly cost control.
3. Cost Analysis
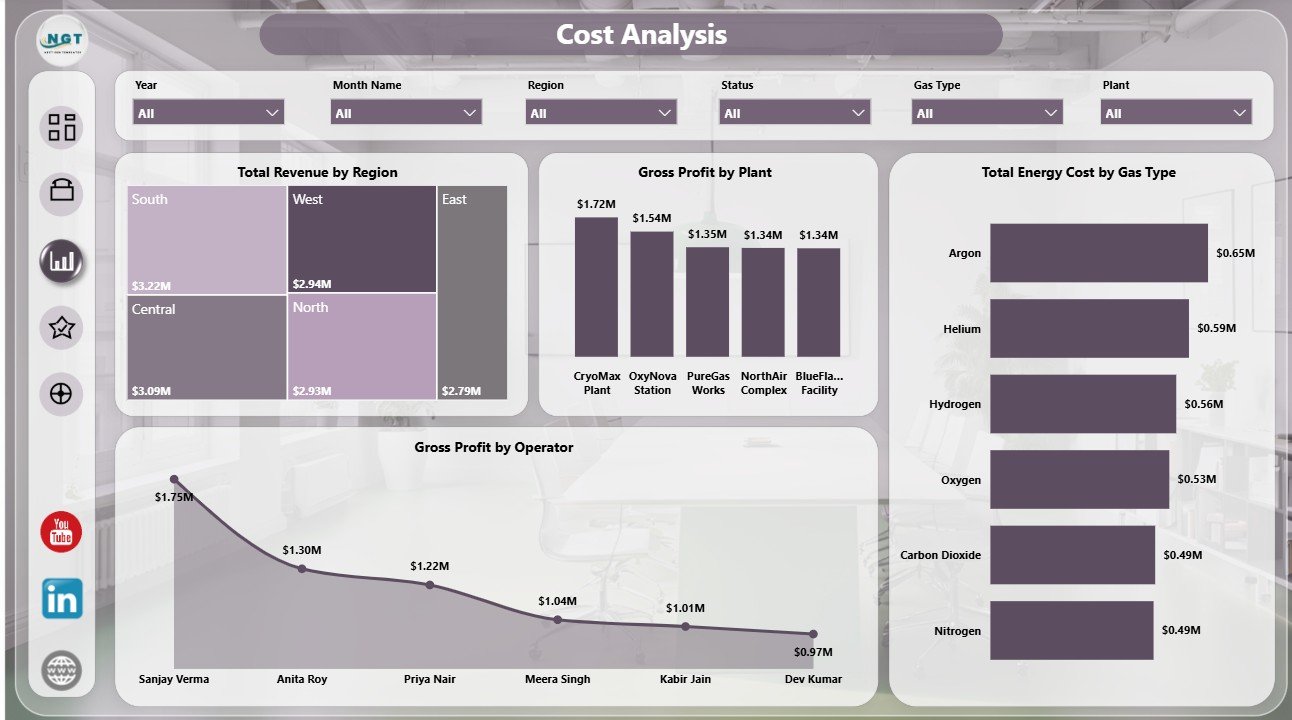
The Cost Analysis page helps finance and operations teams review revenue, profit, and energy cost drivers. Total Revenue by Region compares regional contribution, while Gross Profit by Plant shows plant-level margin performance.
Total Energy Cost by Gas Type identifies which gas categories carry higher energy cost. Gross Profit by Operator adds operator-level visibility for margin review and accountability discussions.
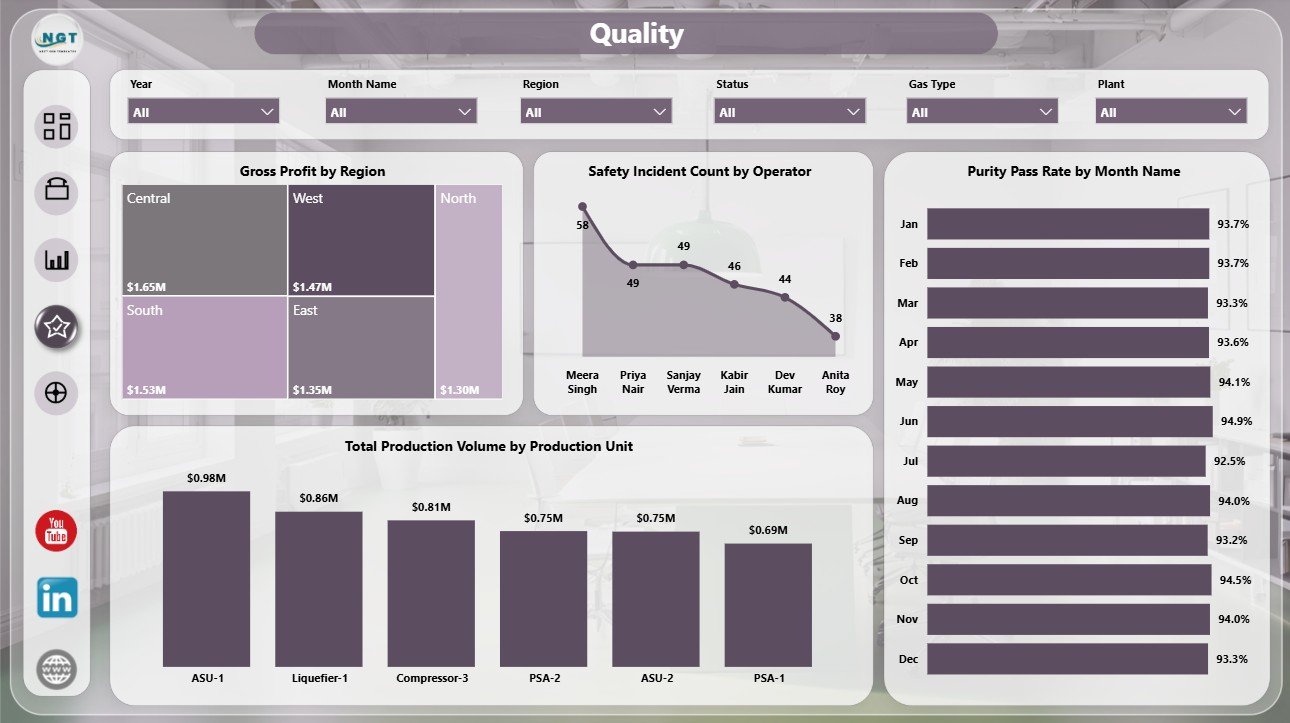
4. Quality
The Quality page connects gross profit, safety, purity, and production volume. Gross Profit by Region shows where margin is strongest, while Safety Incident Count by Operator helps safety teams spot operator-level incident concentration.
Purity Pass Rate by Month Name tracks quality trend movement over time. Total Production Volume by Production Unit compares output across production units for quality and capacity review.
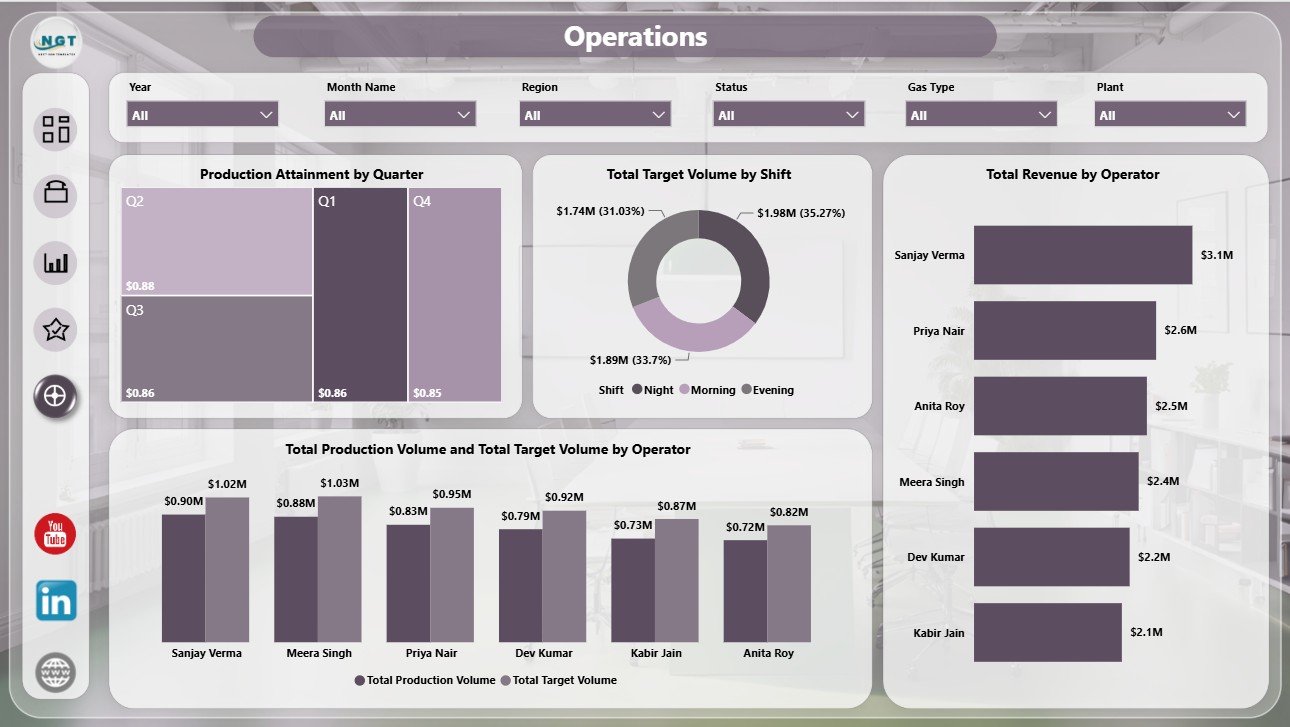
5. Operations
The Operations page supports execution review for targets, shifts, operators, and production attainment. Production Attainment by Quarter tracks quarterly achievement against plan, while Total Target Volume by Shift shows planned output distribution.
Total Revenue by Operator adds operator-level commercial visibility. Total Production Volume and Total Target Volume by Operator compares actual output with target volume for each operator.
Industrial Gas Production Dashboard in Power BI vs. Tableau vs. Paid Operations SaaS – Where This Fits
| Feature | This Power BI Dashboard | Tableau Alternative | Paid Operations SaaS |
|---|---|---|---|
| Cost | $17.99 one-time template | Requires Tableau license | Monthly or annual subscription |
| Platform | Power BI Desktop and Power BI Service | Tableau Desktop or Cloud | Vendor cloud platform |
| Setup time | Open PBIX and replace or connect data | Build workbook and model | Implementation project |
| Mobile access | Available through Power BI publishing | Available through Tableau Cloud | Usually included |
| Customizable fields | Editable Power BI model and visuals | Editable if licensed and trained | Depends on plan and permissions |
| Share with link | Possible through Power BI Service | Possible through Tableau Cloud | Role-controlled sharing |
| Year-1 cost at 5 users | $17.99 plus existing Power BI licensing | Often much higher | Often hundreds or thousands |
| Industrial gas metrics | Revenue, energy, targets, production, purity, safety, shift, plant, region, operator, and gas type views | Must be built or customized | Depends on vendor module |
Who This Template Is For – and Who It’s Not For
This template is for industrial gas producers, air separation plants, specialty gas teams, production supervisors, plant managers, quality leaders, safety teams, operations analysts, and finance users who need a focused Power BI reporting layer.
It is not a replacement for SCADA, MES, ERP transaction control, tank telemetry, dispatch scheduling, regulatory compliance workflows, or live plant automation. Use it when you have prepared production data and want faster management reporting in Power BI.
How to Use the Industrial Gas Production Dashboard in Power BI
- Download and unzip the product file.
- Open the PBIX file in Power BI Desktop.
- Review the sample data structure and replace it with your own industrial gas production data.
- Refresh the report and validate the KPI cards and visuals.
- Use slicers to filter by time period, shift, plant, gas type, region, operator, and production unit.
- Customize titles, colors, fields, and visuals as needed.
- Publish to Power BI Service if your team needs online access.
Real-World Use Cases
Amit, Plant Manager: reviews production volume vs. target volume by month, shift, and operator before weekly operations meetings.
Priya, Quality Lead: monitors purity pass rate by plant and month while checking safety incidents by operator.
Daniel, Finance Analyst: compares gross profit by plant, region, operator, and production unit to prepare margin commentary.
Frequently Asked Questions
What KPIs are included?
The Overview page includes Total Revenue, Total Energy Cost, Total Target Volume, and Gross Profit.
Do I need Power BI Desktop?
Yes. Open the PBIX file in Power BI Desktop, which is available from Microsoft.
Can I use my own data?
Yes. Replace or connect the sample data with your own production records and refresh the report.
Can I customize the visuals?
Yes. The report is editable in Power BI Desktop, so you can adjust visuals, fields, colors, and pages.
Is this a live SCADA dashboard?
No. It is a Power BI reporting template. You can connect it to prepared data sources, but it is not a plant control system.
Is this a one-time purchase?
Yes. The dashboard is sold as a downloadable Power BI template with no subscription fee from NextGenTemplates.
About the Author
Built by PK – Microsoft Certified Professional with 15+ years of Excel, Google Sheets, and Power BI experience. Founder of NextGenTemplates, reaching 300K+ subscribers across YouTube channels. Every template is hand-built and tested before release.
Explore Related Templates
Pair this report with Industrial Gas Production Dashboard in Excel, Rubber Industry Dashboard in Power BI, and Footwear Manufacturing Dashboard in Excel. Browse more Power BI Dashboard templates.
Download the Industrial Gas Production Dashboard in Power BI to monitor revenue, energy cost, target volume, gross profit, purity, production, safety, and operators from one interactive report.
Last updated: June 24, 2026.


Reviews
There are no reviews yet.