
The Aquaculture KPI Scorecard in Excel tracks 10+ aquaculture KPIs across 4 structured worksheets, with automated MTD and YTD calculations, traffic-light indicators, and interactive trend charts. Setup takes under 10 minutes — replace the sample data with your own fish farm numbers and every metric updates automatically.
🌍 Join 8,400+ teams in 40+ countries using NextGenTemplates to replace paid SaaS tools with one-time-purchase Excel, Google Sheets, Power BI, and HTML templates.
✅ Instant download · One-time payment · No subscription · No per-user fees · Lifetime access
🔑 Key Features of Aquaculture KPI Scorecard in Excel
This scorecard is built for fish farms, shrimp hatcheries, and aquaculture operations that need a single Excel file to monitor feed conversion ratios, survival rates, water quality, harvest volumes, and cost per kilogram. It includes 4 worksheets — Scorecard, KPI Trend, Input Data, and KPI Definition — covering the full KPI management cycle from definition to visualization.
🐟 Interactive Month Selector — Choose any month from the dropdown and the entire scorecard refreshes with that month’s actual vs target data.
📊 MTD and YTD Toggle — Switch between Month-to-Date and Year-to-Date views to compare short-term performance against annual goals.
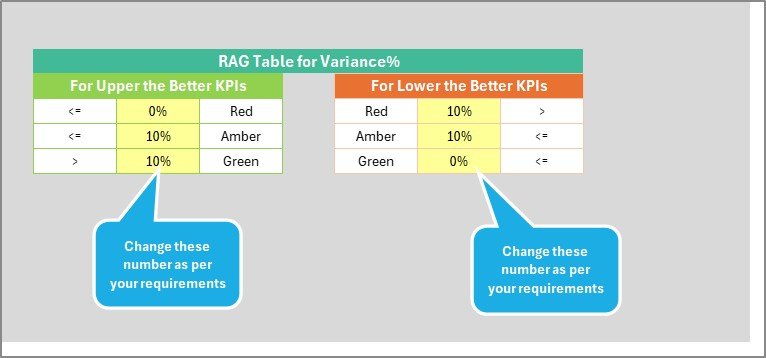
🚦 Traffic-Light Conditional Formatting — Green, amber, and red color coding highlights which KPIs are on target, at risk, or underperforming.
📈 KPI Trend Charts — Select any KPI from the dropdown on cell C3 to view 12-month trend lines for Actual, Target, and Previous Year values.
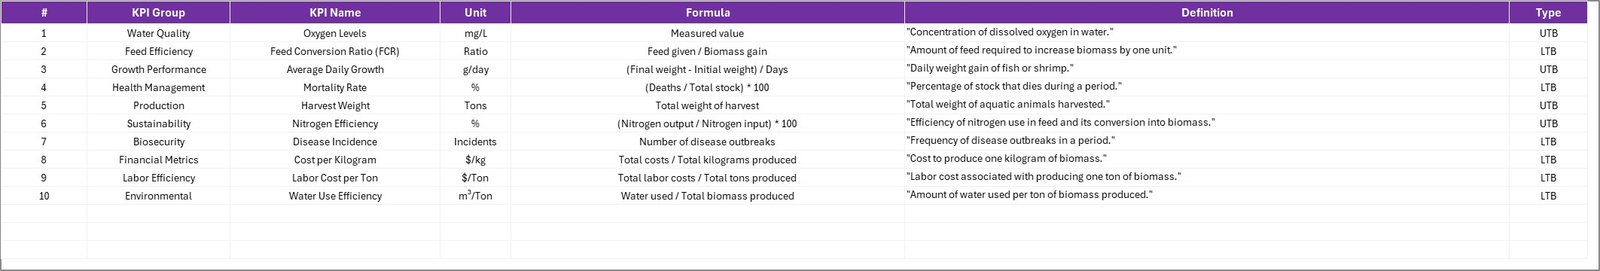
📘 KPI Definition Sheet — Documents each KPI’s name, group, unit, formula, type (Lower the Better or Upper the Better), and plain-language definition.
📝 Centralized Input Data Sheet — Enter monthly actual and target values in one place; every chart and scorecard formula pulls from this sheet automatically.
💡 Fully Customizable — Add new KPIs, change thresholds, or modify formulas to match your specific aquaculture operation.
💰 No Extra Software — Runs entirely in Microsoft Excel. No Power BI, no add-ins, no subscriptions.
📦 What’s Inside the Aquaculture KPI Scorecard in Excel
This ready-to-use template includes 4 worksheets, each designed for a specific role in aquaculture KPI monitoring:
1. Scorecard Sheet
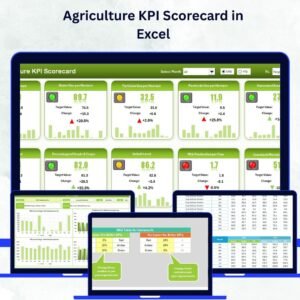
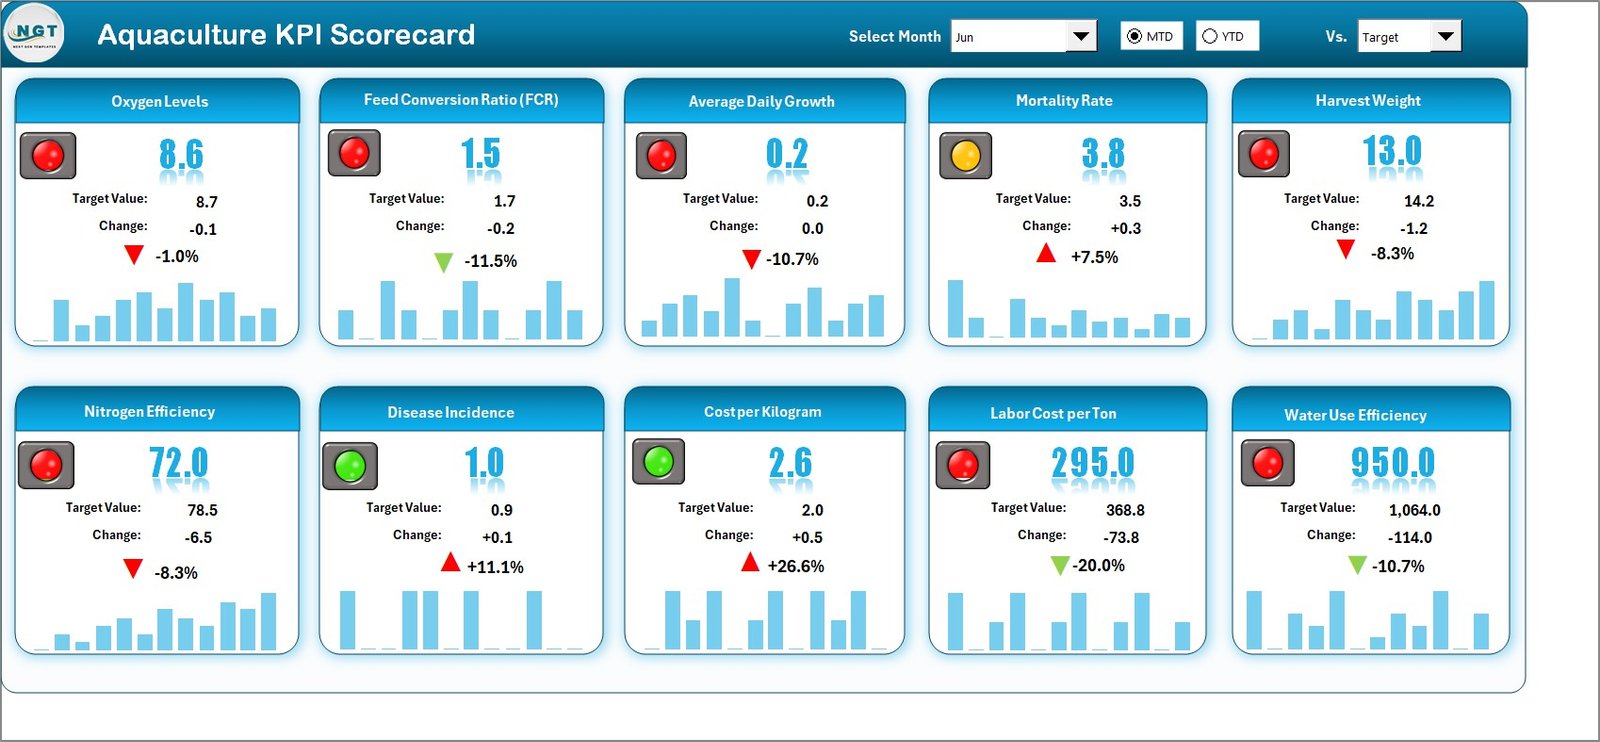 Aquaculture KPI Scorecard in Excel
The Scorecard sheet is the main interface where you view KPI performance. Key features include:
🐠 Dropdown Menus — Select the month, MTD (Month-to-Date), or YTD (Year-to-Date) for performance analysis.
🎯 Actual vs Target Values — Compare actual performance against targets for each aquaculture KPI.
🟢 Visual Indicators — Quickly see performance status using color-coded traffic lights and conditional formatting.
📋 KPI Overview — Display all relevant information about KPIs, including MTD and YTD comparisons, previous month, and previous year data.
2. KPI Trend Sheet
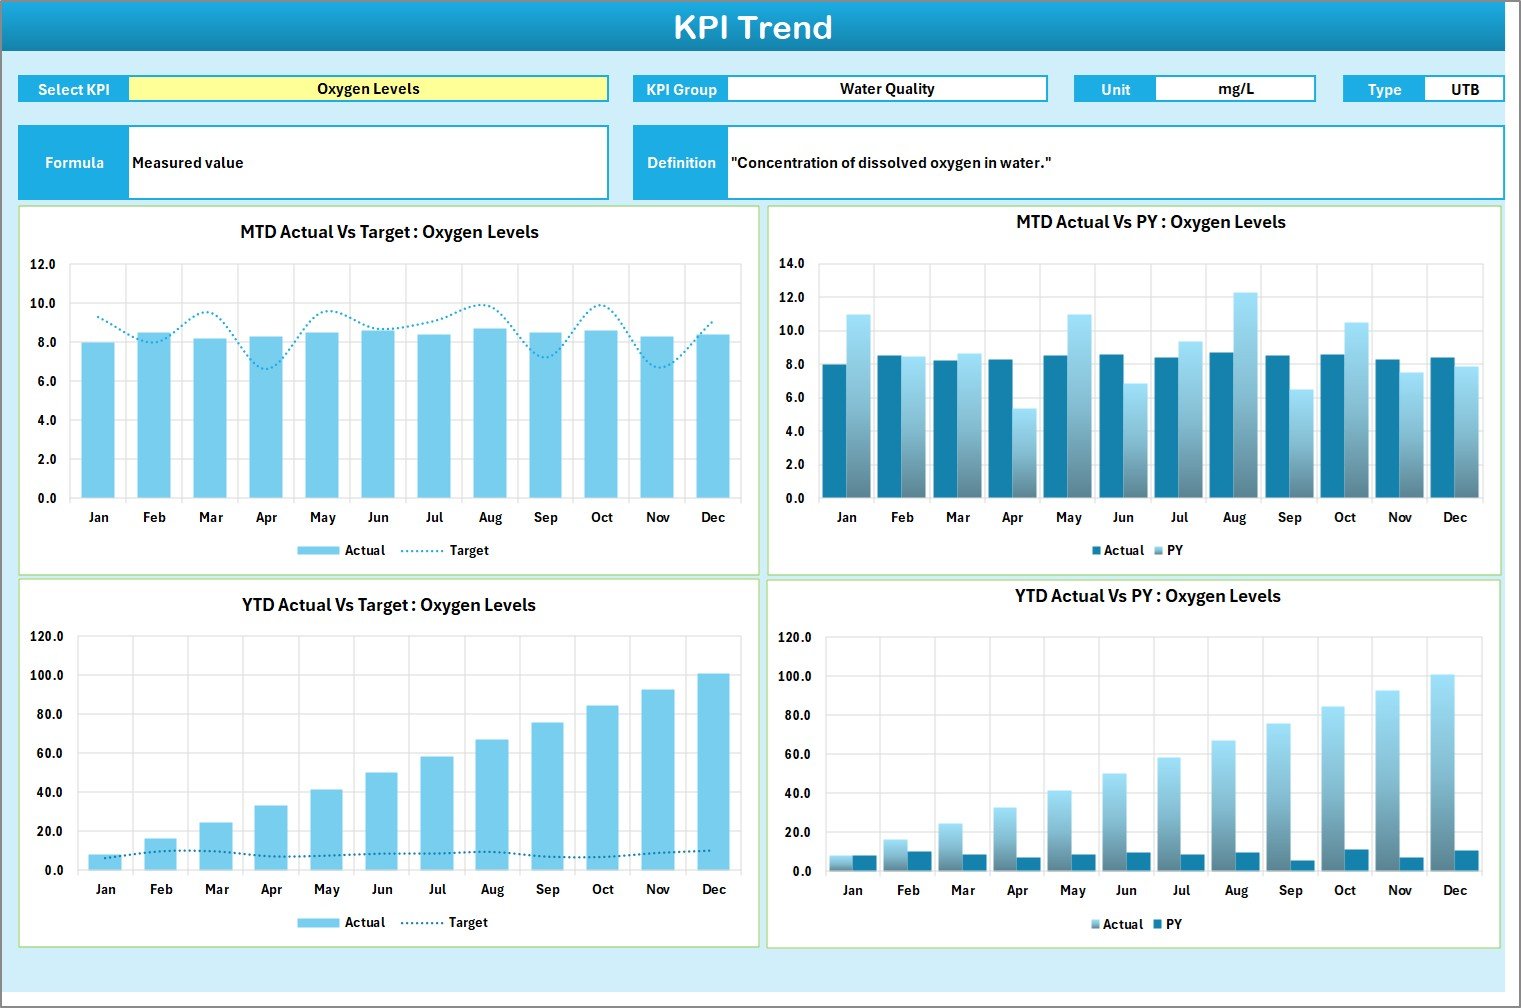 KPI Trend Sheet
Here you can select the KPI name from the dropdown available on range C3. The sheet displays the KPI Group, Unit of KPI, Type of KPI (Lower the Better or Upper the Better), Formula of the KPI, and Definition of the KPI. MTD and YTD trend charts for Actual, Target, and Previous Year numbers are shown below.
3. Input Data Sheet
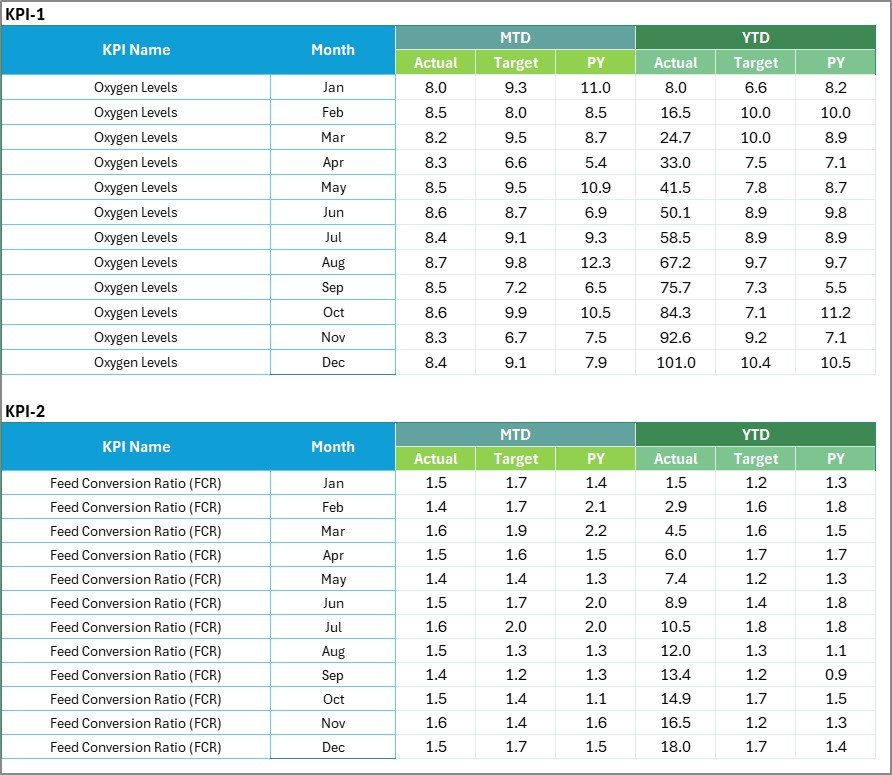 Input Data Sheet
The Input Data sheet is where you enter all KPI data. Record actual values, targets, and other metrics for each KPI. Easily update data as new results become available, ensuring the scorecard remains current.
4. KPI Definition Sheet
 KPI Definition Sheet
In this sheet, you enter the KPI Name, KPI Group, Unit, Formula, and KPI definition. This standardizes understanding across your aquaculture team.
📊 Aquaculture KPI Scorecard in Excel vs. Google Sheets Scorecard vs. Paid Aquaculture SaaS — Where This Fits
| Feature | Aquaculture KPI Scorecard in Excel | Google Sheets Scorecard | AquaManager / Paid SaaS |
|---|---|---|---|
| Cost | $12.99 one-time | $9.99 one-time | $50–200/month |
| Platform | Microsoft Excel (desktop) | Google Sheets (cloud) | Web-based SaaS |
| Setup Time | Under 10 minutes ✅ | Under 10 minutes | Days to weeks |
| Real-Time Collaboration | Via OneDrive/SharePoint | Built-in ✅ | Built-in |
| Offline Access | Full offline ✅ | Limited offline | Requires internet |
| Customizable KPIs | Fully editable ✅ | Fully editable | Limited to plan tier |
| Trend Charts | Built-in ✅ | Built-in | Built-in |
| Year-1 Cost (5 Users) | $12.99 total ✅ | $9.99 total | $3,000–$12,000 |
| Data Ownership | 100% yours ✅ | Stored on Google servers | Vendor-controlled |
For aquaculture teams that want KPI tracking without monthly SaaS fees, the Aquaculture KPI Scorecard in Excel sits in the sweet spot.
👥 Who This Template Is For — and Who It’s Not For
✅ This template is built for:
- Fish farm managers tracking feed conversion, survival rates, and harvest volumes in Excel
- Shrimp hatchery operators monitoring water quality, stocking density, and cost per kilogram
- Aquaculture consultants preparing monthly performance reports for clients
- Small-to-medium aquaculture businesses wanting data-driven decisions without SaaS subscriptions
❌ This template is NOT for:
- Large industrial aquaculture operations needing IoT sensor integration and real-time automated data feeds
- Teams requiring multi-user simultaneous editing without OneDrive (consider the Google Sheets version instead)
⚙️ How to Use the Aquaculture KPI Scorecard in Excel
1️⃣ Open the KPI Definition Sheet and define your aquaculture KPIs — name, group, unit, formula, and type.
2️⃣ Enter monthly actual and target values in the Input Data Sheet.
3️⃣ Go to the Scorecard Sheet, select the month and choose MTD or YTD view.
4️⃣ Review traffic-light indicators to spot underperforming KPIs instantly.
5️⃣ Open the KPI Trend Sheet, select a KPI from the C3 dropdown, and analyze 12-month trends.
6️⃣ Update data monthly to maintain accurate, up-to-date aquaculture performance insights.
💼 Real-World Use Cases
Rajesh manages a 50-pond tilapia farm in South India. He uses the Aquaculture KPI Scorecard in Excel to track feed conversion ratio, survival rate, and cost per kilogram across all ponds. Each month, he enters actuals into the Input Data sheet and presents the traffic-light scorecard to his farm director — replacing a 3-hour manual report with a 10-minute data entry routine.
Maria runs a shrimp hatchery in Ecuador. She monitors stocking density, water quality index, and harvest yield using the MTD and YTD views. The trend charts help her spot seasonal dips in survival rates early enough to adjust feeding schedules, saving an estimated 12% in feed costs per cycle.
Tom is an aquaculture consultant in Norway. He uses the KPI Definition sheet to standardize metrics across 8 client sites, then generates monthly scorecards by swapping the Input Data. Each client gets a branded performance report built from the same template — no SaaS fee per client.
❓ Frequently Asked Questions
What KPIs does the Aquaculture KPI Scorecard in Excel track?
The Aquaculture KPI Scorecard in Excel tracks aquaculture metrics including feed conversion ratio, survival rate, harvest volume, cost per kilogram, water quality index, stocking density, and revenue per pond. All KPIs update automatically when you replace the sample data.
How long does it take to set up this aquaculture scorecard?
Setup takes under 10 minutes. Define your KPIs in the Definition sheet, enter your actual and target values in the Input Data sheet, and the Scorecard and Trend sheets update automatically with no manual formula work.
Can I add custom KPIs specific to my fish farm?
Yes. The Aquaculture KPI Scorecard in Excel is fully editable. Add new rows for custom KPIs like dissolved oxygen levels, pH readings, or biomass growth rate. The formulas and charts will extend to cover your additions.
How does this compare to paid aquaculture management software?
Paid SaaS tools like AquaManager cost $50–200 per month and require internet access. The Aquaculture KPI Scorecard in Excel costs $12.99 one-time, works offline in Excel, and gives you full data ownership with no recurring fees.
Does this scorecard work on Mac?
Yes. The Aquaculture KPI Scorecard in Excel works on both Windows and Mac versions of Microsoft Excel. No VBA macros are used, so compatibility is not an issue.
Is there a Google Sheets version available?
Yes. NextGenTemplates also offers the Agriculture KPI Scorecard in Google Sheets for teams that prefer cloud-based collaboration. Both versions follow the same scorecard structure.
Can I use this for multiple farm sites?
Yes. Duplicate the Input Data sheet for each site, or consolidate all site data into one sheet using a site identifier column. The Scorecard will reflect whichever data set you point it to.
👤 About the Author
Built by PK — Microsoft Certified Professional with 15+ years of Excel, Google Sheets, and Power BI experience. Founder of NextGenTemplates, reaching 300K+ subscribers across YouTube channels (@PK-AnExcelExpert, @NextGenTemplates, @NeoTechNavigators). Every template is hand-built and tested before release.
🔗 Explore Related Templates
🐄 Agriculture KPI Scorecard in Excel — Track crop yield, irrigation efficiency, and farm profitability KPIs.
🌿 Smart Agriculture KPI Scorecard in Excel — Advanced agriculture KPI tracking with smart farming metrics.
🐕 Wildlife Conservation KPI Scorecard in Excel — Monitor conservation metrics, species populations, and habitat health.
🐾 Animal Shelter KPI Scorecard in Excel — Track adoption rates, intake volumes, and shelter capacity KPIs.
📂 Browse all KPI Dashboard Templates on NextGenTemplates.
📖 Click here to read the Detailed Blog Post
🎥 Visit our YouTube channel for step-by-step video tutorials
👉 YouTube.com/@NextGenTemplates
📅 Last updated: April 2026


Reviews
There are no reviews yet.