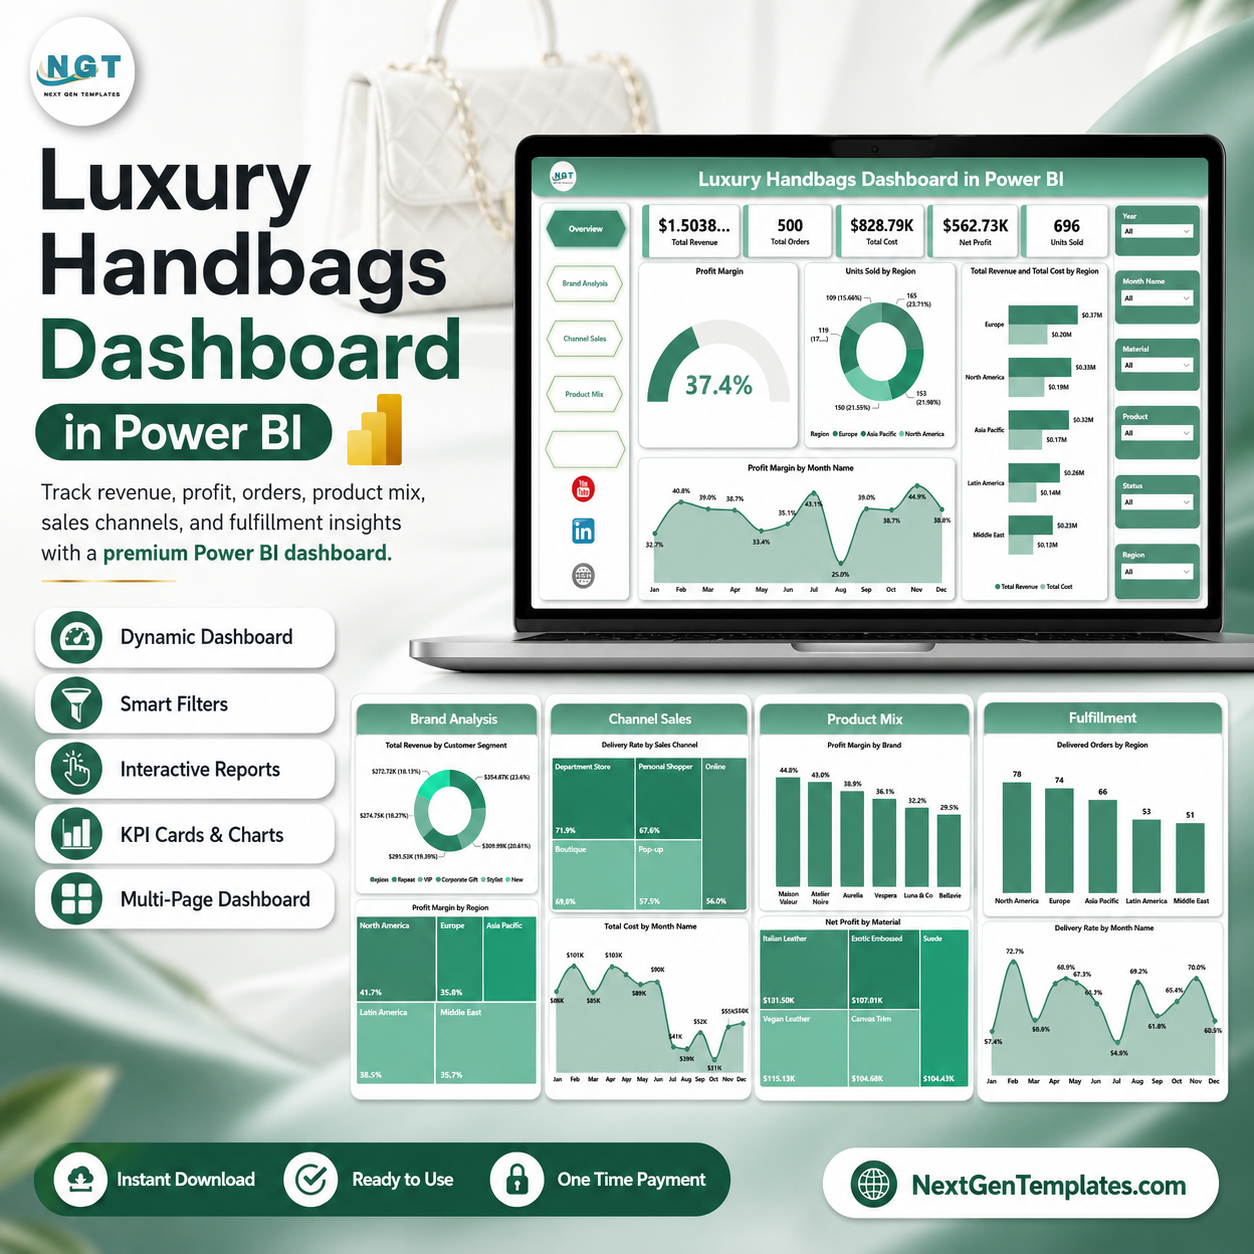


Luxury Handbags Dashboard in Power BI gives retail leaders 5 report pages, 5 executive KPI cards, and 16 focused visuals for revenue, cost, profit, orders, units, region, brand, channel, product mix, returns, delivery, and fulfillment analysis. Luxury handbag sales can move quickly by region, brand, material, channel, and season, so a static spreadsheet can hide margin leakage and fulfillment issues. This editable PBIX dashboard helps teams replace manual reporting with a ready Power BI reporting layer. Built by PK with 15+ years of Excel and Power BI experience and 300K+ subscribers across training channels. One-time purchase, instant ZIP download, and a practical file-match review if the delivered file does not match this description.
Key Features of Luxury Handbags Dashboard in Power BI
- 5 report pages: Overview, Brand Analysis, Channel Sales, Product Mix, and Fulfillment.
- 5 KPI cards: Total Revenue, Total Orders, Total Cost, Net Profit, and Units Sold.
- 16 analysis visuals: Review profit margin, revenue, cost, units sold, customer segment, sales channel, product category, material, returns, delivered orders, and delivery rate.
- Interactive slicers: Filter pages quickly and compare selected regions, months, brands, channels, categories, and customer groups.
- Retail-ready Power BI file: Customize measures, visuals, slicers, labels, colors, and pages in Power BI Desktop.
- Luxury handbag reporting focus: Built for premium retail, fashion merchandising, e-commerce, and operations teams.
What’s Inside the Luxury Handbags Dashboard in Power BI
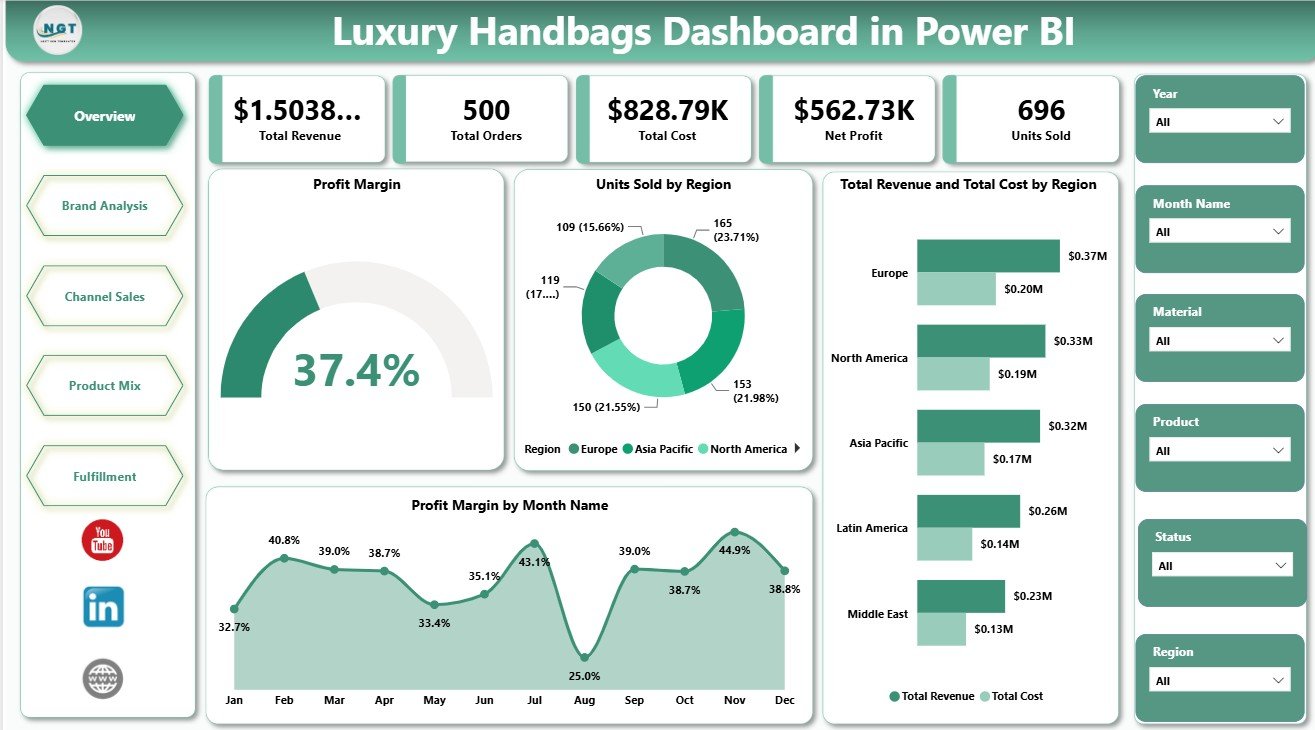
1 – Overview Page
The Overview page gives a high-level snapshot of the handbag business. The cards show Total Revenue, Total Orders, Total Cost, Net Profit, and Units Sold so managers can review commercial performance quickly.
Profit Margin: This visual highlights profitability after cost impact. It helps leaders see whether the selected period, brand, or region is producing acceptable margin.
Units Sold by Region: This chart compares unit movement across regions. It helps identify strong markets and regions that may need pricing, stock, or marketing attention.
Total Revenue and Total Cost by Region: This visual compares revenue and cost side by side for each region. It helps reveal whether high-revenue regions are also carrying high cost pressure.
Profit Margin by Month Name: This monthly trend shows how margin changes across the year. It supports seasonality review, campaign planning, and quick margin checks.

Luxury Handbags Dashboard in Power BI
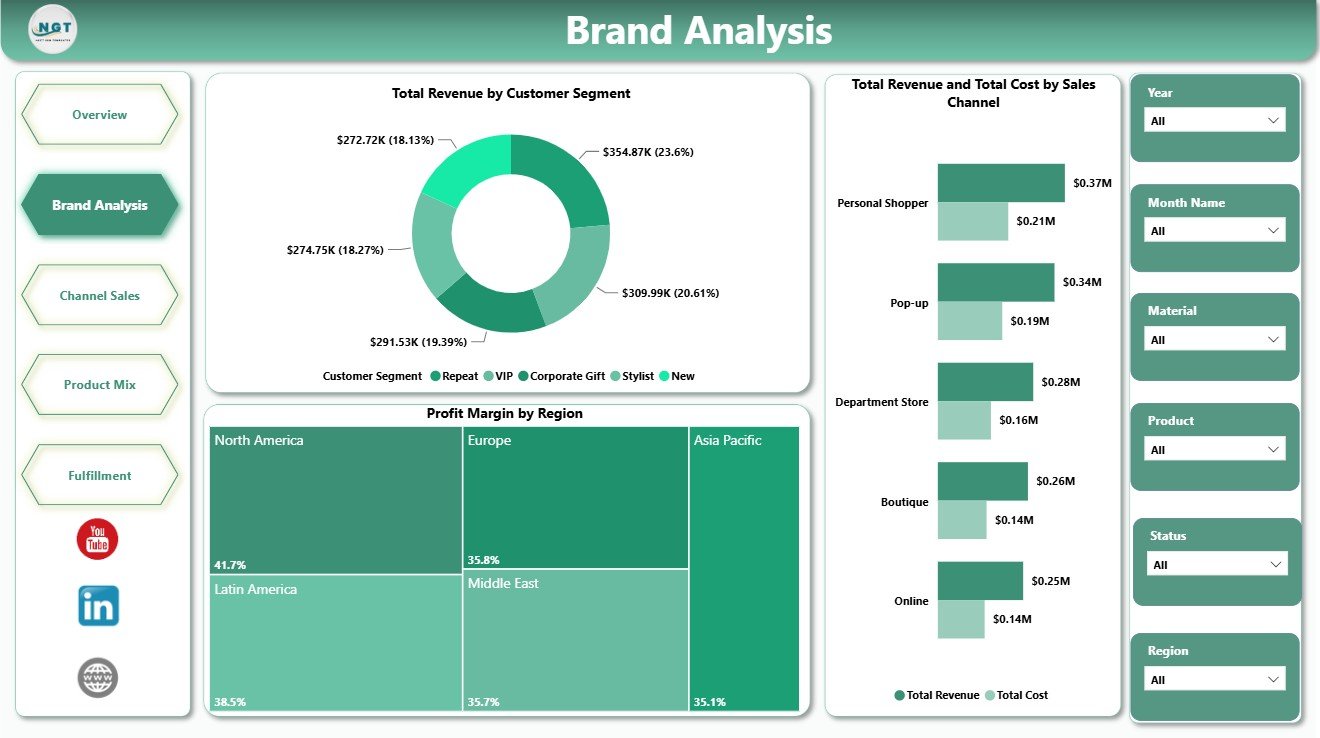
2 – Brand Analysis
The Brand Analysis page focuses on customer, region, and channel performance for luxury handbag brands.
Total Revenue by Customer Segment: This chart shows which customer groups generate the most revenue. It helps teams compare premium, loyal, new, or other customer segments for targeted selling.
Profit Margin by Region: This visual compares margin performance across regions. It helps identify markets where pricing, discounting, shipping cost, or product mix may need review.
Total Revenue and Total Cost by Sales Channel: This chart compares channel revenue and cost together. It helps teams evaluate whether online, retail, marketplace, or wholesale channels are profitable enough.
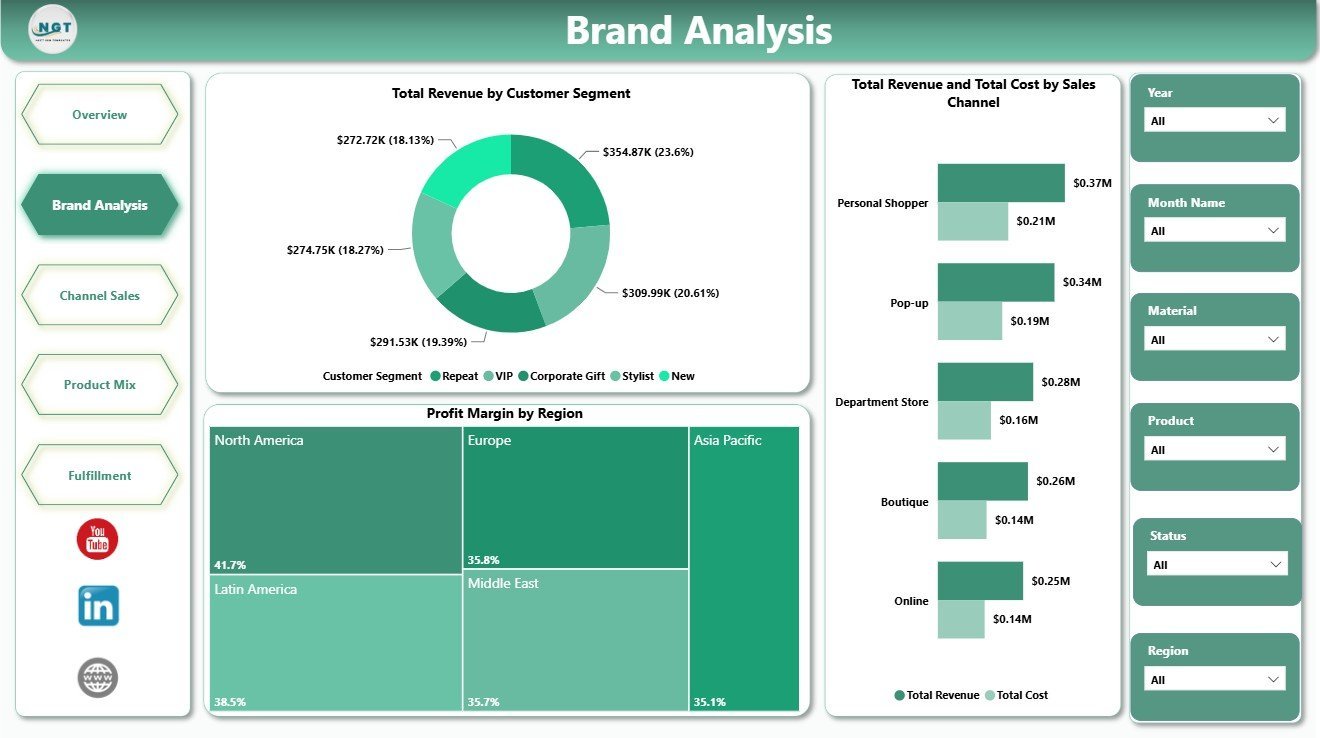
Brand Analysis
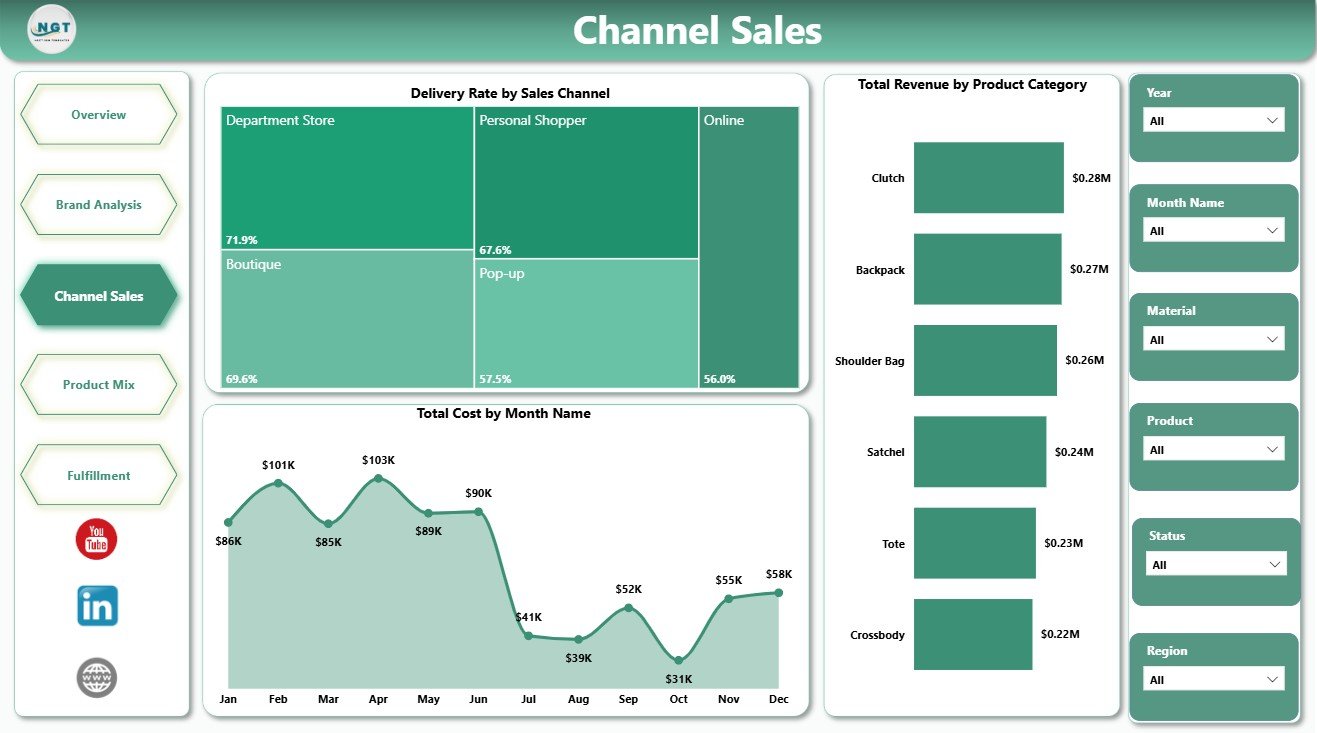
3 – Channel Sales
The Channel Sales page helps sales and operations teams review delivery, cost, and category revenue by channel and month.
Delivery Rate by Sales Channel: This chart compares delivery performance across sales channels. It helps identify channels where fulfillment service is strong or where delivery completion needs attention.
Total Cost by Month Name: This trend shows monthly cost movement. It helps leaders spot cost spikes, seasonal expense patterns, and periods that require margin review.
Total Revenue by Product Category: This visual compares revenue across handbag categories. It helps merchandising teams see which categories are driving the most sales value.
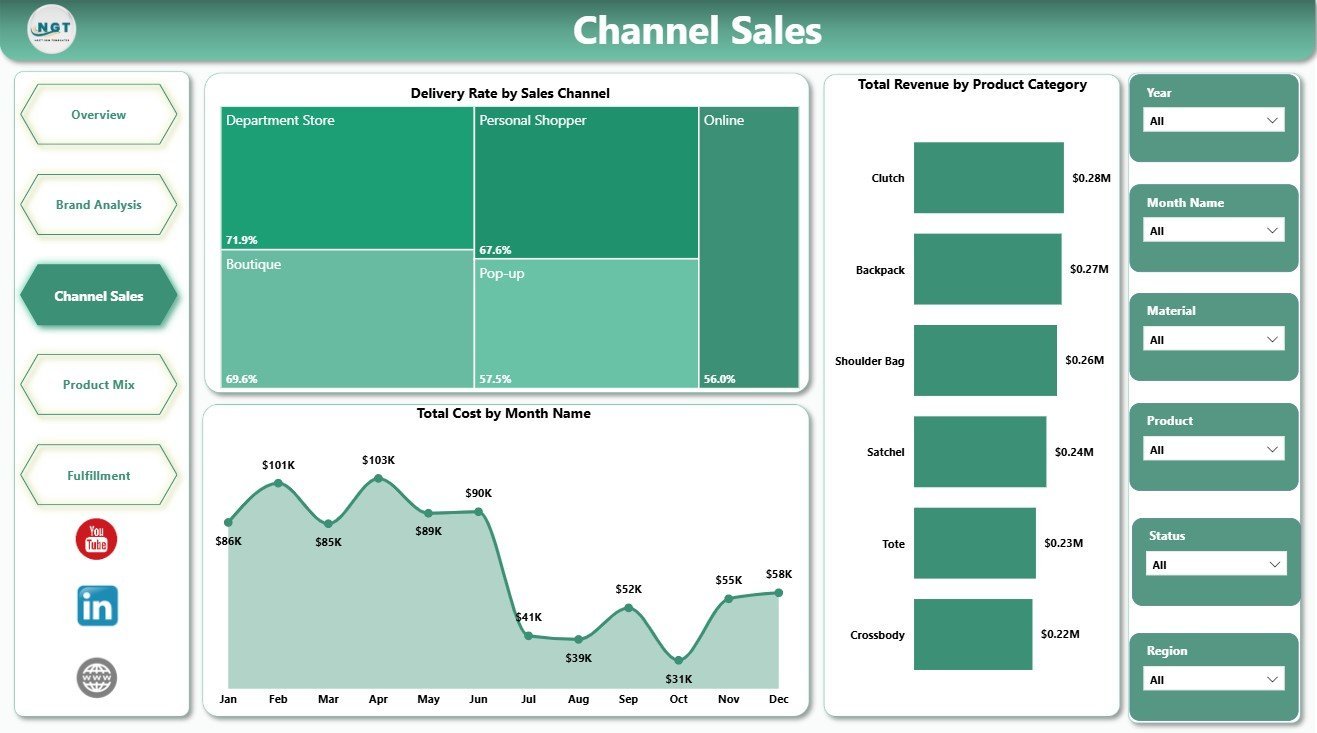
Channel Sales
4 – Product Mix
The Product Mix page is built for merchandising, product, and category review.
Profit Margin by Brand: This chart compares margin by brand. It helps leaders see which handbag brands protect profit and which may need pricing or sourcing review.
Net Profit by Material: This visual shows net profit by material type. It helps product teams evaluate leather, vegan, canvas, suede, or other material profitability.
Returned Orders by Product Category: This chart highlights returns by category. It helps teams detect quality, sizing, expectation, or fulfillment issues in specific handbag categories.
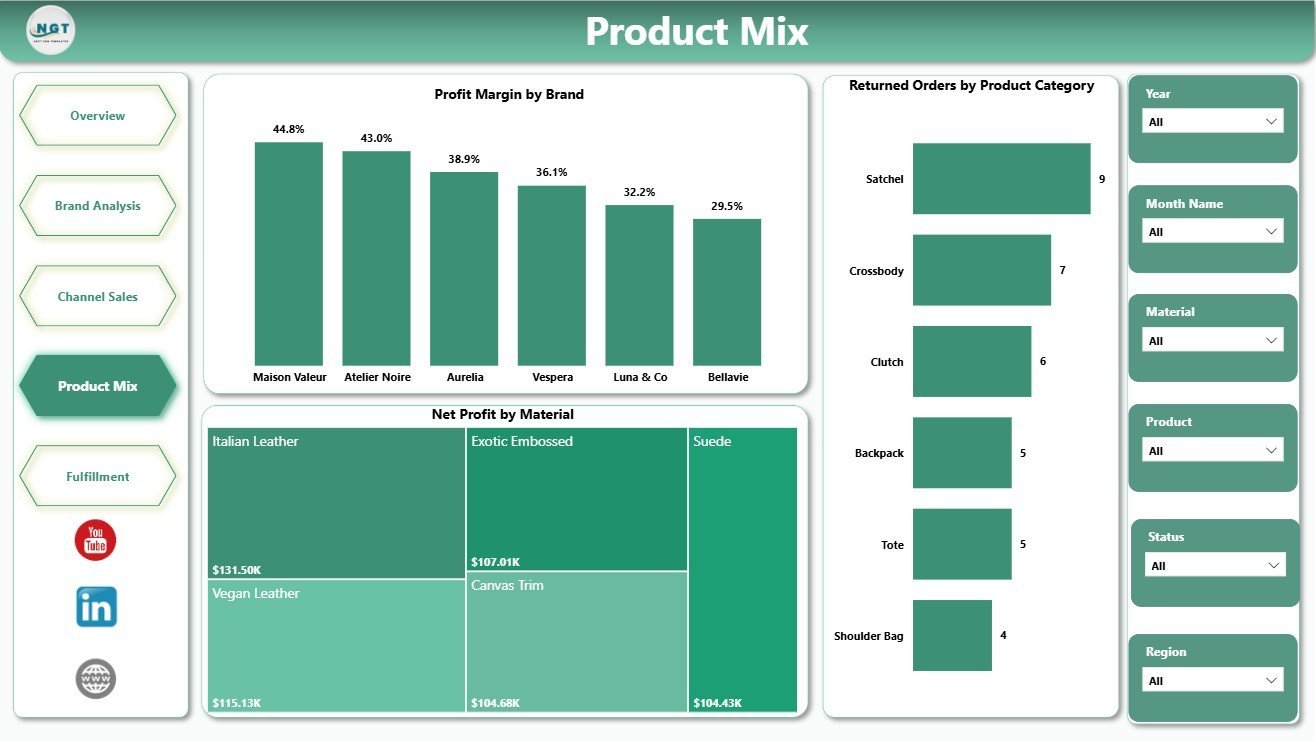
Product Mix
5 – Fulfillment
The Fulfillment page helps operations teams review delivery outcomes and order volume by region and month.
Delivered Orders by Region: This chart compares delivered order counts across regions. It helps operations teams identify where fulfillment volume is concentrated.
Delivery Rate by Month Name: This trend tracks delivery rate across months. It helps spot service drops, seasonal pressure, and periods where fulfillment needs support.
Total Orders by Region: This visual compares total order volume by region. It helps teams plan inventory, logistics, and customer service coverage by market.
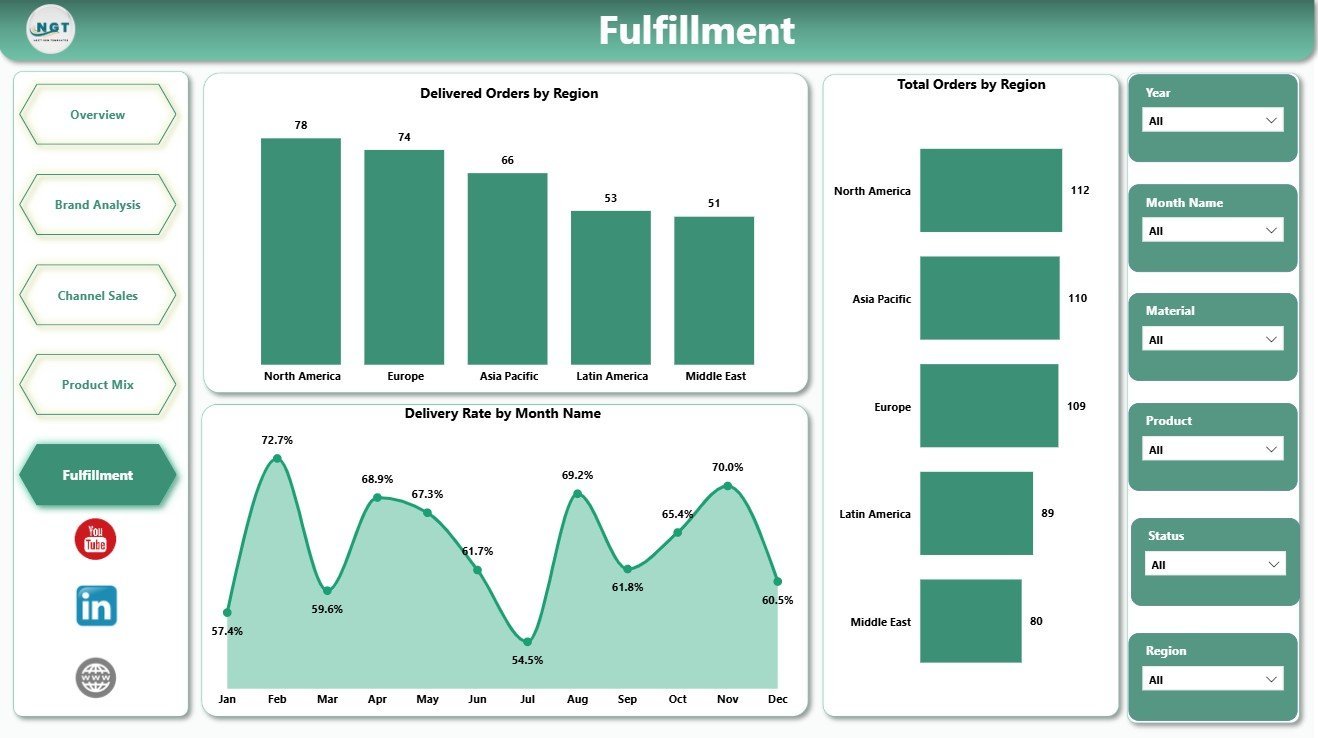
Fulfillment
Luxury Handbags Dashboard in Power BI vs. Tableau vs. Paid Retail SaaS – Where This Fits
| Feature | This Power BI dashboard | Tableau or Qlik alternative | Paid retail SaaS |
|---|---|---|---|
| Cost | $17.99 sale price, one-time | License plus build time | Monthly or annual subscription |
| Platform | Power BI Desktop / Power BI Service | Tableau, Qlik, or another BI platform | Vendor-hosted system |
| Setup time | Open PBIX, replace data, refresh | Build or adapt visuals | Implementation and onboarding |
| Real-time team collaboration | Available through Power BI Service when published | Available with cloud plans | Usually included |
| Mobile access | Available through Power BI mobile after publishing | Plan dependent | Usually included |
| Customizable fields | Editable model, measures, visuals, and pages | Editable with BI skills | Depends on vendor permissions |
| Share with link | Available through Power BI Service | Available with cloud publishing | Login controlled |
| Year-1 cost at 5 users | $17.99 plus any Microsoft licensing | License and build cost dependent | Often hundreds or thousands |
| Luxury handbag pages | Overview, brand, channel, product mix, and fulfillment | Must be designed | Depends on module purchased |
Who This Template Is For – and Who It’s Not For
This template is for luxury handbag brands, fashion retailers, e-commerce teams, boutique chains, merchandising managers, retail analysts, operations teams, and consultants who need a ready Power BI dashboard for sales, profit, channel, product mix, and fulfillment reporting.
It is not a POS system, ERP, live inventory tool, order management system, CRM, or shipping platform. Use it as a reporting dashboard after your handbag sales and operations data is available in a structured source.
How to Use the Luxury Handbags Dashboard in Power BI
- Download and unzip the template package.
- Open the PBIX file in Power BI Desktop.
- Review the sample pages, cards, charts, slicers, and model fields.
- Replace the sample data or connect your own structured sales data.
- Refresh the report and validate revenue, cost, orders, profit, units, returns, and delivery measures.
- Use slicers to filter by month, region, brand, product category, sales channel, material, or customer segment.
Real-World Use Cases
Aisha, retail merchandising manager: reviews revenue by product category, margin by brand, and profit by material before assortment planning.
Dev, e-commerce operations lead: checks delivery rate by channel, returned orders by category, and delivered orders by region before weekly operations review.
Maria, boutique finance analyst: compares total revenue, cost, profit margin, and monthly trends to explain performance shifts to management.
Frequently Asked Questions
What software do I need?
You need Power BI Desktop to open and edit the PBIX file. You can publish it to Power BI Service if your Microsoft account and licensing allow it.
How many pages are included?
The report includes 5 pages: Overview, Brand Analysis, Channel Sales, Product Mix, and Fulfillment.
Can I customize the dashboard?
Yes. You can edit visuals, slicers, colors, fields, measures, page names, and model logic in Power BI Desktop.
Does this connect live to my store system?
No live connector is included. You can replace the sample data or connect your own structured source in Power BI.
Is this only for luxury handbags?
It is designed around luxury handbag metrics, but you can adapt it for fashion accessories, premium retail, or similar product businesses.
Does it replace retail software?
No. It is a reporting dashboard, not a POS, inventory, order management, or shipping system.
About the Author
Built by PK – Microsoft Certified Professional with 15+ years of Excel, Google Sheets, and Power BI experience. Founder of NextGenTemplates, reaching 300K+ subscribers across YouTube channels. Every template is hand-built and tested before release.
Explore Related Templates
Explore more Power BI templates and Power BI dashboard templates. Related options include Luxury Handbags KPI Dashboard in Power BI, Gift Shops Dashboard in Power BI, and Loyalty Programs Management Dashboard in Power BI.
Download the Luxury Handbags Dashboard in Power BI and start reviewing revenue, cost, profit, orders, units, channels, product mix, returns, and fulfillment in one editable PBIX report.
Last updated: July 5, 2026.


Reviews
There are no reviews yet.