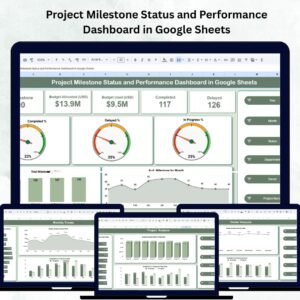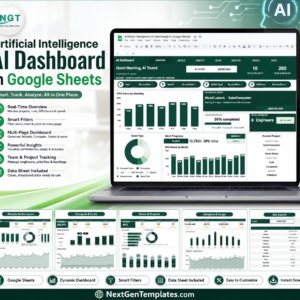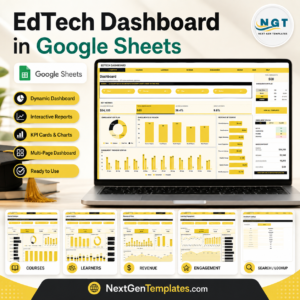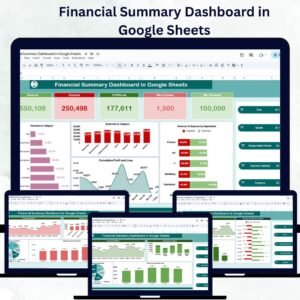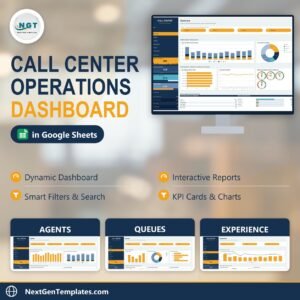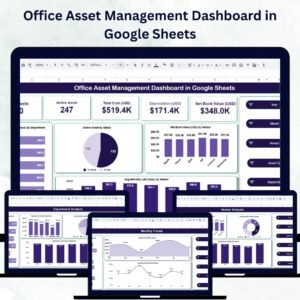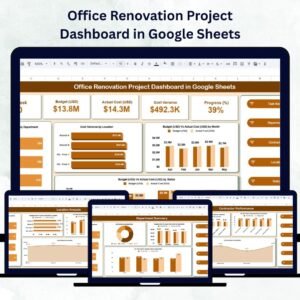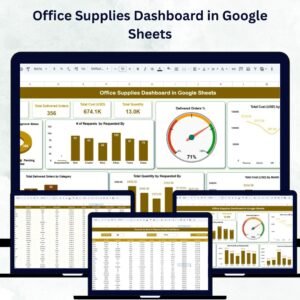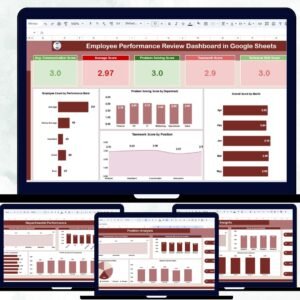
Managing multiple projects efficiently requires visibility, structure, and data-driven insights. The Project Milestone Tracking Dashboard in Google Sheets is a ready-to-use, fully interactive dashboard designed to help teams monitor milestones, track budgets, and visualize progress in real time.
Built with simplicity and flexibility in mind, this Google Sheets-based template transforms complex project data into clear, actionable visuals — enabling managers and teams to stay aligned, identify risks, and meet deadlines effectively.
🔑 Key Features of the Project Milestone Tracking Dashboard in Google Sheets
📊 Overview Sheet Tab
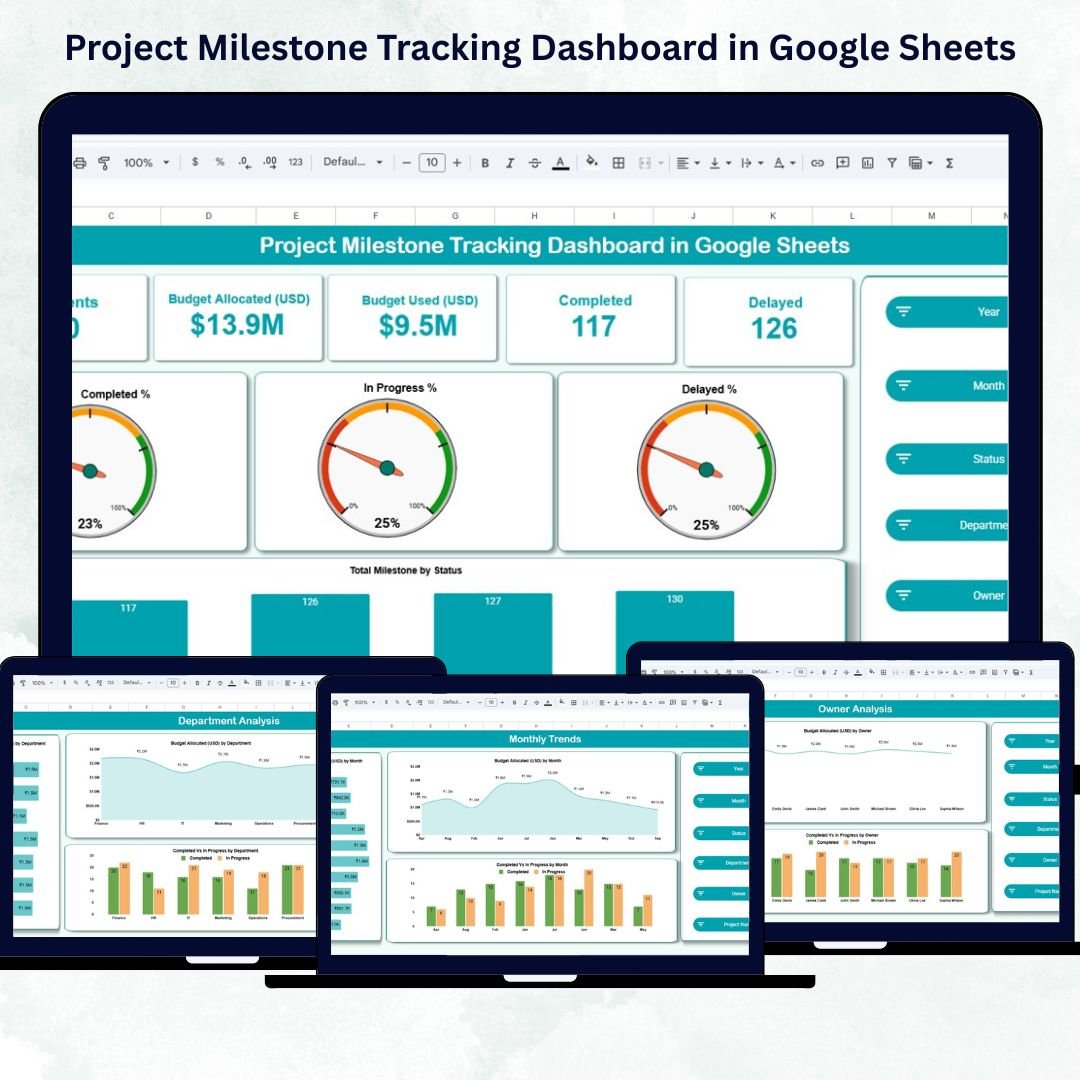
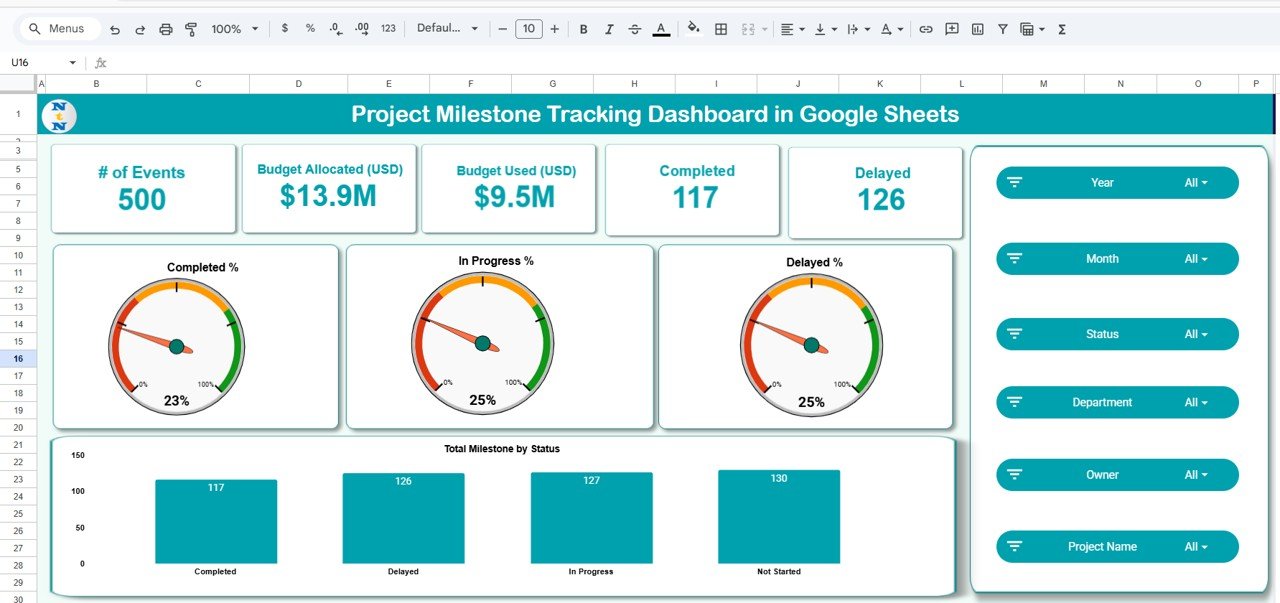
The Overview tab acts as your project control center — displaying all critical metrics and progress indicators in one view.
Cards Section:
🧩 # of Milestones – Total milestones across all projects.
💰 Budget Allocated (USD) – Total project budget planned.
💸 Budget Used (USD) – Actual expenditure to date.
✅ Completed – Number of successfully achieved milestones.
⚠️ Delayed – Number of milestones behind schedule.
Charts Section:
Total Milestone by Status – Displays completion vs. in-progress vs. delayed percentages.
Completed % / In Progress % / Delayed % – Snapshot of current performance.
This tab gives an instant visual summary of project health — ideal for management reviews and stakeholder reporting.
🏗️ Project Analysis Tab
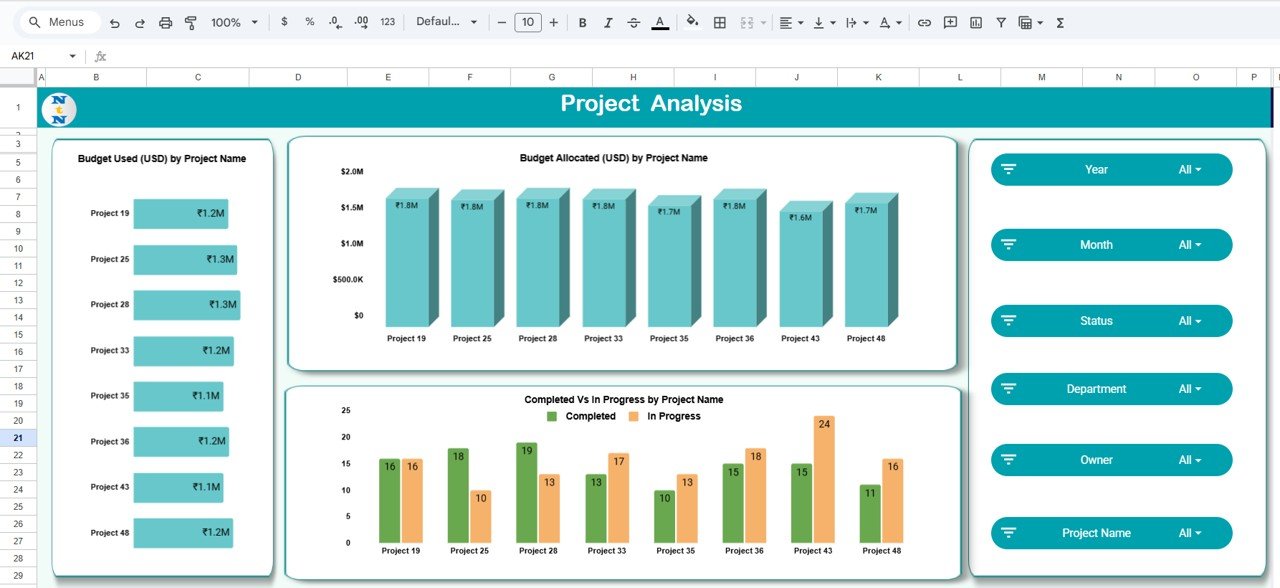
Dive deeper into individual project performance with visual comparisons.
Charts include:
Budget Used (USD) by Project Name
Budget Allocated (USD) by Project Name
Completed vs. In Progress by Project Name
This helps identify projects that are underperforming, over budget, or facing delays — allowing timely corrective actions.
🏢 Department Analysis Tab
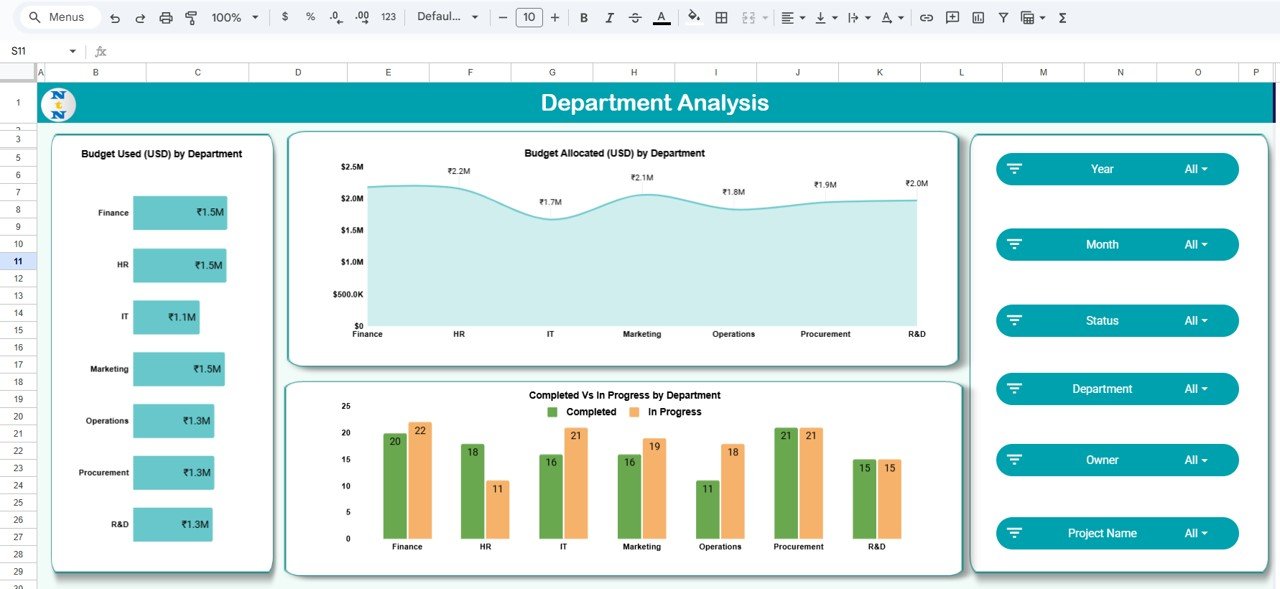
Measure milestone progress and spending across departments.
Charts include:
Budget Used vs. Allocated (USD) by Department
Completed vs. In Progress by Department
This view supports interdepartmental performance evaluation, enabling department heads to optimize resource allocation and project planning.
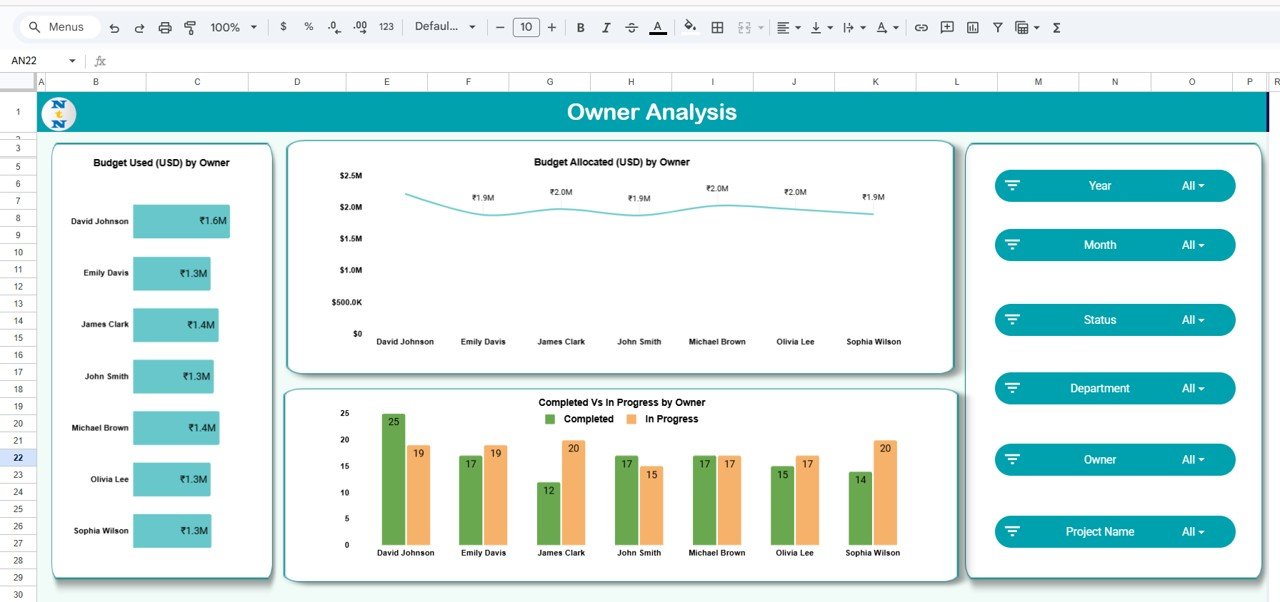
👥 Owner Analysis Tab
Evaluate accountability and performance at the project owner level.
Charts include:
Budget Used vs. Allocated (USD) by Owner
Completed vs. In Progress by Owner
Ideal for leadership reporting, this analysis reveals which project managers consistently deliver within scope, time, and budget.
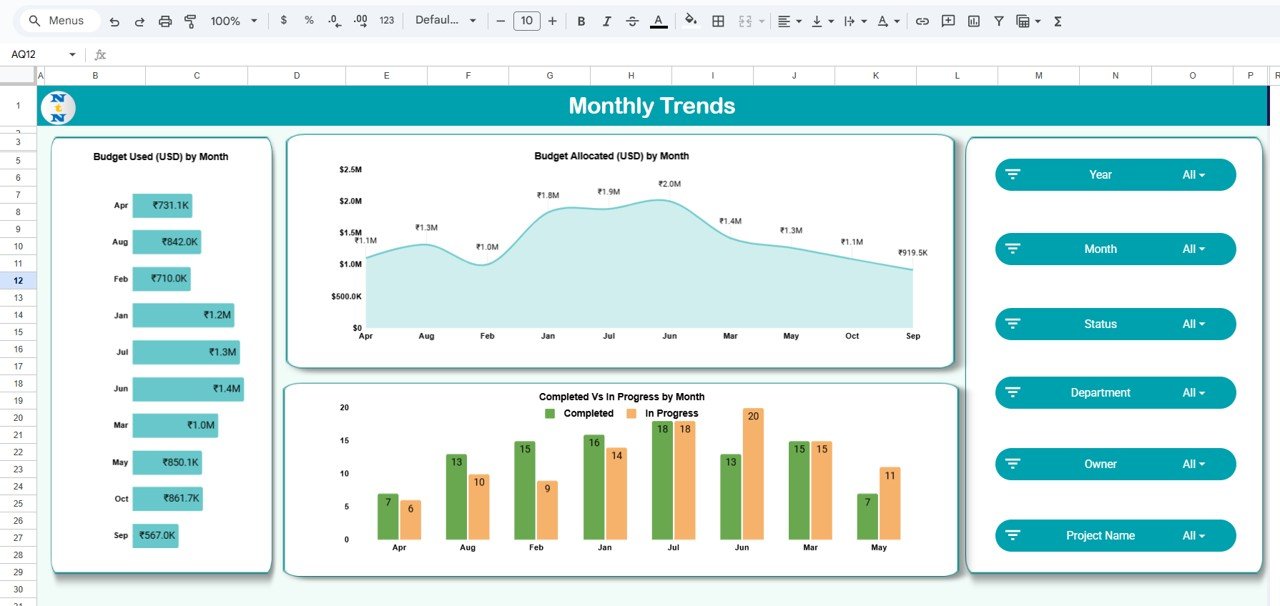
📅 Monthly Trends Tab
Gain a time-based understanding of project progress.
Charts include:
Budget Used vs. Allocated (USD) by Month
Completed vs. In Progress by Month
Helps forecast workload, detect recurring issues, and evaluate seasonality in project execution.
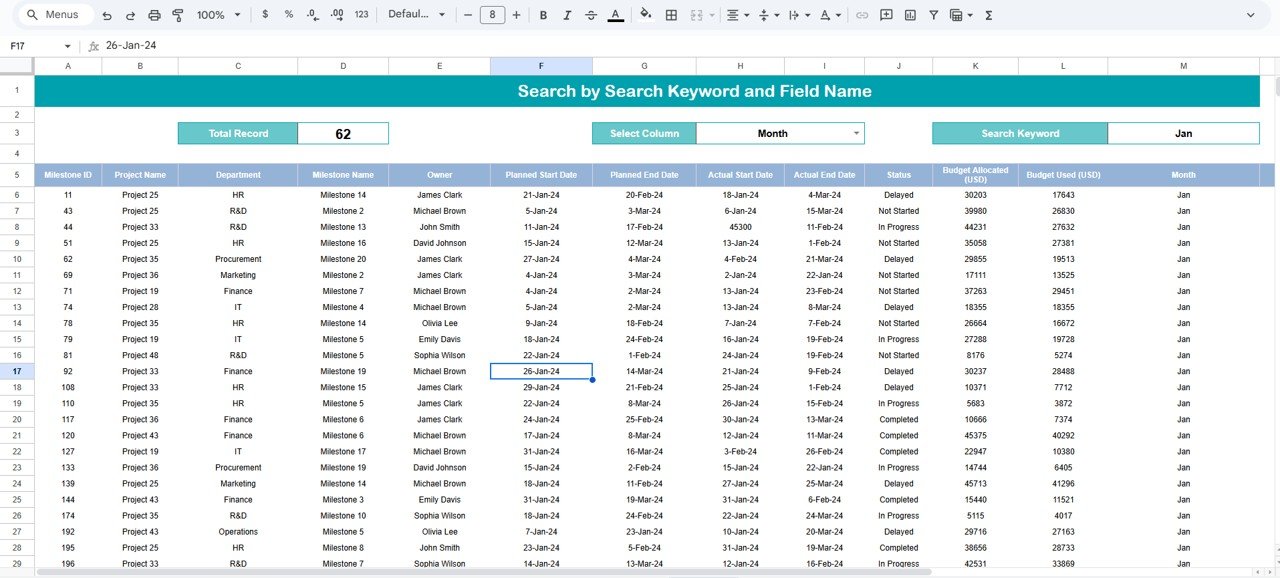
🔍 Search Tab
Quickly find specific project or milestone records using keyword or field-based search filters.
Search for:
Project name
Department
Owner
Milestone status
Date range
This dynamic search functionality saves time and enhances user navigation.
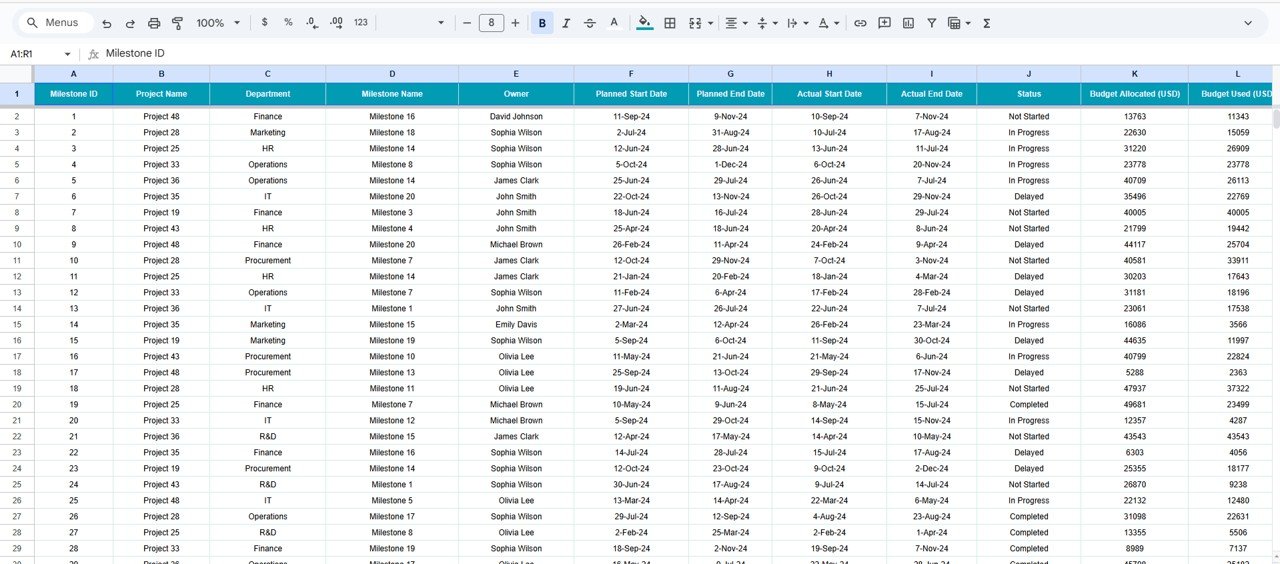
📋 Data Sheet Tab
The backbone of the dashboard — where all project and milestone data resides.
Includes fields for:
Project Name
Department
Owner
Budget Allocated
Budget Used
Milestone Status
Completion Date
All visualizations update automatically as you input or modify data — no coding required.
📦 What’s Inside the Template
✅ Overview Dashboard (KPIs + Charts)
✅ Project, Department, and Owner Analysis Pages
✅ Monthly Trend Analysis
✅ Keyword Search Page
✅ Centralized Data Input Sheet
✅ Auto-Updating Graphs and KPIs
✅ Fully Editable Design
Everything you need for real-time project performance tracking — in a single Google Sheets file.
👩💼 Who Can Use This Dashboard
🎯 Project Managers – Monitor progress, budgets, and timelines easily.
🏢 Department Heads – Track team performance and workload distribution.
💼 Executives – Gain a top-level overview of organizational project health.
📈 PMOs (Project Management Offices) – Standardize milestone reporting and reduce manual tracking time.
🌍 Remote Teams – Collaborate seamlessly with shared, cloud-based access.
🌟 Advantages of Using the Project Milestone Tracking Dashboard
📊 Centralized Monitoring: Keep all project data in one interactive view.
💸 Budget Control: Compare allocated vs. used funds to prevent overspending.
⏱️ Timely Insights: Detect delays before they impact delivery.
⚙️ Customizable Design: Add KPIs, charts, or filters as per your workflow.
🤝 Collaborative Access: Teams can update and analyze together in real time.
📈 Data Visualization: Convert raw project data into actionable performance insights.
💡 Best Practices
Update milestone data weekly for accurate visuals.
Use conditional color coding (green, yellow, red) to flag project health.
Define consistent milestone naming conventions for clarity.
Track department and owner performance monthly to optimize efficiency.
Review the Monthly Trends tab for forecasting and performance improvement.
🚀 How This Dashboard Helps Project Managers
Simplifies Project Oversight: View all milestones, budgets, and owners in one dashboard.
Improves Accountability: Track who owns what and whether it’s on track.
Supports Data-Driven Planning: Identify budget leaks and performance gaps instantly.
Enhances Transparency: Share a single dashboard with stakeholders for real-time reporting.
Saves Time: Automates reporting tasks and eliminates repetitive data entry.