

Insurance Tech Startups Dashboard in Excel helps insurtech founders, insurance analysts, product leaders, and startup finance teams track claims, policies, premium revenue, funding, operating cost, burn rate, market fit, and customer satisfaction from one editable workbook. The template includes 7 worksheet tabs, 5 executive KPI cards, 5 dashboard pages, slicers, charts, a structured Data Sheet, and a pivot-powered Support Sheet. Join 8,400+ teams using NextGenTemplates for one-time-purchase business templates. Instant download, lifetime file access, and no monthly SaaS subscription.
Key Features of Insurance Tech Startups Dashboard in Excel
- 5 analysis pages: Overview Page, Funding, Growth, Claims, and Market Fit.
- Executive KPI cards: Total Claims Processed, Startup Records, Avg. Burn Rate, Total Policies Sold, and Total Active Policies.
- Interactive slicers: Filter the dashboard quickly by available dimensions such as month, funding stage, status, region, startup, business model, product type, customer type, and segment.
- Funding analytics: Review funding raised by region, funding stage, and startup while comparing operating cost by business model.
- Growth and claims views: Analyze premium revenue, policies sold, active policies, claim payout, claims processed, burn rate, and customer satisfaction.
- Refreshable Excel model: Update the Data Sheet, click Refresh All from the Excel Data tab, and the pivots and charts refresh automatically.
What’s Inside the Insurance Tech Startups Dashboard in Excel
1. Overview Page
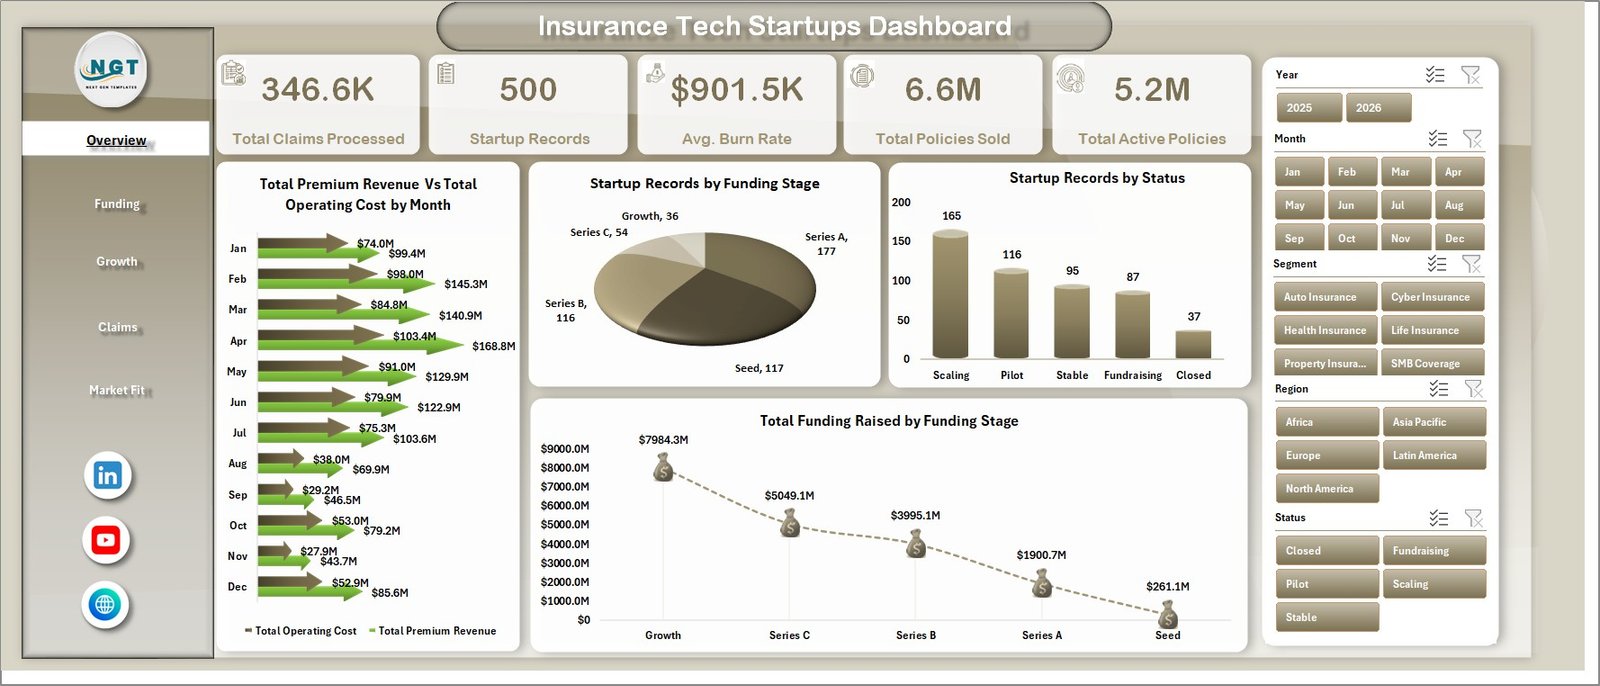
The Overview Page gives a high-level view of insurtech startup performance. Cards show Total Claims Processed, Startup Records, Avg. Burn Rate, Total Policies Sold, and Total Active Policies so leadership can quickly understand activity, growth, and operating pressure.
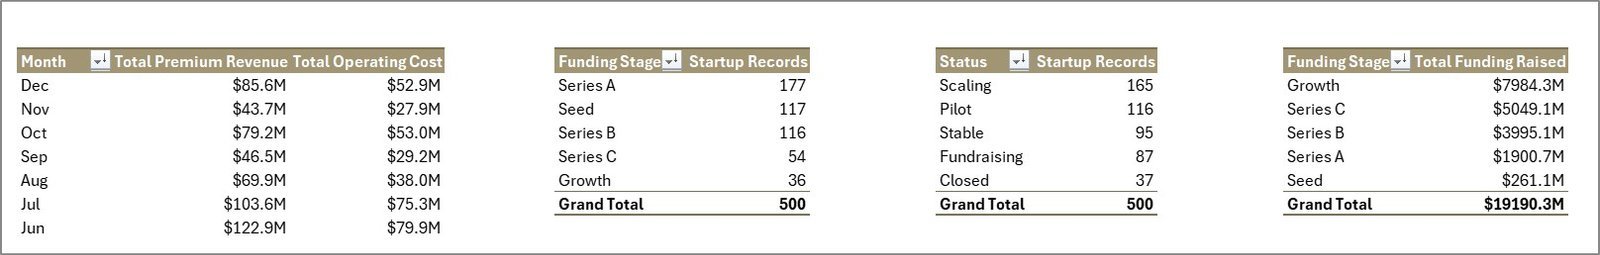
Total Premium Revenue and Total Operating Cost by Month: This chart compares revenue and operating cost across months. It helps teams see whether premium growth is keeping pace with cost movement.
Startup Records by Funding Stage: This visual shows how startup records are distributed across funding stages. It helps investors and operators understand maturity mix across the dataset.
Startup Records by Status: This chart separates startups by operating status. It makes it easier to compare active, inactive, scaling, or other status categories.
Total Funding Raised by Funding Stage: This visual highlights which funding stages hold the most capital raised. It helps teams identify where investment concentration sits.
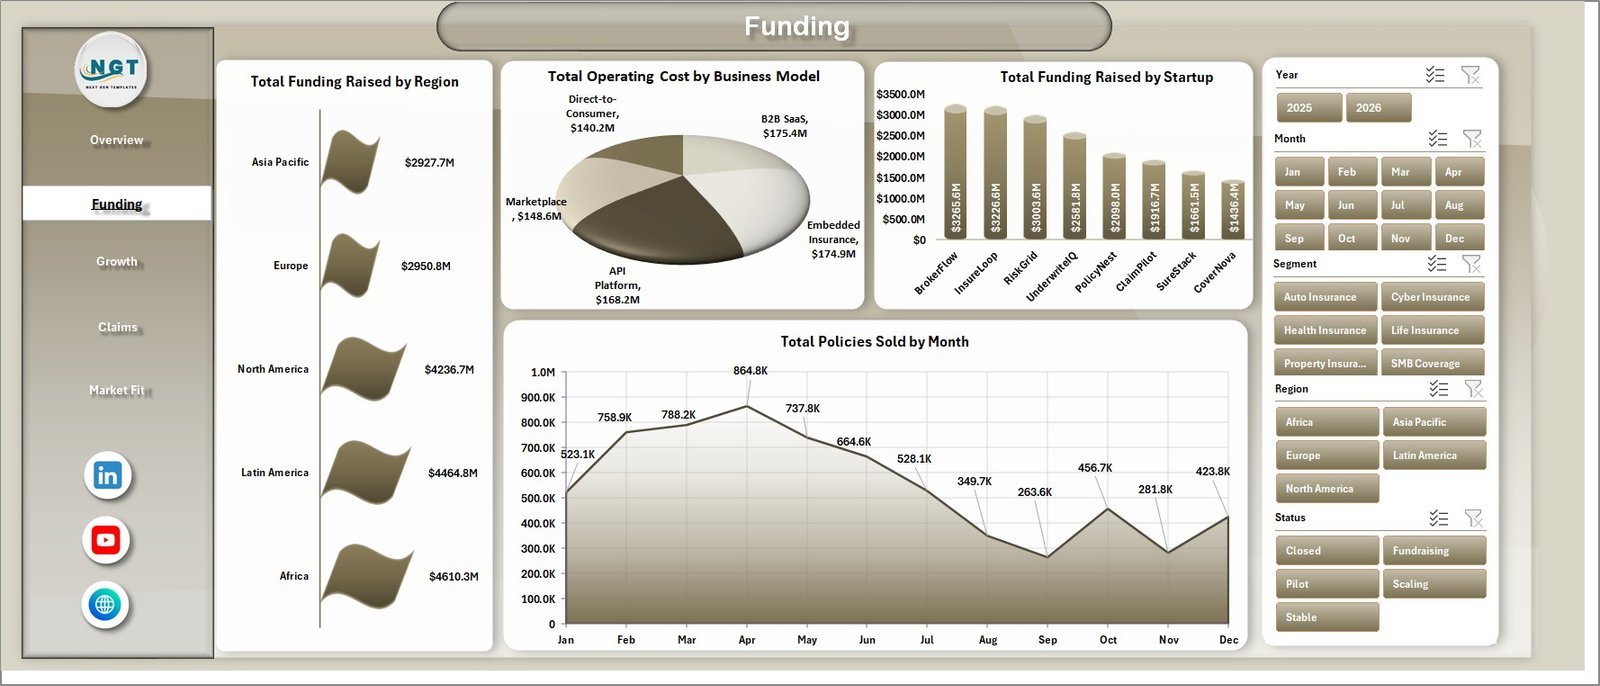
2. Funding
The Funding page focuses on capital, cost, startup, and policy sales analysis. It helps founders, investors, and finance teams review where funding is raised and how business models compare on operating cost.
Total Funding Raised by Region: Compare funding raised across regions to identify strong geographic markets. This supports investor reporting and regional expansion review.
Total Operating Cost by Business Model: Review operating cost by business model to see which startup models require heavier spend. It helps compare cost intensity across insurtech approaches.
Total Funding Raised by Startup: Rank startups by total funding raised. This is useful for benchmarking, portfolio review, and startup-level fundraising analysis.
Total Policies Sold by Month: Track monthly policy sales movement. It helps teams spot growth patterns, seasonal changes, and months needing deeper sales review.

3. Growth
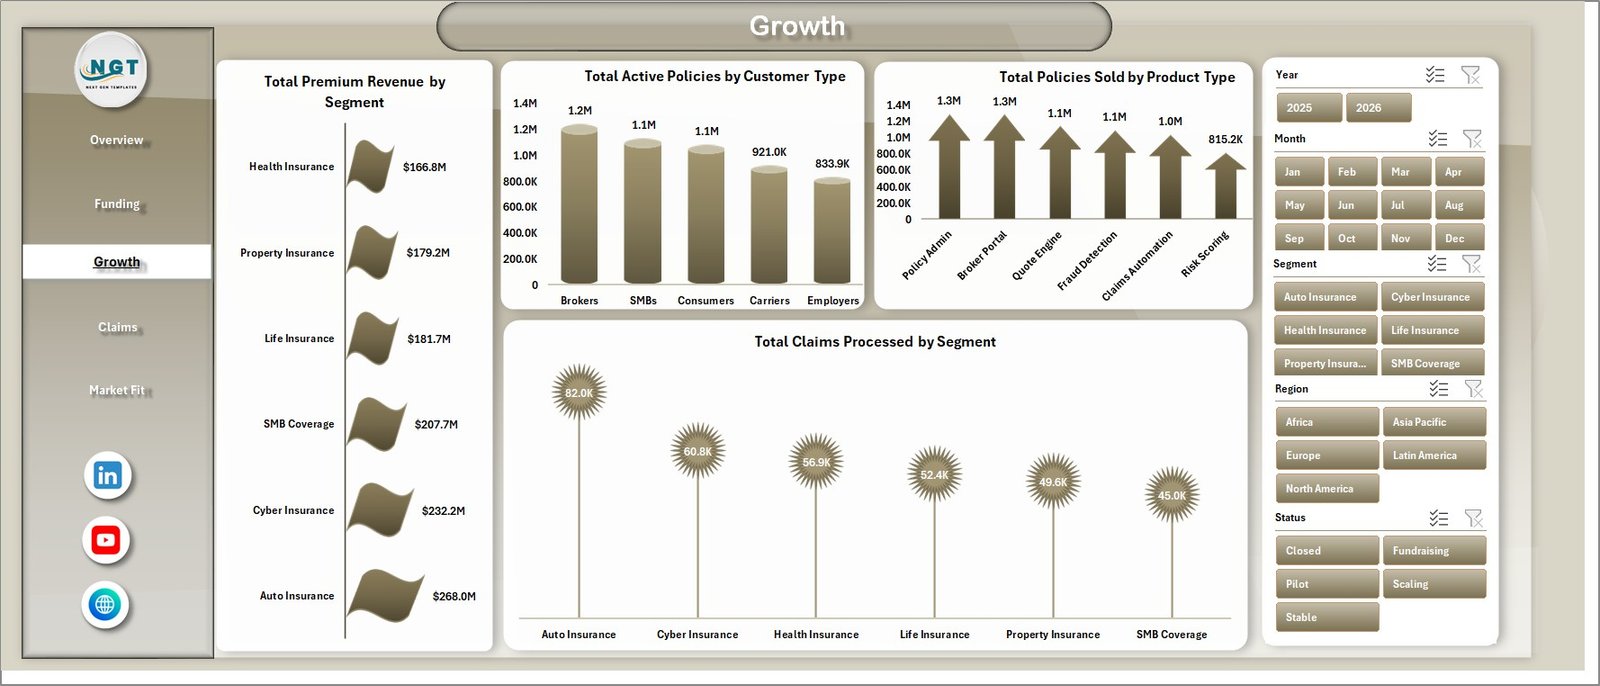
The Growth page helps teams understand premium revenue, active policies, policies sold, and claims processed across customer and product dimensions.
Total Premium Revenue by Segment: Compare premium revenue by customer or market segment. It helps identify which segments are contributing most to revenue.
Total Active Policies by Customer Type: Review active policies by customer type. It helps teams understand retention and active portfolio concentration.
Total Policies Sold by Product Type: Compare policy sales by product type. This helps highlight stronger insurance products and categories needing attention.
Total Claims Processed by Segment: Review claims activity by segment. It helps connect growth performance with claims workload.
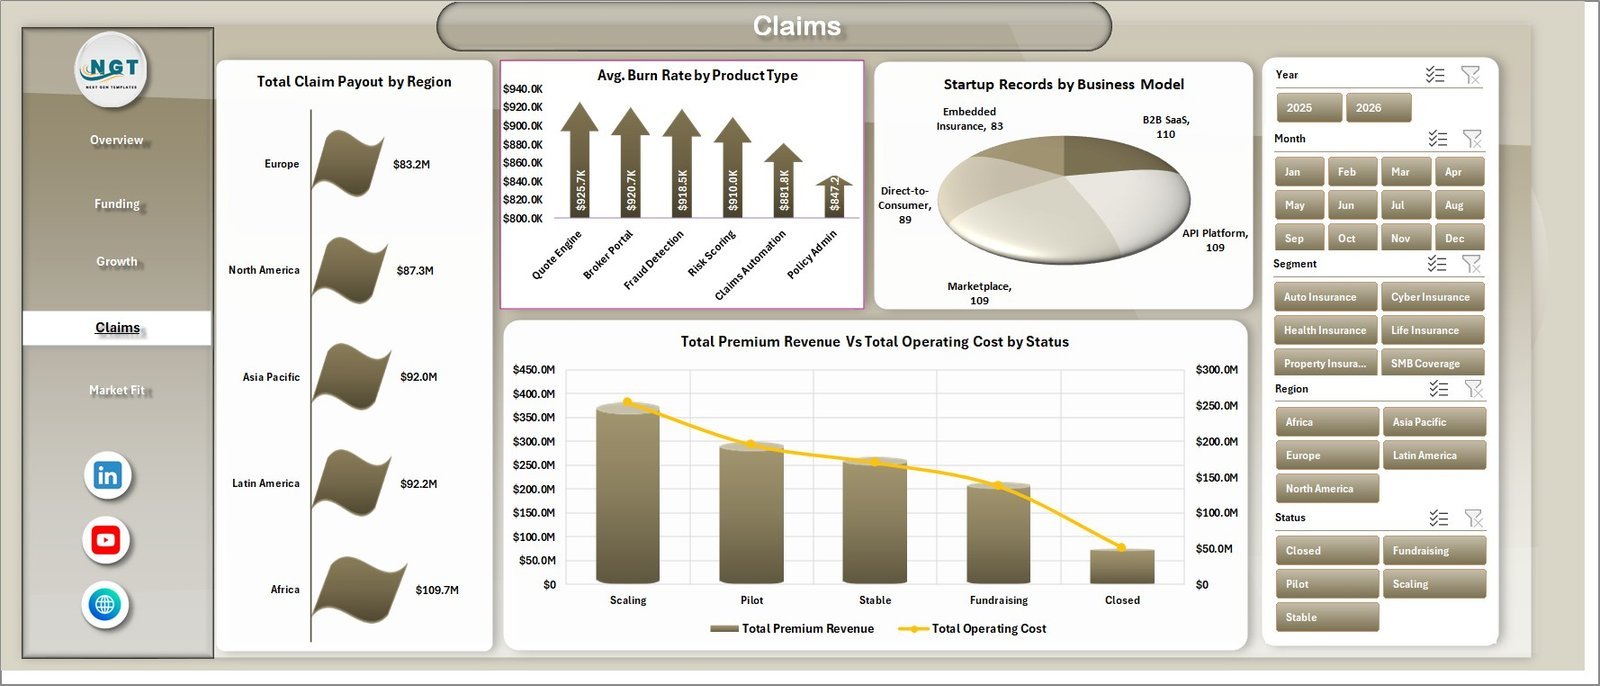
4. Claims
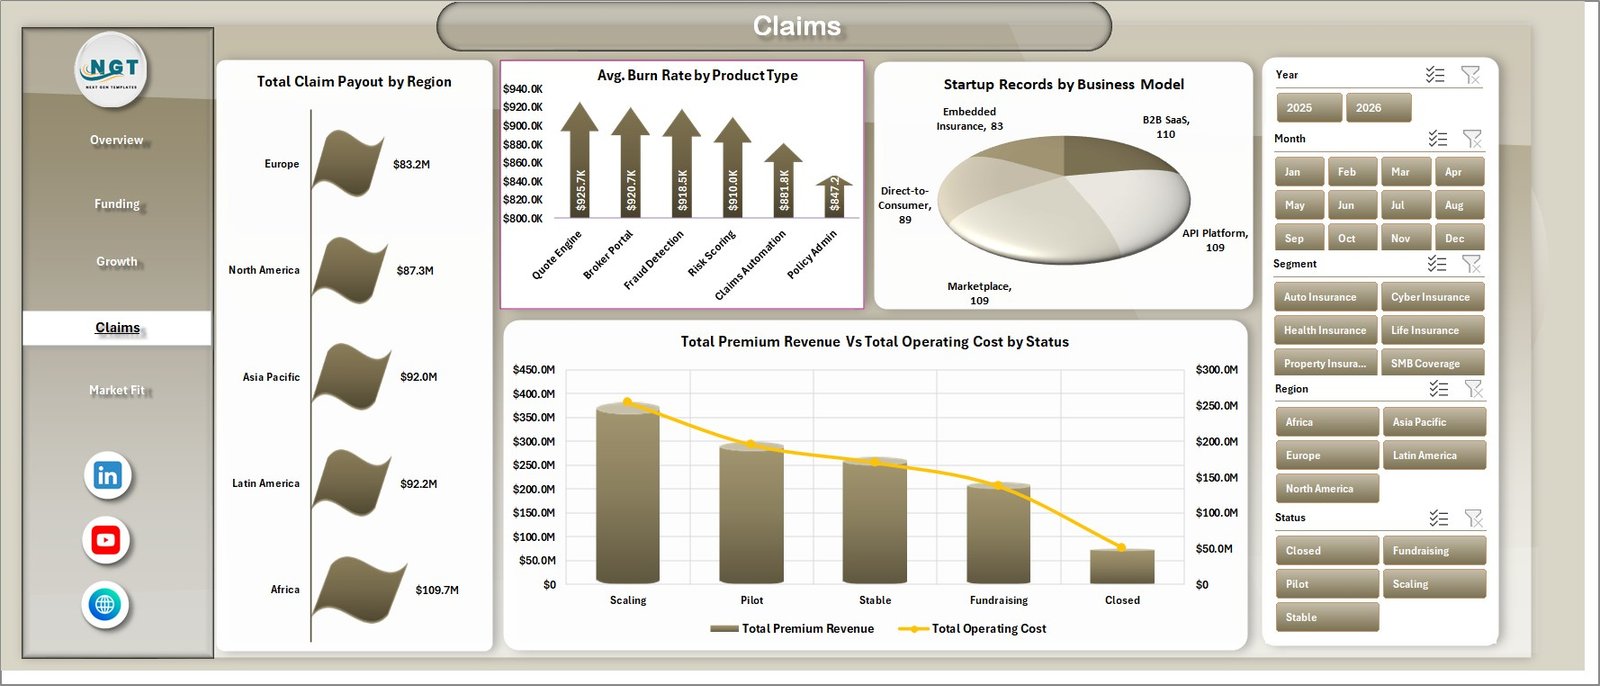
The Claims page brings claim payout, burn rate, business model, premium revenue, operating cost, and status into one review page for operational and financial monitoring.
Total Claim Payout by Region: Compare claim payout across regions to identify claim-heavy geographies. This supports risk and claims review meetings.
Avg. Burn Rate by Product Type: Review average burn rate by insurance product type. It helps teams see where cost pressure is stronger.
Startup Records by Business Model: Compare startup count by business model. This helps understand how the insurtech dataset is distributed.
Total Premium Revenue and Total Operating Cost by Status: Compare revenue and cost by startup status. It helps show whether active or scaling groups are generating enough premium revenue against operating cost.
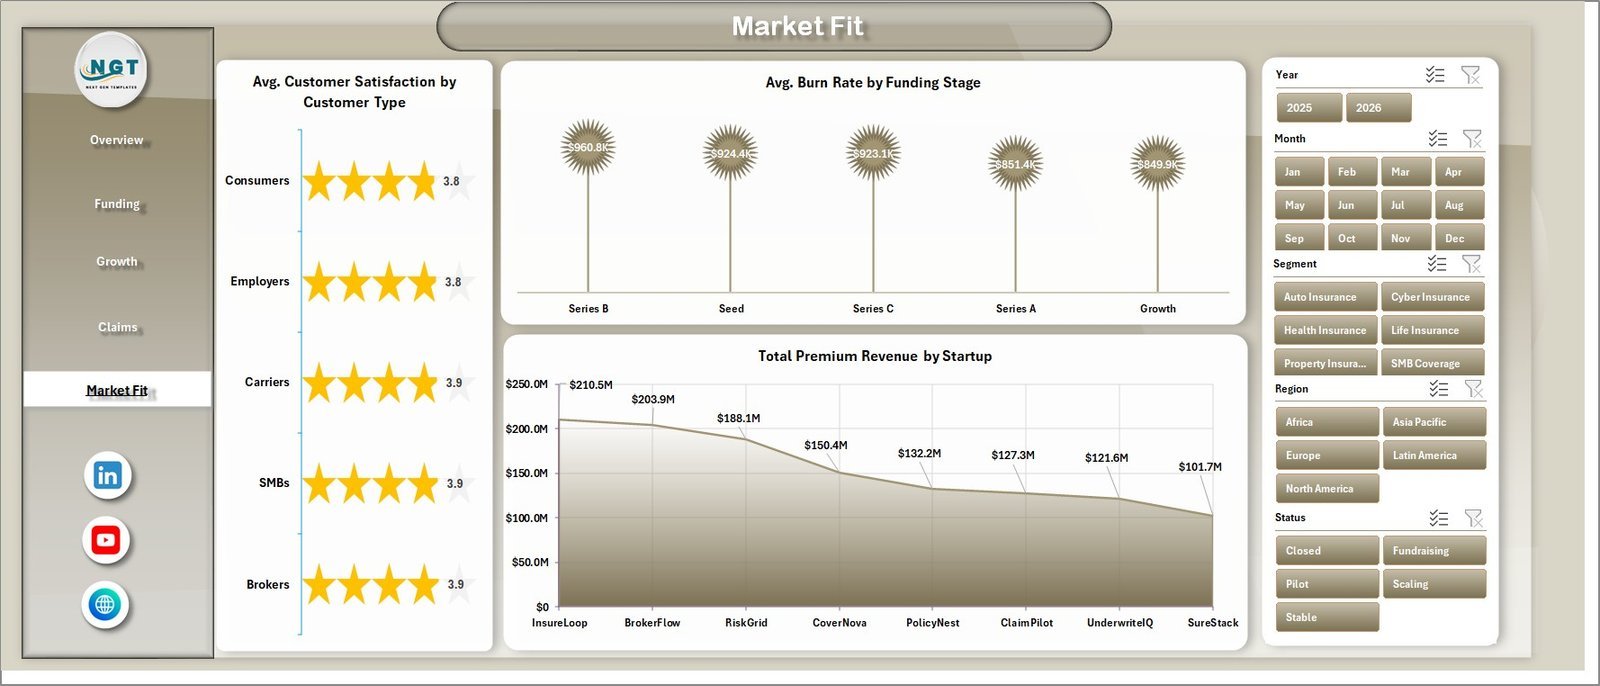
5. Market Fit
The Market Fit page is useful for reviewing customer satisfaction, burn rate, funding stage, and startup-level premium contribution.
Avg. Customer Satisfaction by Customer Type: Compare satisfaction across customer types to identify segments with stronger product-market fit. This helps product and customer teams prioritize improvements.
Avg. Burn Rate by Funding Stage: Review burn rate across funding stages. It helps leadership see how spending changes as startups mature.
Total Premium Revenue by Startup: Rank startups by premium revenue. This helps identify stronger commercial performers in the dataset.

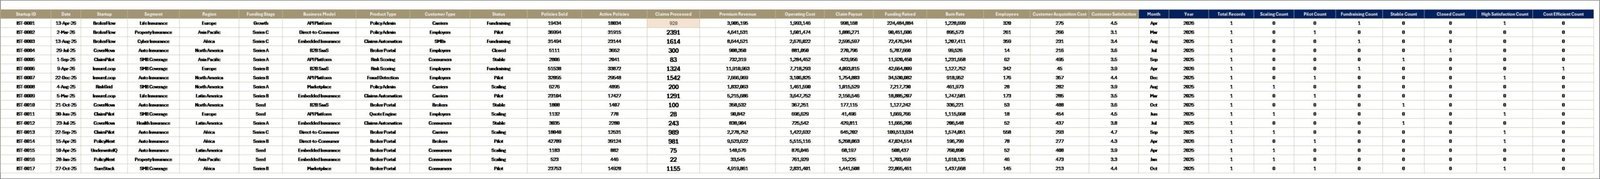
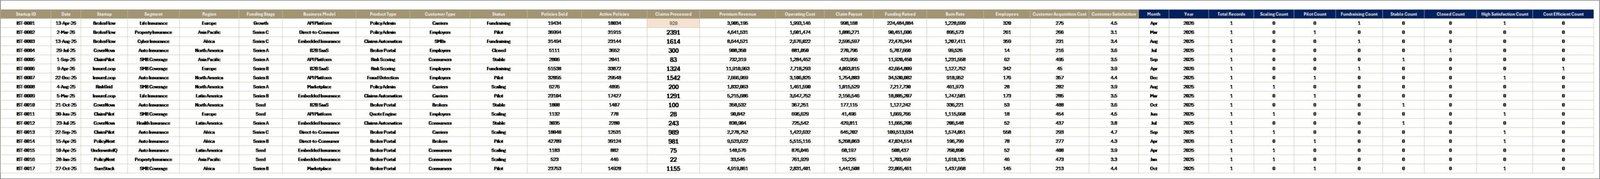
6. Data Sheet Tab
The Data Sheet is where you add or replace the records in the same format as the sample data. Keeping the same structure ensures the pivot tables and charts continue to update correctly.
7. Support Sheet
The Support Sheet contains the pivot tables used to create the entire dashboard dynamically. After updating the Data Sheet, go to the Data tab in the Excel Ribbon and click Refresh All. You can keep this sheet hidden for everyday users.

Insurance Tech Startups Dashboard in Excel vs. Google Sheets vs. Paid CRM/SaaS – Where This Fits
| Feature | This Excel dashboard | Google Sheets alternative | Paid insurance SaaS |
|---|---|---|---|
| Cost | $17.99 one-time | Template or custom sheet build | Monthly or annual subscription |
| Platform | Microsoft Excel | Google Sheets | Vendor cloud platform |
| Setup time | Replace data and refresh pivots | Import data and rebuild analysis | Implementation and onboarding |
| Real-time team collaboration | Available through OneDrive or SharePoint | Native collaboration | Usually included |
| Mobile access | Excel mobile with limitations | Google Sheets mobile | Vendor app or browser |
| Customizable fields | Fully editable workbook | Editable sheet | Depends on plan and admin rights |
| Share with link | Possible through Microsoft 365 | Yes | Usually login-controlled |
| Year-1 cost at 5 users | $17.99 plus any Microsoft licensing | Template cost plus maintenance | Often hundreds or thousands |
| Insurtech startup analytics | Funding, policies, premium, claims, burn rate, and market fit views built in | Must be built or adapted | Depends on vendor module |
Who This Template Is For – and Who It’s Not For
This template is for insurtech startup founders, insurance product managers, startup investors, accelerator teams, finance analysts, and consultants who need a clean Excel reporting layer for funding, premium revenue, policies, claims, burn rate, business model, customer type, and market-fit analysis.
It is not a replacement for policy administration software, claims workflow automation, regulatory filing, payment processing, customer portals, or live API-connected insurance systems. It works best when your data is already collected and you need management reporting inside Excel.
How to Use the Insurance Tech Startups Dashboard in Excel
- Download and unzip the Excel dashboard package.
- Open the workbook in Microsoft Excel.
- Review the sample Data Sheet structure.
- Replace the sample records with your own insurance tech startup data.
- Keep the same columns and field format for clean refreshes.
- Go to the Data tab in Excel and click Refresh All.
- Use the slicers across dashboard pages to filter funding, growth, claims, and market-fit views.
Real-World Use Cases
Neha, insurtech founder: reviews premium revenue, operating cost, policies sold, and burn rate before monthly investor updates.
Arjun, startup analyst: compares funding raised by region, stage, and startup to prepare portfolio review summaries.
Maria, insurance innovation consultant: uses the Growth, Claims, and Market Fit pages to evaluate which segments, products, and customer types show stronger performance.
Frequently Asked Questions
Does this dashboard work in Microsoft Excel?
Yes. The template is built as an Excel dashboard with charts, slicers, pivot tables, a Data Sheet, and a Support Sheet.
What pages are included?
The workbook includes Overview Page, Funding, Growth, Claims, Market Fit, Data Sheet, and Support Sheet tabs.
Can I use my own insurtech data?
Yes. Add your data in the Data Sheet using the same format, then refresh all pivots and charts from the Excel Data tab.
Can I customize the charts?
Yes. You can edit chart titles, colors, formulas, pivot tables, slicers, and layouts directly in Excel.
Is this a full insurance management system?
No. This is an analytics dashboard template, not a claims processing, policy administration, billing, or compliance system.
Can I hide the Support Sheet?
Yes. The Support Sheet is used to power the dashboard with pivot tables and can be hidden after setup.
About the Author
Built by PK – Microsoft Certified Professional with 15+ years of Excel, Google Sheets, and Power BI experience. Founder of NextGenTemplates, reaching 300K+ subscribers across YouTube channels. Every template is hand-built and tested before release.
Explore Related Templates
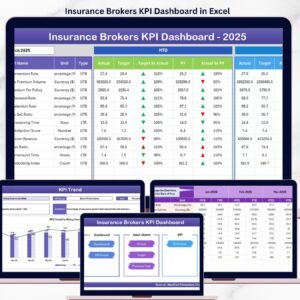
You may also like Freight Insurance Providers Dashboard in Excel, Insurance Brokers KPI Dashboard in Excel, and Financial Tech Startups KPI Dashboard in Excel. Browse more Excel Dashboard templates and MS Excel templates.
Click here to read the detailed blog post.
Download the Insurance Tech Startups Dashboard in Excel today and turn insurtech funding, policies, premium revenue, claims, burn rate, and market-fit data into clear Excel insights.
Last updated: June 25, 2026.


Reviews
There are no reviews yet.