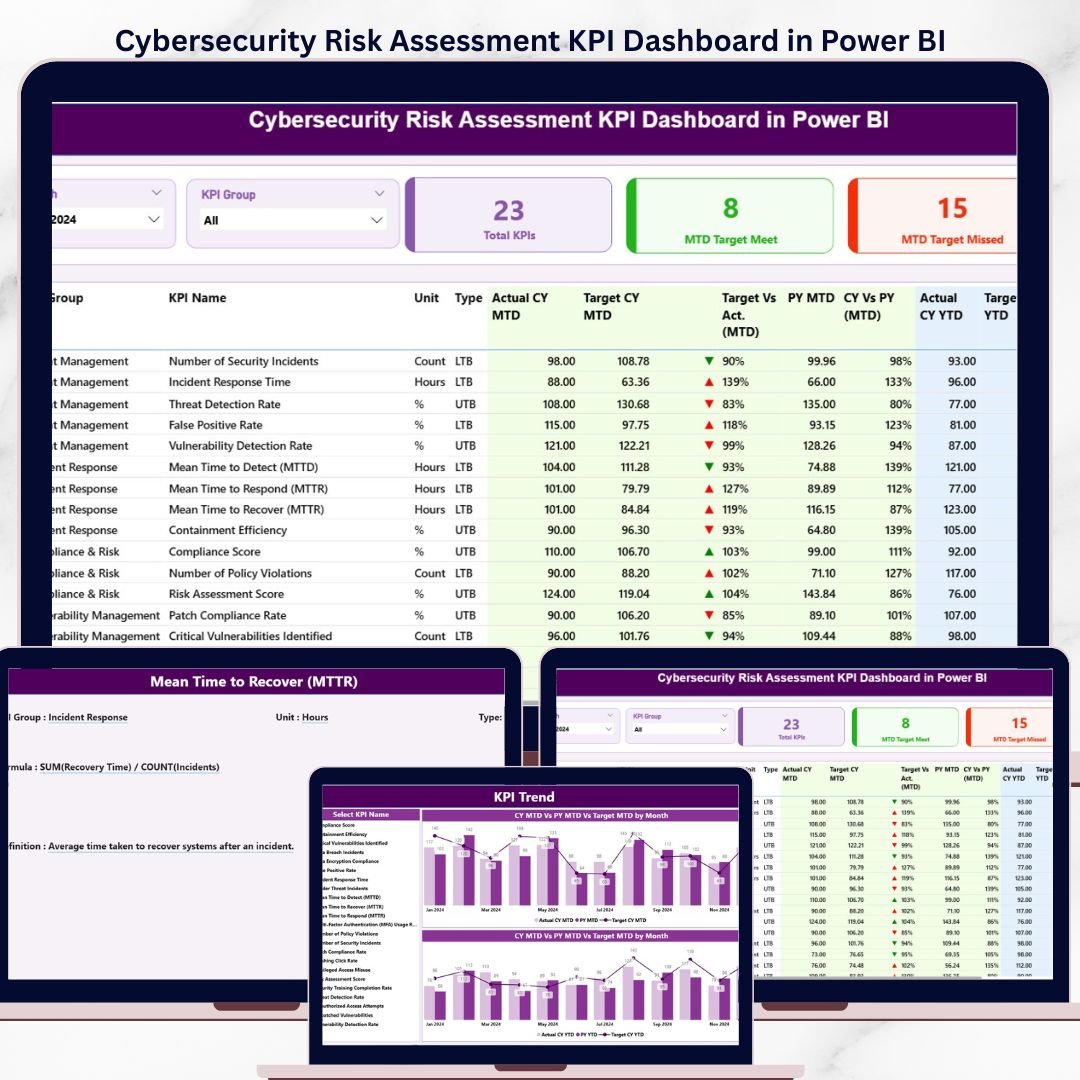
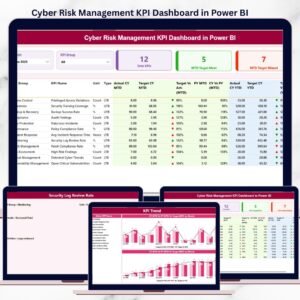
The Cybersecurity Risk Assessment KPI Dashboard in Power BI tracks cyber risk performance across 3 interactive pages, with MTD and YTD comparisons against targets and prior year benchmarks. Setup takes under 10 minutes — replace the sample data in 3 Excel tabs and every visual updates automatically.
🌍 Join 8,400+ teams in 40+ countries using NextGenTemplates to replace paid SaaS tools with one-time-purchase Excel, Google Sheets, Power BI, and HTML templates.
✅ Instant download · One-time payment of $11.99 · No subscription · No per-user fees · Lifetime access
🔑 Key Features of the Cybersecurity Risk Assessment KPI Dashboard
📊 3-page Power BI structure – A Summary page with KPI table, a Trend page with combo charts for MTD and YTD, and a hidden drill-through KPI Definition page accessible from any KPI row.
🎯 MTD and YTD comparison built in – Every KPI shows Actual CY MTD vs Target CY MTD and Actual CY YTD vs Target CY YTD, plus side-by-side comparison with the same period of the previous year.
🟢🔴 Visual status indicators – Red ▼ and green ▲ icons in the MTD Icon and YTD Icon columns instantly flag KPIs missing target. The dashboard automatically applies LTB (Lower the Better) or UTB (Upper the Better) logic per KPI type.
🎚️ Two interactive slicers – Filter the entire Summary page by Month or KPI Group with one click. The Trend page also includes a KPI-name slicer so analysts can isolate one metric at a time.
🃏 3 KPI summary cards – Total KPIs count, MTD Target Met count, and MTD Target Missed count sit at the top of the Summary page so leadership sees the cyber risk posture in 5 seconds.
📥 Excel-driven data source – No DAX coding needed. Fill in 3 worksheets — Input_Actual, Input_Target, and KPI Definition — and the .pbix file refreshes the entire dashboard.
🛡️ Built for cybersecurity teams – Track CISO-level metrics like vulnerability remediation rate, mean time to detect (MTTD), mean time to respond (MTTR), patching SLA compliance, phishing click-through rate, and security awareness training completion.
📦 What’s Inside the Cybersecurity Risk Assessment KPI Dashboard
This template ships as a Power BI .pbix file plus an Excel data source. Below is the page-by-page breakdown of what you get.
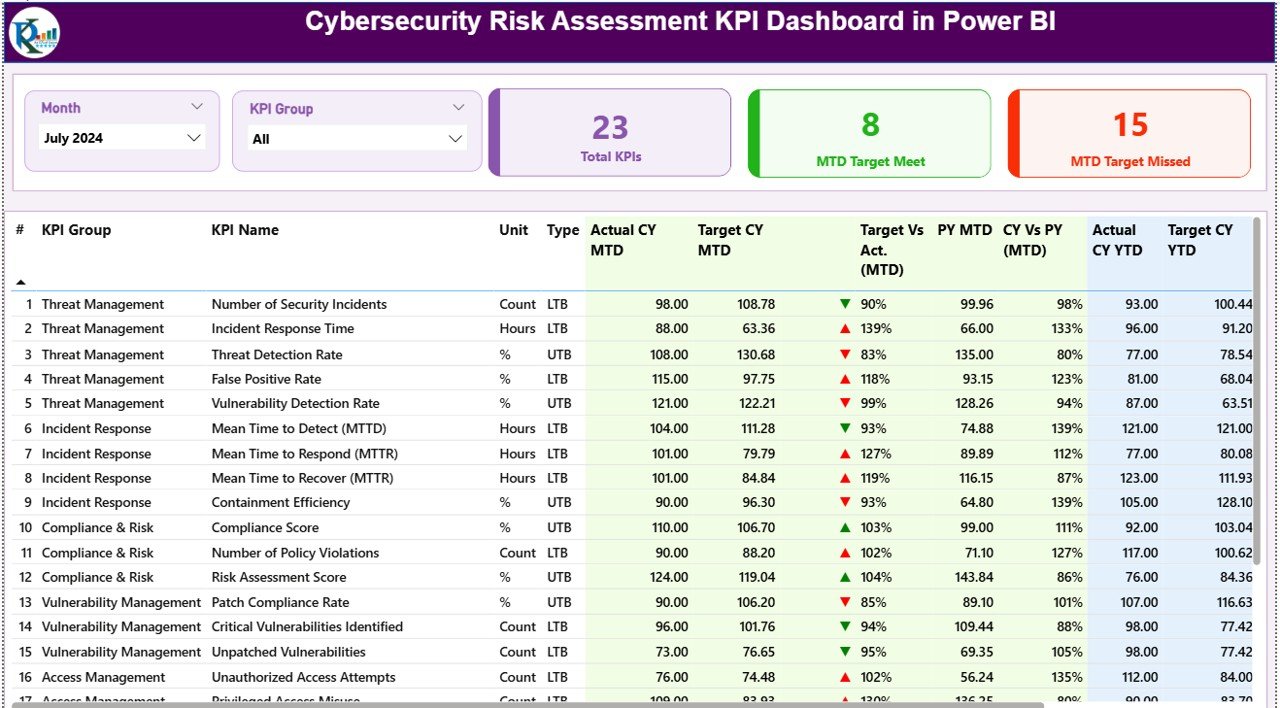
📍 1) Summary Page – the main page of the dashboard. It shows the Month and KPI Group slicer at the top, three cards displaying Total KPIs count, MTD Target Met count, and MTD Target Missed count, and a detailed table with the following columns: KPI Number (sequence number), KPI Group (category), KPI Name, Unit (unit of measurement), Type (LTB or UTB), Actual CY MTD, Target CY MTD, MTD Icon (▼/▲ in red/green), Target Vs Act. (MTD) — calculated as Actual MTD / Target MTD, PY MTD (same period previous year), CY Vs PY (MTD) — calculated as Current Year MTD / Previous Year MTD, Actual CY YTD, Target CY YTD, YTD Icon (▼/▲ in red/green), Target Vs Act. (YTD) — calculated as Actual YTD / Target YTD, PY YTD, and CY Vs PY (YTD) — calculated as Current Year YTD / Previous Year YTD.
Cybersecurity Risk Assessment KPI Dashboard in Power BI
📍 2) KPI Trend Page – this page contains 2 combo charts that show the Actual numbers for the Current Year, Previous Year, and Target numbers for both MTD and YTD. A slicer on the left lets you select any specific KPI name to view its trend in isolation.
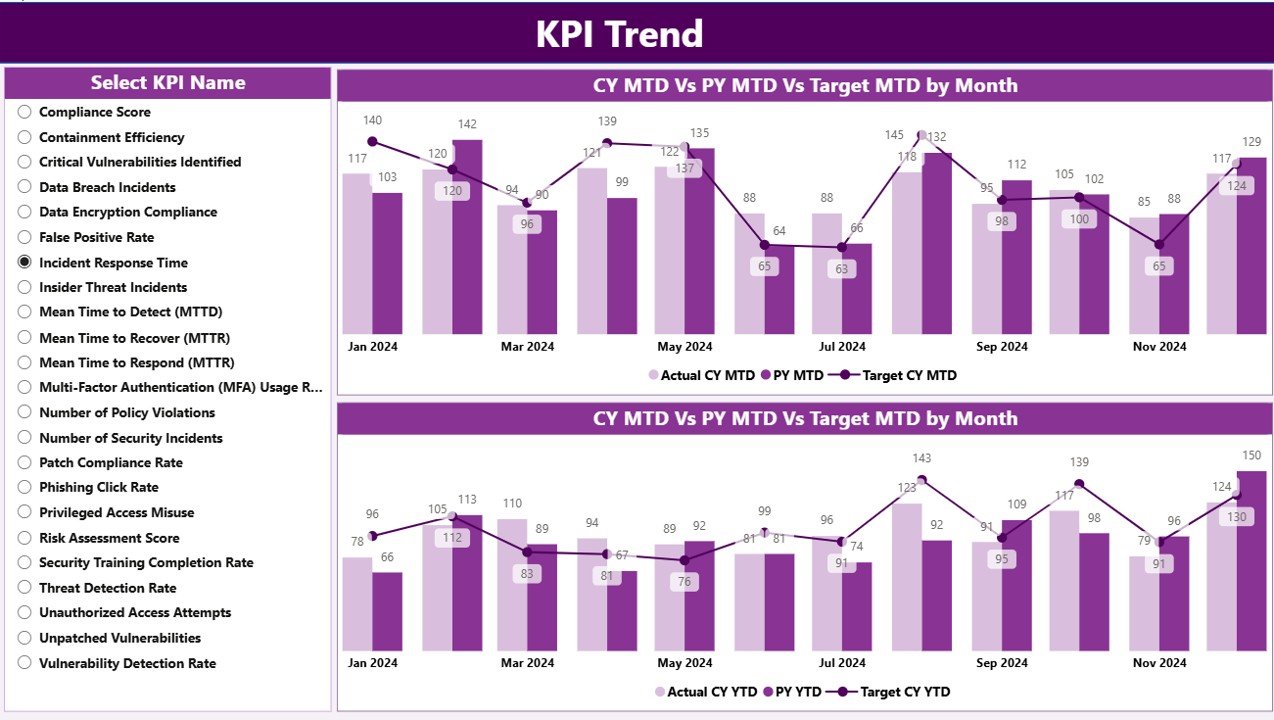
KPI Trend Page
📍 3) KPI Definition Page – this is a drill-through page that has been kept hidden. From the Summary page, right-click any KPI row to drill through and view that KPI’s formula and definition. To return to the main page, click the back button at the top-left corner.
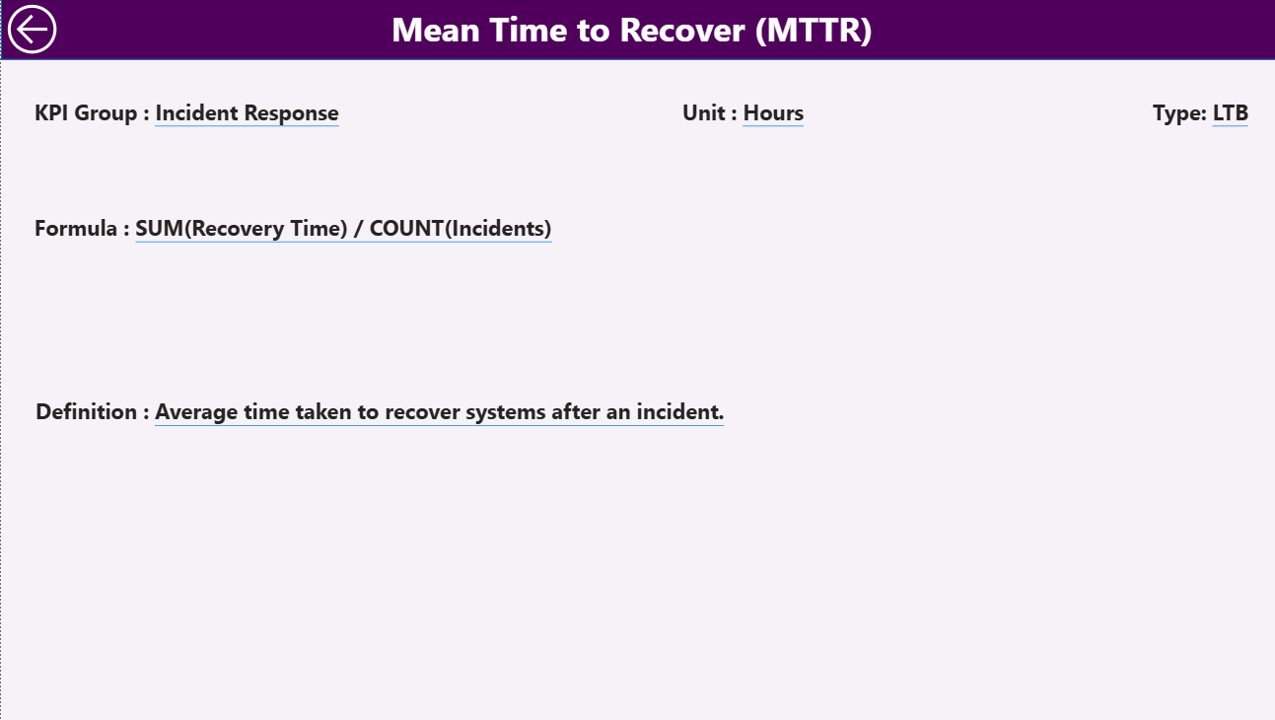
KPI Definition Page
📊 Excel Data Source – the dashboard pulls from an Excel file with 3 worksheets. Input_Actual: fill in the Actual number per KPI Name, Month (use the first date of the month), MTD number, and YTD numbers. Input_Target: fill in the Target number per KPI Name, Month (first date of month), MTD number, and YTD numbers. KPI Definition: fill in KPI Number, KPI Group, KPI Name, Unit, Formula, Definition, and Type (LTB or UTB).
📊 Cybersecurity Risk Assessment Dashboard vs. Tableau Alternative vs. Paid GRC SaaS — Where This Fits
| Feature | This Power BI Dashboard | Tableau / Qlik Equivalent | Paid GRC SaaS (e.g., Vanta, Drata, LogicGate) |
|---|---|---|---|
| Cost | $11.99 one-time | $70–$150 / user / month | $8,000–$80,000 / year |
| Platform | Power BI Desktop (free from Microsoft) | Tableau / Qlik Sense | Browser-only SaaS |
| Setup time | Under 10 minutes — fill 3 Excel tabs | 2–4 hours data modeling | 2–6 weeks onboarding |
| MTD & YTD vs PY comparison | ✅ Built in | Custom calculations needed | ✅ Available |
| Drill-through to KPI definitions | ✅ Hidden page included | Build manually | Limited |
| Custom KPIs (LTB / UTB) | ✅ Just edit the Excel tab | Edit data source + formulas | Restricted to vendor list |
| Data ownership | ✅ Lives on your machine | Server-hosted | Vendor-hosted |
| Year-1 cost at 5 users | $11.99 | $4,200–$9,000 | $8,000–$80,000 |
| Lifetime access | ✅ One-time payment | ❌ Recurring | ❌ Recurring |
For security and risk teams that want CISO-grade KPI tracking without paying $8,000+ per year for GRC SaaS, the Cybersecurity Risk Assessment KPI Dashboard in Power BI sits in the sweet spot.
👥 Who This Template Is For — and Who It’s Not For
✅ This template is built for:
- CISOs and security managers at 20–500 person companies who report monthly cyber risk metrics to the board
- IT directors at SMBs who need a defensible cybersecurity scorecard without a Vanta or Drata subscription
- vCISOs and security consultants who deliver cyber risk reports to multiple clients and want a reusable Power BI template
- Internal audit teams tracking cybersecurity remediation against SLA targets
- Compliance leads preparing for SOC 2, ISO 27001, or NIST CSF assessments who need monthly KPI evidence
❌ This template is NOT for:
- Enterprises that need automated continuous-control monitoring with live API integrations to AWS, Okta, Jira, etc. — those need Vanta or Drata
- Teams without anyone who can edit an Excel file (this is template-driven, not zero-touch)
- SOC analysts who need real-time threat detection — this is a monthly KPI reporting tool, not a SIEM
⚙️ How to Use the Cybersecurity Risk Assessment KPI Dashboard
- Download the .zip file and extract the .pbix and Excel data source.
- Open the Excel file. Fill the KPI Definition tab with your KPI Number, Group, Name, Unit, Formula, Definition, and Type (LTB or UTB).
- Fill the Input_Target tab with monthly target MTD and YTD numbers per KPI (use the first date of the month).
- Fill the Input_Actual tab with monthly actual MTD and YTD numbers per KPI as the year progresses.
- Open the .pbix file in Power BI Desktop (free download from Microsoft) and click Refresh. All 3 pages update.
- Use the Month and KPI Group slicers on the Summary page to filter. Right-click any KPI row to drill through to its definition.
- Publish to the Power BI Service if you want to share with stakeholders, or export to PDF for board packs.
💼 Real-World Use Cases
Marcus runs information security at a 180-person FinTech. Every month he reports 14 cyber risk KPIs to the audit committee. He uses the Cybersecurity Risk Assessment KPI Dashboard in Power BI to track vulnerability remediation rate, MTTD, MTTR, patching SLA, and phishing test failure rate against targets, then exports the Summary page to PDF for the board pack — replacing a $24,000/year Drata subscription his predecessor was about to renew.
Priya is a vCISO serving 11 mid-market clients. She duplicates the .pbix file for each client, swaps the Excel data, and delivers branded monthly cybersecurity KPI scorecards within 30 minutes per client. The drill-through KPI Definition page means she doesn’t have to re-explain what each metric measures every quarter.
Jamal heads internal audit at a 90-person healthcare SaaS company preparing for SOC 2 Type II. He uses the dashboard to track MTD vs Target on 12 control-effectiveness KPIs, and the CY-vs-PY columns let him show the auditor a clear trend line of improving cyber posture year over year — exactly the evidence the auditor wants for CC7-series controls.
❓ Frequently Asked Questions
What KPIs does the Cybersecurity Risk Assessment KPI Dashboard track?
The Cybersecurity Risk Assessment KPI Dashboard in Power BI tracks any cyber risk KPIs you define in the Excel KPI Definition tab — typical examples include vulnerability remediation rate, mean time to detect (MTTD), mean time to respond (MTTR), patching SLA compliance, phishing test failure rate, and security training completion rate.
How does this compare to GRC SaaS like Vanta or Drata?
Vanta and Drata cost $8,000–$80,000 per year and offer continuous monitoring with API integrations. The Cybersecurity Risk Assessment KPI Dashboard in Power BI is a one-time $11.99 purchase for monthly board-style KPI reporting — ideal for teams that already have monitoring tools and just need a reporting layer.
How long does setup take?
Setup of the Cybersecurity Risk Assessment KPI Dashboard takes under 10 minutes if you already have your KPI list and target values ready. You fill 3 Excel tabs (Input_Actual, Input_Target, KPI Definition), open the .pbix in Power BI Desktop, and click Refresh.
Do I need Power BI Pro or just Power BI Desktop?
Power BI Desktop (free from Microsoft) is enough to open and edit the Cybersecurity Risk Assessment KPI Dashboard. Power BI Pro is only needed if you want to publish to the Power BI Service and share live dashboards with colleagues — for PDF exports, free Desktop is sufficient.
Can I add or remove KPIs?
Yes. Add a new row in the KPI Definition tab of the Excel data source, then add corresponding monthly rows in Input_Actual and Input_Target. The Cybersecurity Risk Assessment KPI Dashboard in Power BI will pick up the new KPI automatically on the next refresh — no DAX edits required.
What is LTB vs UTB?
LTB (Lower the Better) applies to KPIs where a lower value is good — for example, MTTR or vulnerability count. UTB (Upper the Better) applies to KPIs where a higher value is good — for example, patching SLA compliance percentage or training completion rate. The dashboard automatically flips the red/green icon logic per KPI type.
Can I rebrand the dashboard with my company colors and logo?
Yes. Open the .pbix file in Power BI Desktop and edit the theme colors, header images, and titles. The Cybersecurity Risk Assessment KPI Dashboard structure stays intact — only visuals are updated.
👤 About the Author
Built by PK — Microsoft Certified Professional with 15+ years of Excel, Google Sheets, and Power BI experience. Founder of NextGenTemplates, reaching 300K+ subscribers across YouTube channels (@PK-AnExcelExpert, @NextGenTemplates, @NeoTechNavigators). Every template is hand-built and tested before release.
🔗 Explore Related Templates
Strengthen your cybersecurity reporting stack with these companion templates from our Power BI KPI Dashboard collection:
- 🛡️ Security Dashboard in Power BI — broader security operations view with incident and threat metrics.
- 🔍 IT Security Auditing KPI Dashboard in Power BI — control-effectiveness scorecard for audit teams.
- 🚨 Cybersecurity Incident KPI Dashboard in Google Sheets — Google Sheets variant for cloud-first teams.
- 📊 Cybersecurity KPI Scorecard in Google Sheets — lightweight monthly scorecard format.
Browse the full Power BI Templates library for more dashboards.
📖 Click here to read the Detailed Blog Post
🎥 Visit our YouTube channel for step-by-step video tutorials
👉 YouTube.com/@NextGenTemplates
📅 Last updated: April 2026


Reviews
There are no reviews yet.