

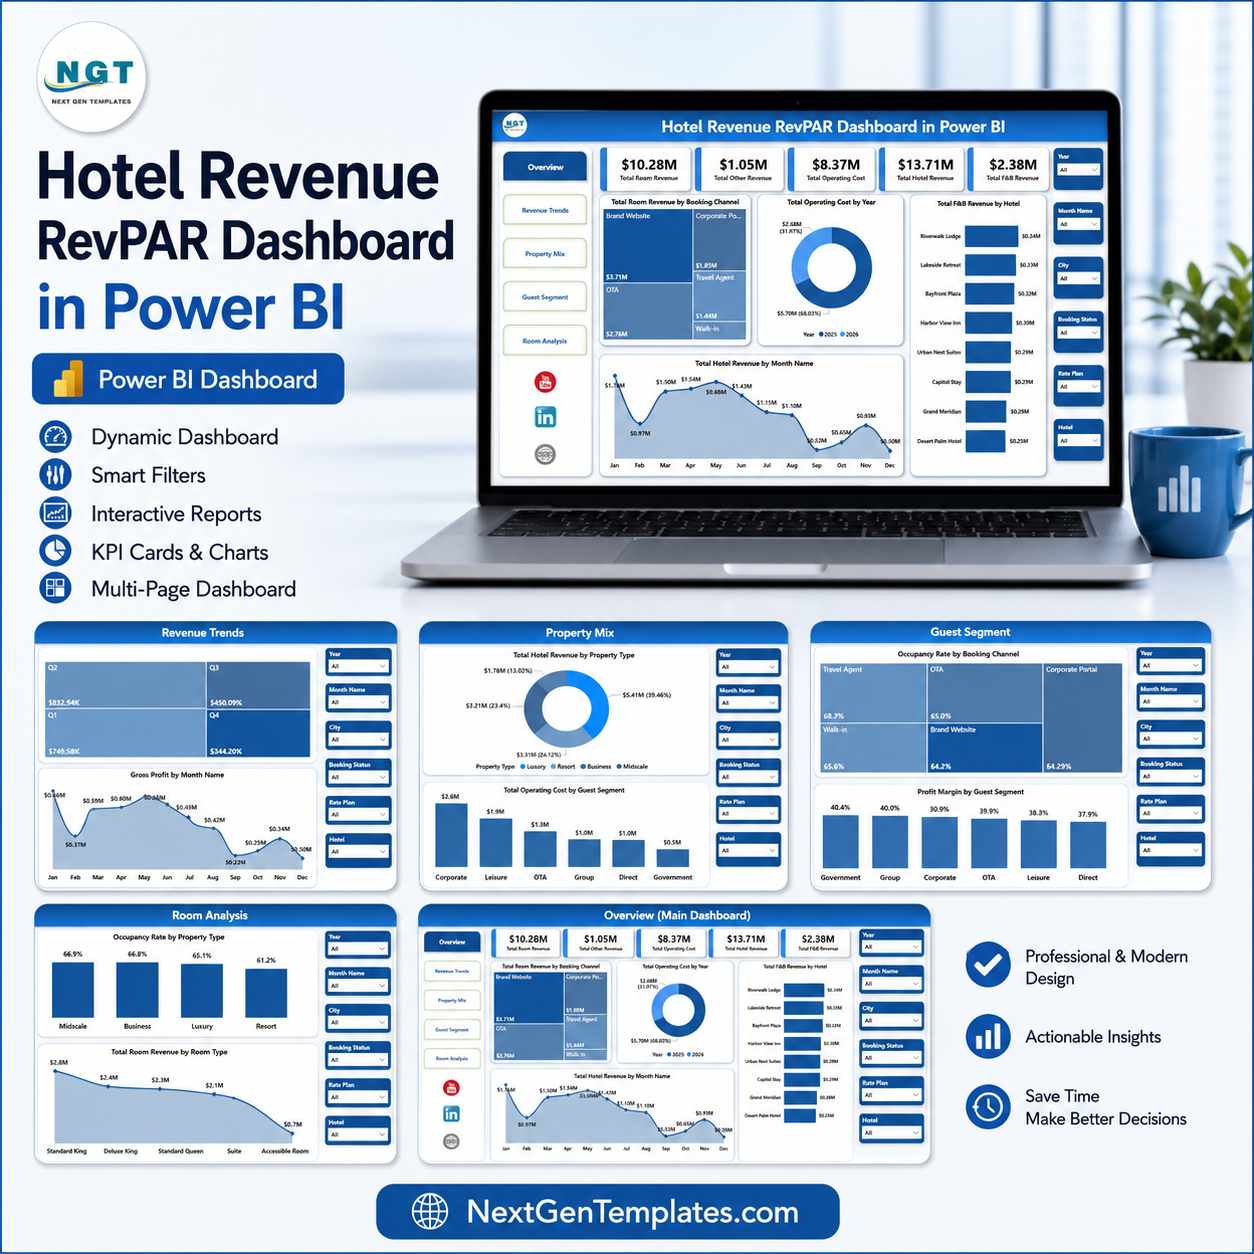

Hotel Revenue RevPAR Dashboard in Power BI helps hotel owners, revenue managers, finance teams, F&B managers, and hospitality analysts review room revenue, other revenue, operating cost, total hotel revenue, F&B revenue, occupancy, profit margin, guest segment performance, booking channels, rate plans, and room mix in one editable PBIX report. Hotels depend on RevPAR-style analysis, occupancy visibility, channel mix, room revenue, and profit movement to make pricing and operating decisions. This template gives you a one-time purchase reporting layer with instant download, editable Power BI pages, slicers, KPI cards, and charts instead of starting from a blank report.
Open the PBIX file in Power BI Desktop, replace the sample data with your own structured hotel data, refresh the model, and use slicers to filter by property, region, booking channel, guest segment, room type, month, quarter, or rate plan.
Key Features of Hotel Revenue RevPAR Dashboard in Power BI
- 5 Power BI report pages: Overview, Revenue Trends, Property Mix, Guest Segment, and Room Analysis.
- Executive cards: Total Room Revenue, Total Other Revenue, Total Operating Cost, Total Hotel Revenue, and Total F&B Revenue.
- Revenue trend analysis: Review F&B revenue, gross profit, hotel revenue, room revenue, and monthly movement.
- Property and region mix: Compare hotel revenue by property type and operating cost by region or guest segment.
- Guest segment insights: Analyze occupancy rate, profit margin, booking channels, guest segments, and rate plans.
- Room analysis: Review occupancy by property type, room revenue by room type, and available rooms by hotel.
- Interactive slicers: Filter the dashboard quickly during revenue, operations, ownership, and finance meetings.
- Editable PBIX file: Customize pages, visuals, fields, measures, colors, and source connections.
What’s Inside the Hotel Revenue RevPAR Dashboard in Power BI
1. Overview Page
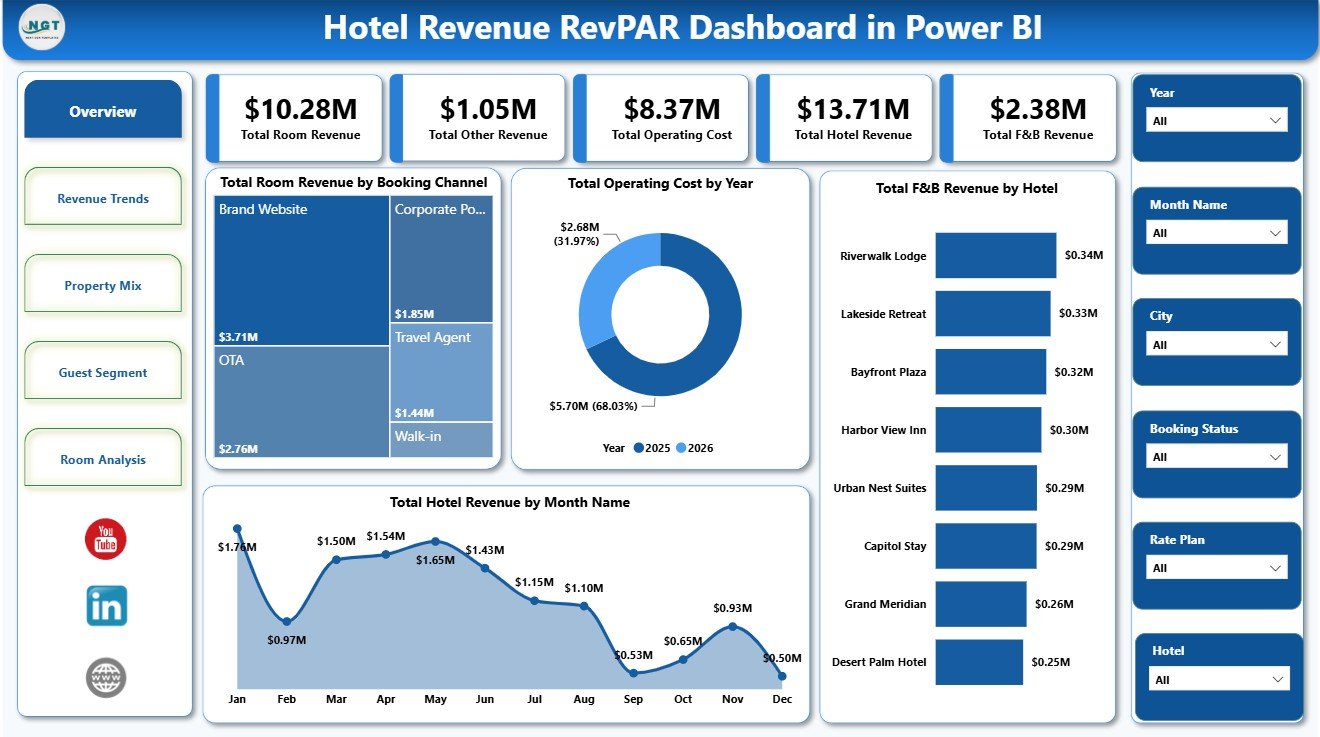
The Overview page gives leadership a high-level view of hotel performance. The top cards show Total Room Revenue, Total Other Revenue, Total Operating Cost, Total Hotel Revenue, and Total F&B Revenue.
Total Room Revenue by Booking Channel: This chart compares room revenue across direct, OTA, corporate, travel agent, and other booking channels. It helps revenue managers identify channels that drive stronger room income.
Total Operating Cost by Year: This chart shows operating cost movement by year. It helps finance teams review whether cost pressure is increasing and where additional investigation may be needed.
Total F&B Revenue by Hotel: This visual compares food and beverage revenue by hotel. It helps operators see which properties are producing stronger restaurant, banquet, and service revenue.
Total Hotel Revenue by Month Name: This chart tracks monthly hotel revenue. It helps teams spot seasonality, peak demand periods, and months that need pricing or marketing support.
Hotel Revenue RevPAR Dashboard in Power BI
2. Revenue Trends
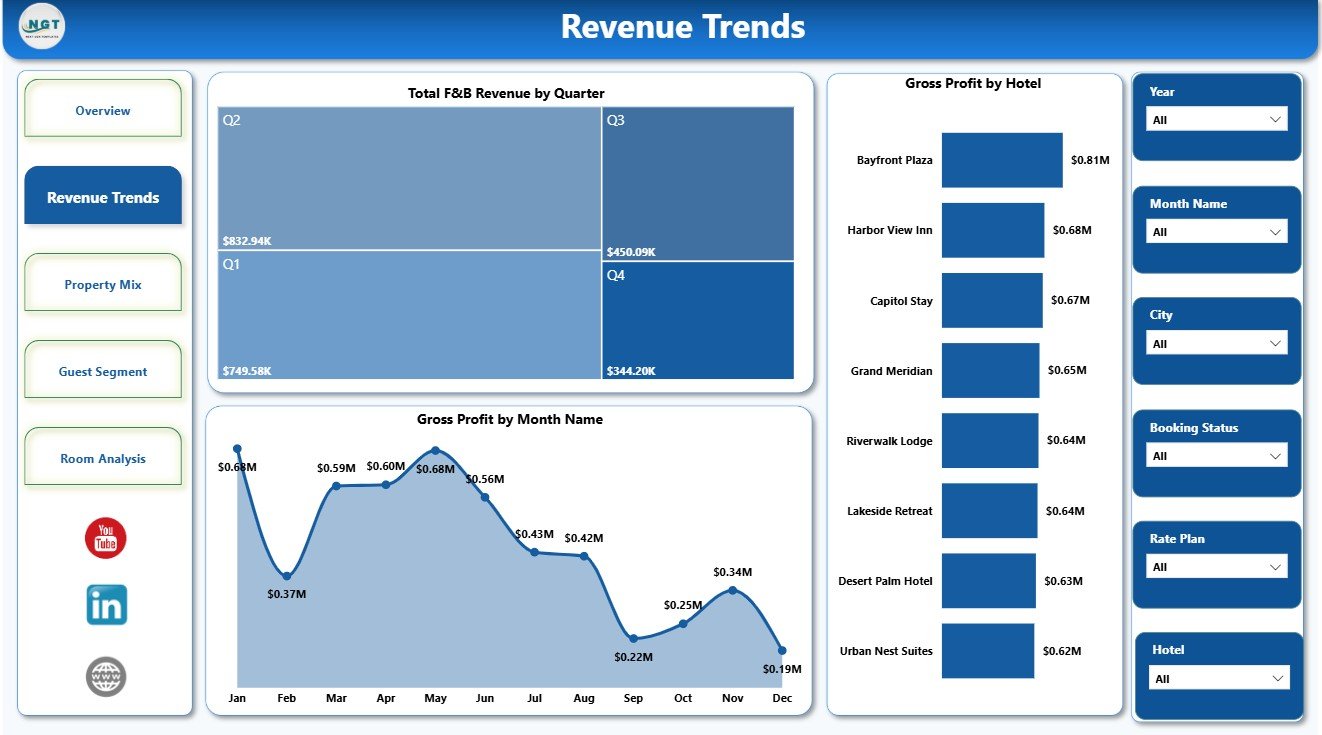
The Revenue Trends page focuses on financial movement across quarters, months, and hotels. It helps revenue and finance teams understand how F&B revenue and gross profit are changing over time and across properties.
Total F&B Revenue by Quarter: This chart compares food and beverage revenue by quarter. It is useful for seasonal planning, event strategy, and restaurant performance review.
Gross Profit by Month Name: This chart tracks gross profit by month. It helps managers connect revenue performance with cost control and identify stronger or weaker months.
Gross Profit by Hotel: This visual compares gross profit across hotels. It helps owners and regional managers see which properties are contributing the most after direct costs.
Revenue Trends
3. Property Mix
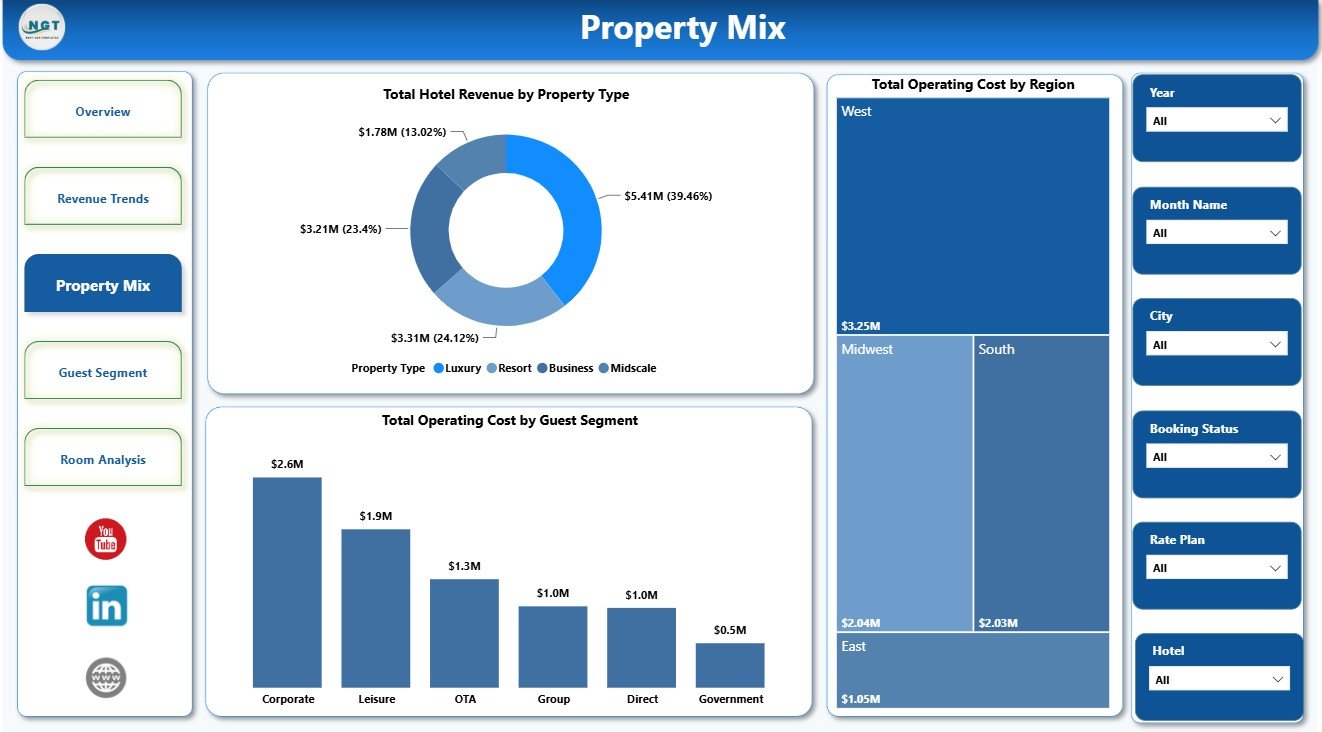
The Property Mix page explains how revenue and cost differ by property type, region, and guest segment. It is useful for multi-property hotel groups, boutique chains, and hospitality analysts.
Total Hotel Revenue by Property Type: This chart compares revenue by property category. It helps teams see whether resort, business, boutique, airport, or other property types are driving the strongest contribution.
Total Operating Cost by Region: This chart compares operating cost across regions. It helps finance teams identify regional cost patterns and review where budgets need closer control.
Total Operating Cost by Guest Segment: This visual links cost with guest segment. It helps managers understand whether corporate, leisure, group, or other guest types carry different operating-cost profiles.
Property Mix
4. Guest Segment
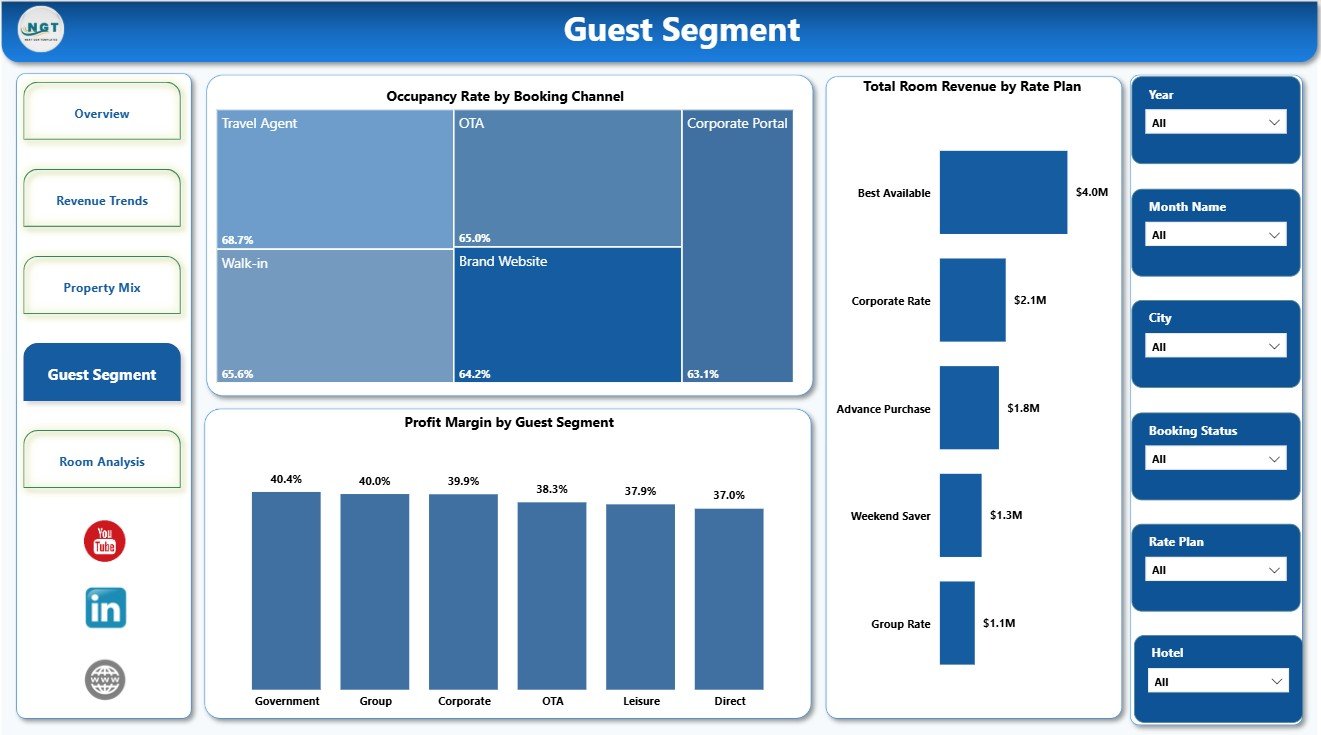
The Guest Segment page helps hotel teams understand demand quality by channel, segment, and rate plan. It is useful for pricing reviews, sales strategy, and marketing planning.
Occupancy Rate by Booking Channel: This chart compares occupancy by booking channel. It helps identify which channels fill rooms more effectively and which may need pricing or promotion changes.
Profit Margin by Guest Segment: This visual compares margin by segment. It helps teams understand whether leisure, corporate, group, or other guest types produce healthier profitability.
Total Room Revenue by Rate Plan: This chart shows room revenue by rate plan. It helps revenue managers review package, flexible, corporate, and promotional rate performance.
Guest Segment
5. Room Analysis
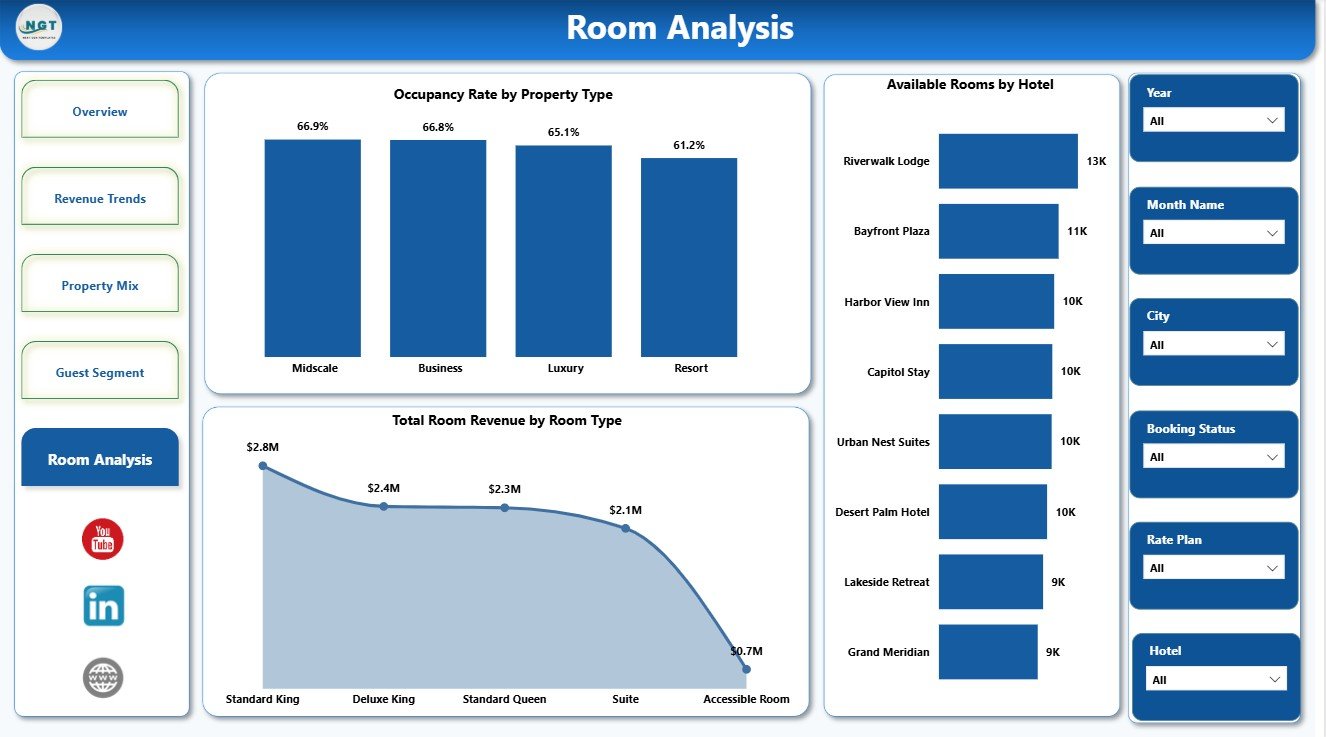
The Room Analysis page connects occupancy, room type performance, and available room capacity. It helps hotel teams review room inventory, room category demand, and property-level availability.
Occupancy Rate by Property Type: This chart compares occupancy rate across property types. It helps teams see where demand is strongest and where room inventory may be underused.
Total Room Revenue by Room Type: This visual compares room revenue by room category. It helps revenue managers understand which room types contribute the most to room revenue.
Available Rooms by Hotel: This chart compares room availability by hotel. It helps operators review capacity distribution across properties and support occupancy planning.
Room Analysis
Hotel Revenue RevPAR Dashboard in Power BI vs. Tableau vs. Paid Hotel SaaS – Where This Fits
| Feature | This Power BI dashboard | Tableau or Qlik alternative | Paid hotel SaaS |
|---|---|---|---|
| Cost | $17.99 one-time template purchase | BI license plus dashboard build time | Monthly or annual subscription |
| Platform | Power BI Desktop and optional Power BI Service | Tableau or Qlik environment | Vendor cloud platform |
| Setup time | Open PBIX, replace data, refresh | Build model, measures, visuals, and pages | Implementation and onboarding |
| Customizable fields | Editable report pages, measures, slicers, and source connections | Editable with BI skills | Limited by vendor configuration |
| Year-1 cost at 5 users | $17.99 plus Microsoft licensing | Usually higher once licenses and build time are included | Often hundreds or thousands per year |
| Hotel revenue focus | Pre-built for RevPAR-style revenue, occupancy, F&B, room, cost, property, and guest analysis | Requires custom design | Depends on vendor reporting module |
Who This Template Is For – and Who It’s Not For
This dashboard is for hotel owners, general managers, revenue managers, finance analysts, F&B managers, regional managers, hospitality consultants, and Power BI users who already have structured hotel revenue and operations data.
It is not a hotel property management system, booking engine, channel manager, POS system, accounting system, payment tool, or live guest CRM. Use it as a reporting layer after your hotel data has been exported, connected, cleaned, or prepared for Power BI.
How to Use the Hotel Revenue RevPAR Dashboard in Power BI
- Download and unzip the file after purchase.
- Open the PBIX file in Power BI Desktop.
- Replace the sample data or connect your approved hotel data source.
- Refresh the report so cards, charts, and slicers update.
- Use slicers to filter by hotel, property type, region, month, quarter, guest segment, room type, booking channel, or rate plan.
- Customize visuals, labels, colors, pages, fields, and measures as needed.
Real-World Use Cases
Anita, Hotel Revenue Manager: Anita reviews booking channel revenue, monthly hotel revenue, occupancy rate, and rate plan performance before weekly pricing meetings.
Rahul, Regional Hotel Director: Rahul uses Property Mix and Room Analysis to compare revenue, operating cost, room revenue, and available rooms across hotels and regions.
Maria, Hospitality Finance Analyst: Maria uses Revenue Trends to review gross profit, F&B revenue, and hotel-level performance before monthly owner reporting.
Frequently Asked Questions
What pages are included?
The PBIX report includes Overview, Revenue Trends, Property Mix, Guest Segment, and Room Analysis pages.
Which KPI cards are shown on the Overview page?
The Overview page includes Total Room Revenue, Total Other Revenue, Total Operating Cost, Total Hotel Revenue, and Total F&B Revenue.
Do I need Power BI Desktop?
Yes. Power BI Desktop is required to open, edit, and refresh the PBIX file.
Can I use my own hotel data?
Yes. Replace the sample source or connect your approved structured hotel data, then refresh the report.
Can I customize the report?
Yes. You can edit visuals, fields, measures, slicers, colors, labels, and pages in Power BI Desktop.
Is this a booking or PMS system?
No. This is a Power BI reporting dashboard, not a reservation, PMS, payment, POS, accounting, or guest CRM system.
About the Author
Built by PK – Microsoft Certified Professional with 15+ years of Excel, Google Sheets, and Power BI experience. Founder of NextGenTemplates, reaching 300K+ subscribers across YouTube channels. Every template is hand-built and tested before release.
Explore Related Templates
Browse more Power BI templates and Power BI Dashboard templates. You may also like Eco Lodges Dashboard in Power BI, Hospitality Dashboard in Power BI, Destination Management Companies Dashboard in Power BI, and Adventure Tourism Dashboard in Power BI.
Ready to review hotel revenue and RevPAR-style performance in Power BI? Download the Hotel Revenue RevPAR Dashboard in Power BI, connect your data, refresh the report, and start analyzing revenue, occupancy, F&B, rooms, costs, channels, and guest segments today.
Last updated: July 22, 2026.
Watch the demo video:
Compatibility and Requirements
- Works in Power BI Desktop, which is free. The PBIX file needs Power BI Desktop to open, edit and refresh.
- Microsoft explains how to install it in Get Power BI Desktop.
More Questions About This Template
Which pages does the report have?
Five pages: Overview, Revenue Trends, Property Mix, Guest Segment and Room Analysis.
Can I filter by booking channel or property type?
Yes. Slicers let you filter by hotel, property type, region, month, quarter, guest segment, room type, booking channel or rate plan.
Can I use my own hotel data?
Yes. Replace the sample data or connect your own structured hotel data, then refresh the report in Power BI Desktop.
Is there an Excel version?
Yes. See the Hotel Revenue RevPAR Dashboard in Excel.
Related Hotel and Revenue Templates
- Hotel Revenue RevPAR Dashboard in Excel: the same RevPAR dashboard in Excel
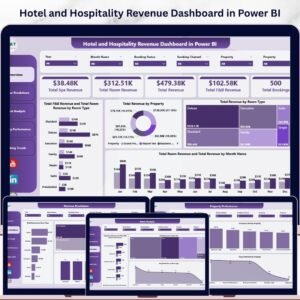
- Hotel and Hospitality Revenue Dashboard in Power BI: another hotel revenue report in Power BI
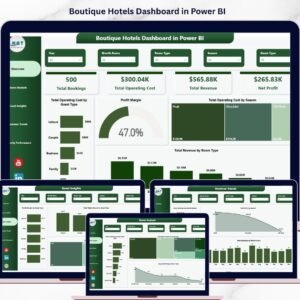
- Boutique Hotels Dashboard in Power BI: a Power BI view for boutique properties
- Revenue Analysis Dashboard in Power BI: general revenue analysis in Power BI
- Power BI Dashboard Mega Collection: 15 Power BI templates in one download
Browse all Power BI dashboards.





























Reviews
There are no reviews yet.