


Gift Shops Dashboard in Excel gives gift shop owners, retail managers, store supervisors, and analysts a ready-to-use Excel reporting workbook for tracking revenue, cost, net profit, transactions, quantity, customer rating, returns, product mix, store performance, and customer behavior. Retail teams often lose hours each month preparing manual sales summaries, but this template turns transaction data into visual insights across 5 dashboard pages, 5 KPI cards, slicers, charts, a Data sheet, and a pivot-powered Support sheet.
Replace the sample rows with your own gift shop records, click Data > Refresh All, and the dashboard refreshes automatically. Because it is built in Microsoft Excel, you get an editable one-time purchase workflow without a monthly SaaS subscription.
Key Features of Gift Shops Dashboard in Excel
- 5-page Excel dashboard covering Overview, Sales Trend, Product Mix, Store View, and Customer View.
- Executive KPI cards for Total Revenue, Net Profit, Total Transactions, Total Quantity, and Avg. Customer Rating.
- Interactive slicers to filter the dashboard quickly by the available fields in your data.
- 20 chart views for revenue, cost, completion percentage, profit margin, returns, ratings, stores, regions, customer types, and channels.
- Editable Data sheet where you add gift shop transaction data in the same sample format.
- Support sheet with pivot tables so every dashboard page can update dynamically after Refresh All.
- Excel-native reporting with no separate BI software, login system, or recurring subscription required.
What’s Inside the Gift Shops Dashboard in Excel
1. Overview Page
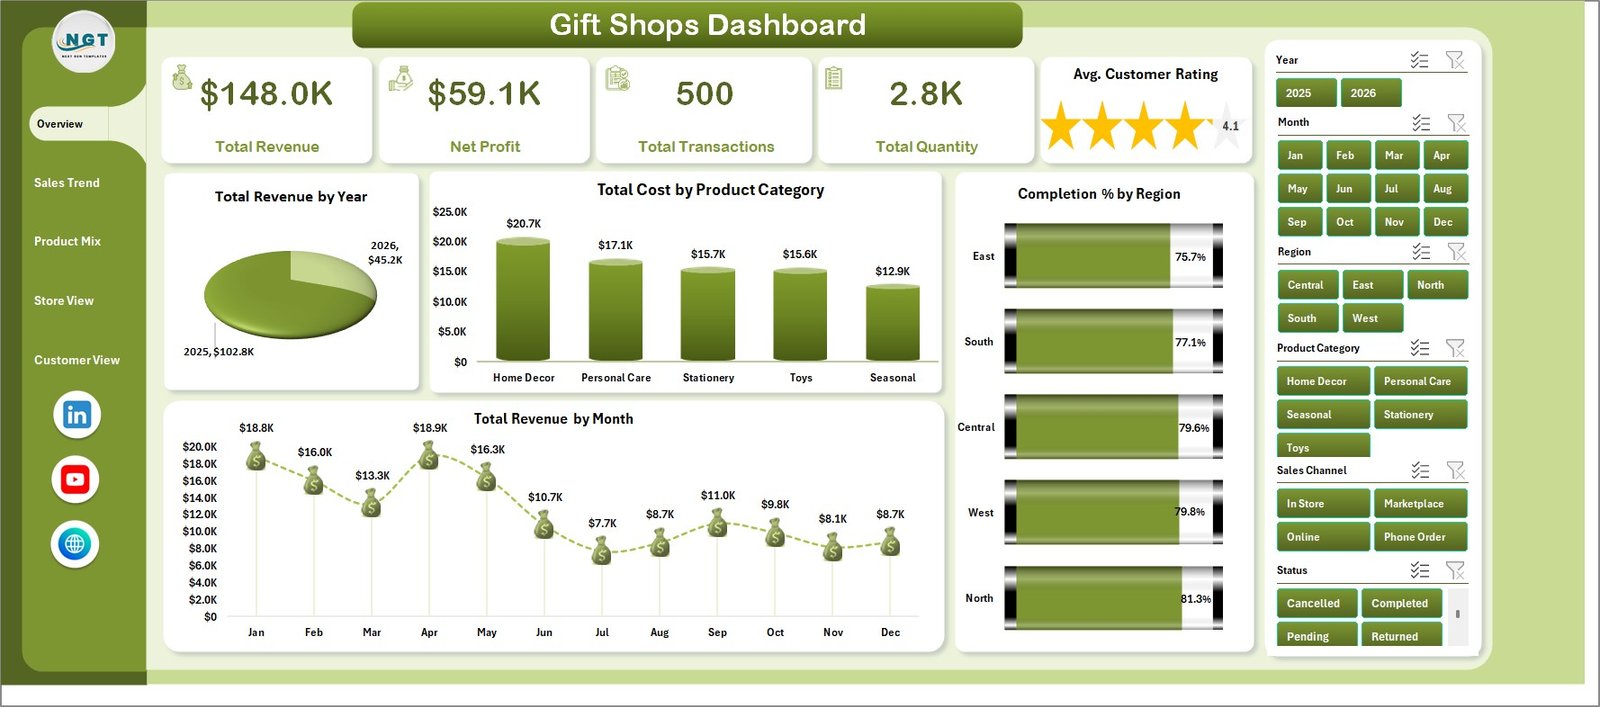
The Overview page provides high-level cards for Total Revenue, Net Profit, Total Transactions, Total Quantity, and Avg. Customer Rating. It also includes slicers and charts for Total Revenue by Year, Total Cost by Product Category, Completion % by Region, and Total Revenue by Month.
Total Revenue by Year helps you compare annual sales performance. Total Cost by Product Category shows which gift categories consume the highest cost. Completion % by Region highlights regional fulfillment performance. Total Revenue by Month reveals seasonal demand, holiday spikes, and slower periods.
Gift Shops Dashboard in Excel
2. Sales Trend
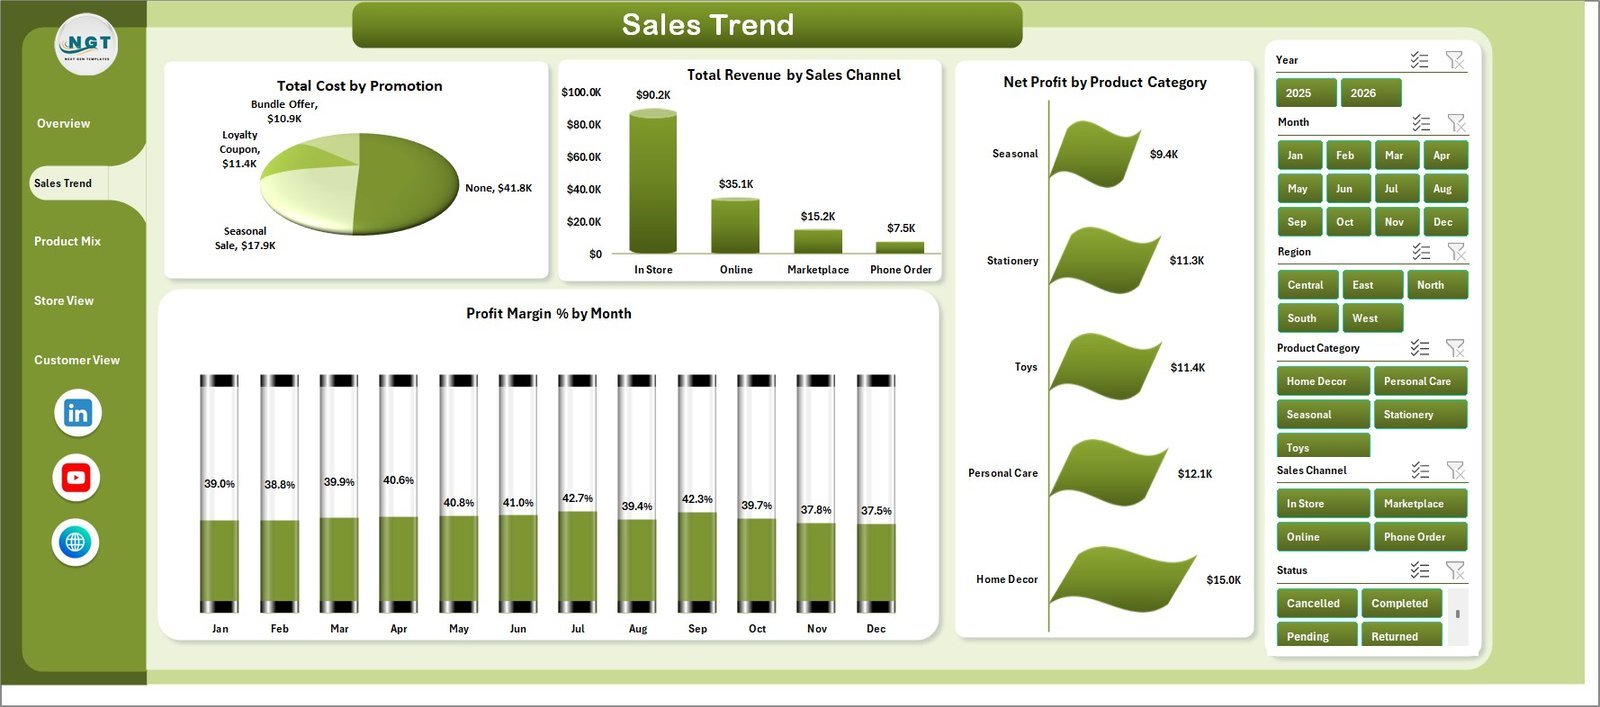
The Sales Trend page includes Total Cost by Promotion, Total Revenue by Sales Channel, Net Profit by Product Category, and Profit Margin % by Month. It helps you understand which promotions, channels, and categories are creating profitable growth instead of only higher sales volume.
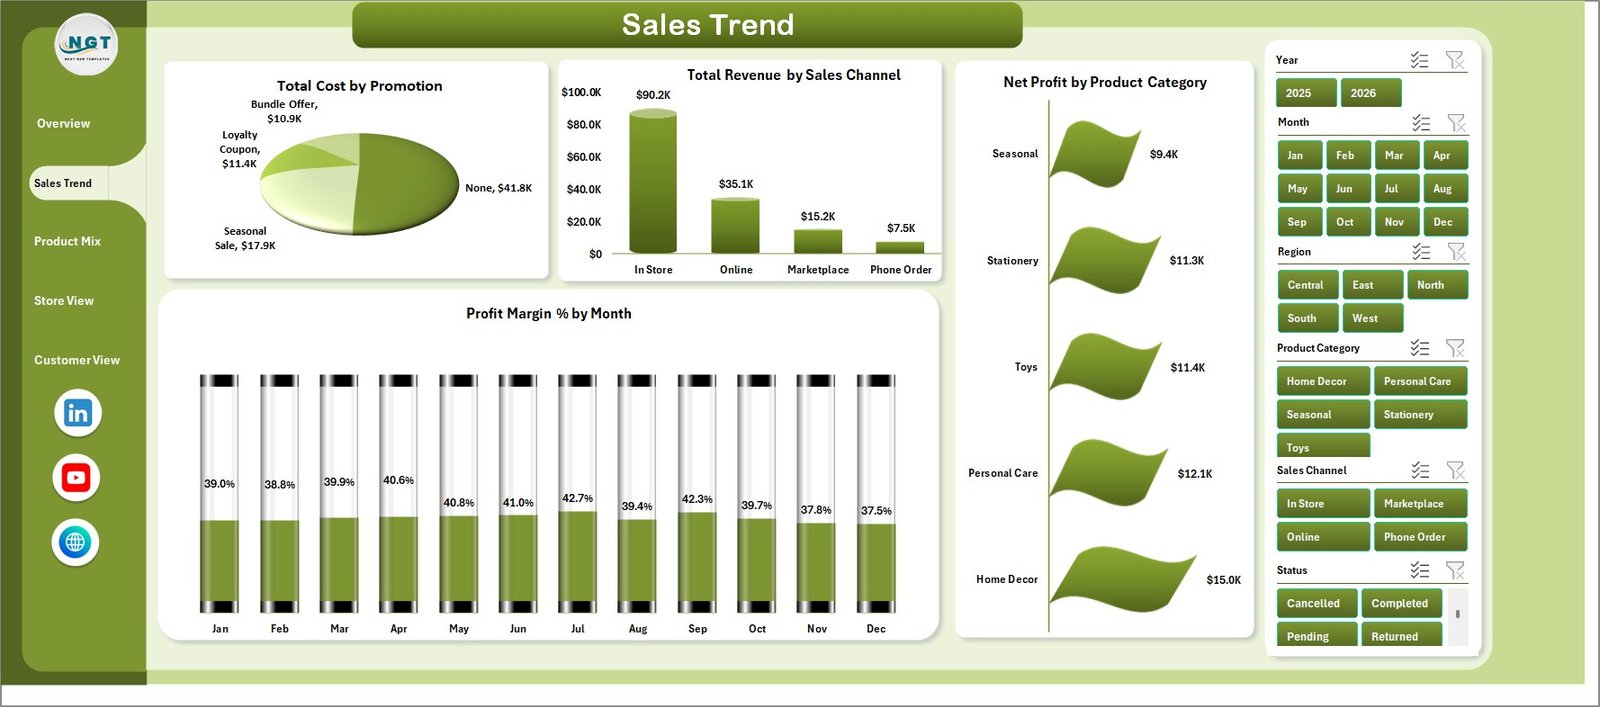
Sales Trend
3. Product Mix
The Product Mix page includes Profit Margin % by Product, Net Profit by Product, Return % by Product Category, and Total Revenue by Store. Use it to identify top-selling products, products with margin pressure, and categories where returns may need attention.
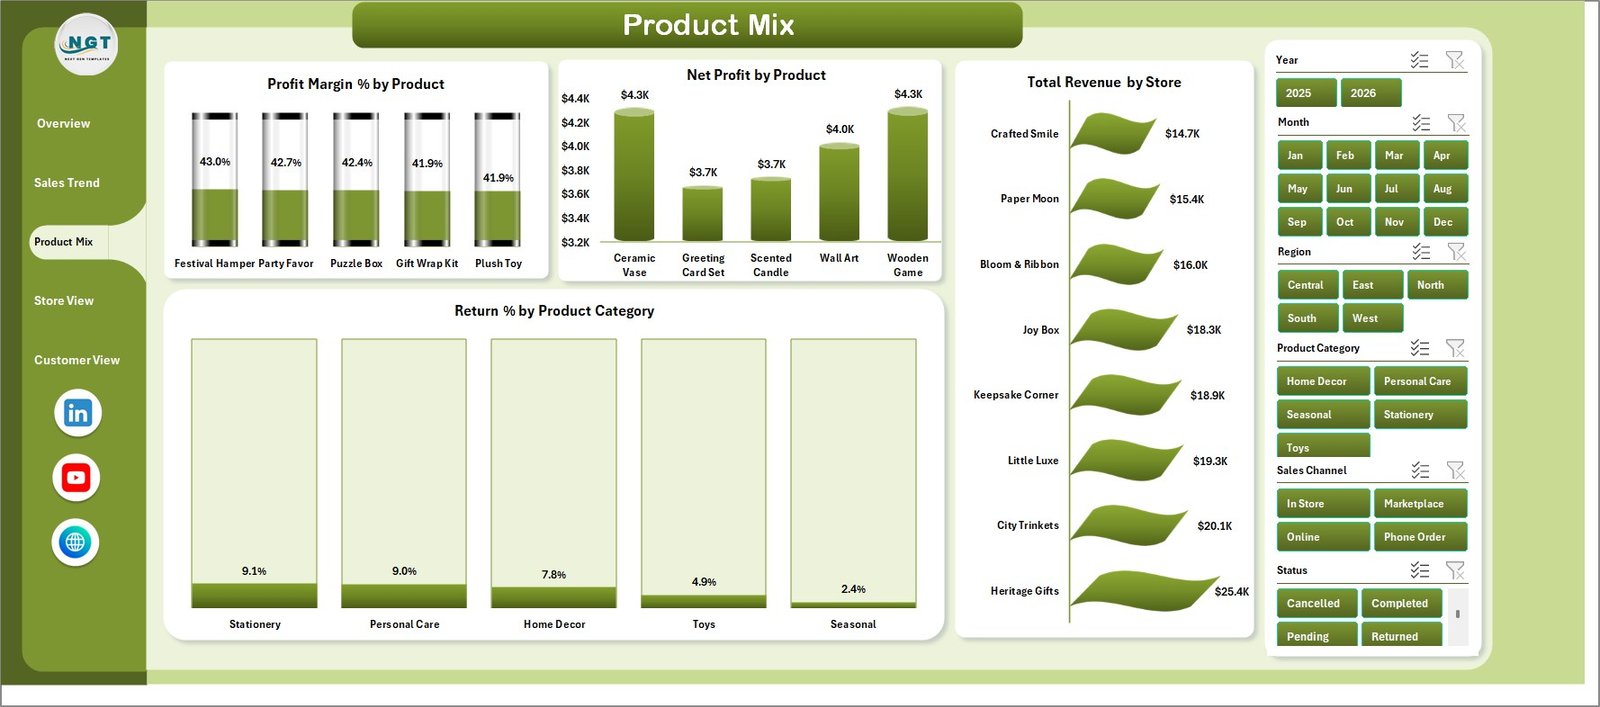
Product Mix
4. Store View
The Store View page includes Profit Margin % by Region, Total Revenue by City, Total Revenue by Customer Type, and Avg. Customer Rating by Store. This page is useful for comparing store locations, city-level revenue, and customer satisfaction by branch.
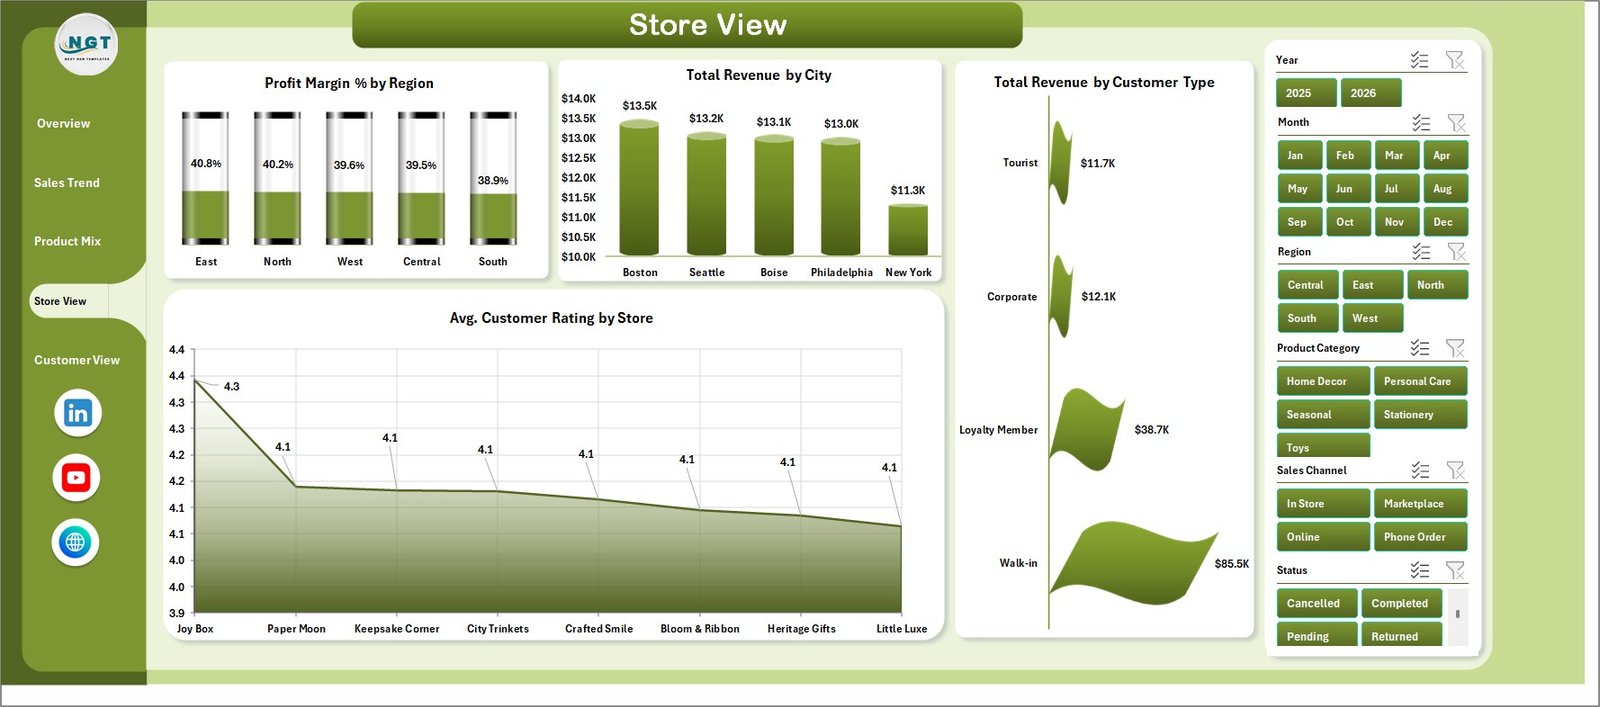
Store View
5. Customer View
The Customer View page includes Avg. Customer Rating by Customer Type, Total Transactions by Status, Profit Margin % by Customer Type, and Return % by Sales Channel. It connects customer segments, order status, sales channel, margin, and returns in one view.
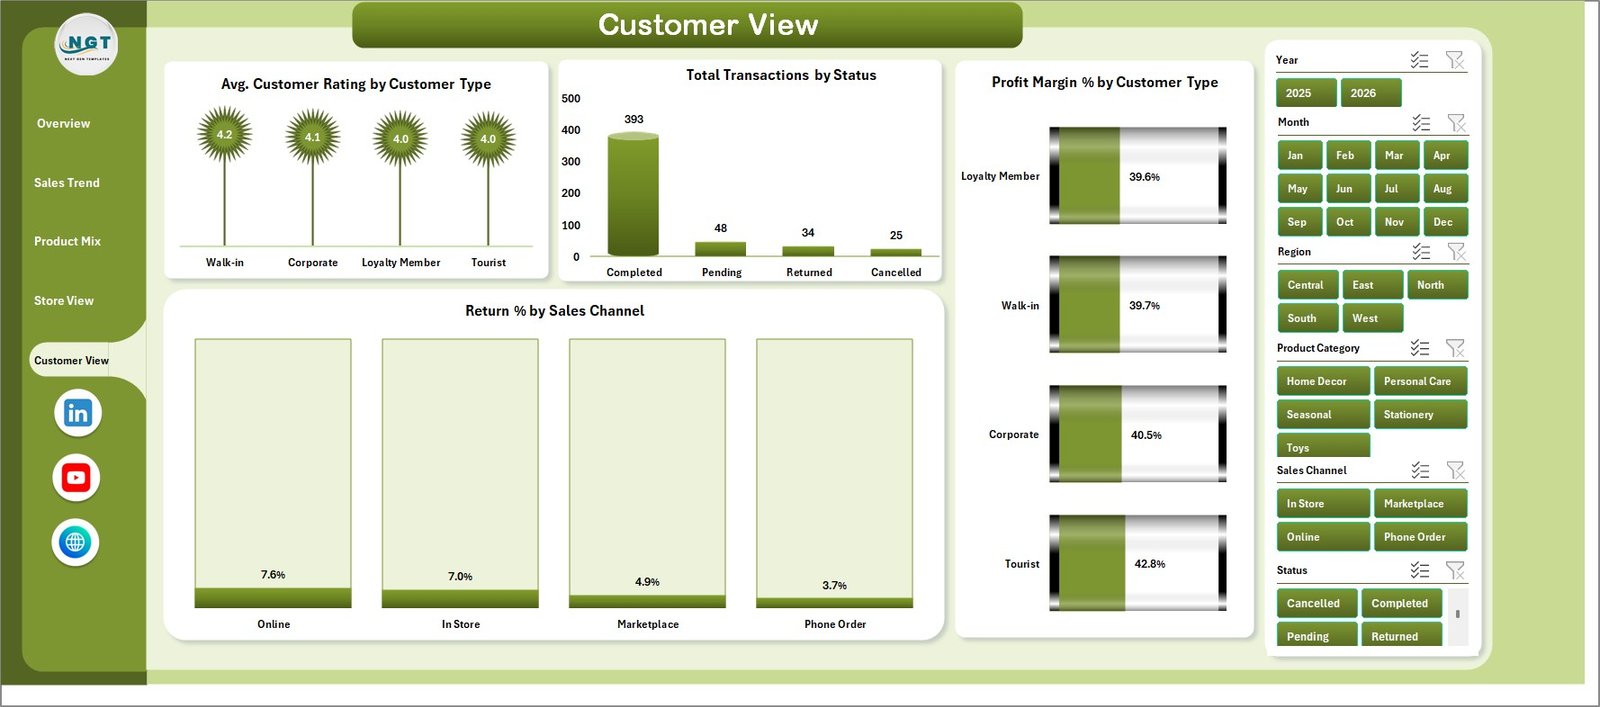
Customer View
6. Data Sheet Tab
The Data sheet is where you add your own records in the same format as the sample data. Keep the column headers and structure consistent so the pivot tables and dashboard visuals refresh correctly.
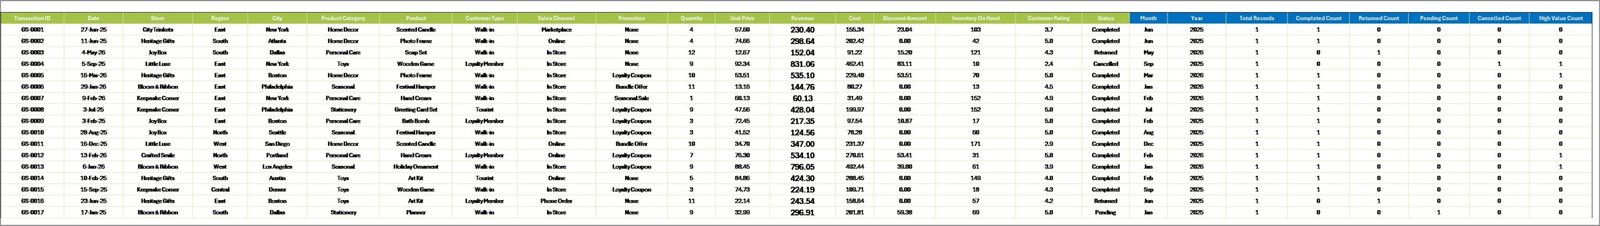
Data Sheet tab
7. Support Sheet
The Support sheet contains the pivot tables used to create the dashboard dynamically. After updating the Data sheet, go to the Data tab in the Excel ribbon and click Refresh All. You can keep this sheet hidden during normal use.
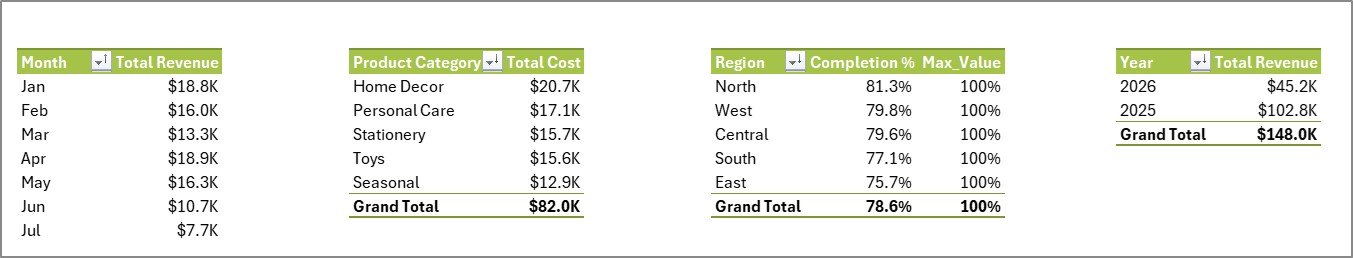
Support sheet tab
Gift Shops Dashboard in Excel vs. Google Sheets vs. Paid Retail SaaS – Where This Fits
| Feature | Gift Shops Dashboard in Excel | Google Sheets alternative | Paid retail SaaS |
|---|---|---|---|
| Cost | $17.99 one-time | Low one-time or free template cost | Monthly or annual subscription |
| Platform | Microsoft Excel | Browser-based spreadsheet | Vendor cloud platform |
| Setup time | Under 10 minutes | Under 15 minutes | Days or weeks |
| Offline access | Yes | Limited | No |
| Gift shop product mix analysis | Pre-built | May need formulas | Depends on plan and setup |
| Year-1 cost at 5 users | $17.99 total | Low fixed cost | Often hundreds or thousands of dollars |
Who This Template Is For – and Who It’s Not For
Best for: independent gift shops, souvenir stores, boutique retail stores, store managers, regional managers, finance teams, and retail analysts who need a clear Excel dashboard for sales and profitability reporting.
Not for: teams that need live POS API sync, barcode inventory automation, user-level permissions, enterprise accounting integration, or mobile-first order processing.
How to Use the Gift Shops Dashboard in Excel
- Download and unzip the file.
- Open the workbook in Microsoft Excel.
- Go to the Data sheet and replace the sample records with your own gift shop data.
- Keep the same column names and data format.
- Click Data > Refresh All in the Excel ribbon.
- Use slicers to filter by store, region, product category, channel, customer type, or other available fields.
- Review the dashboard pages and export reports if needed.
Real-World Use Cases
Maya, a gift shop owner, uses Total Revenue by Month to prepare for seasonal gift buying periods and holiday stock planning.
Daniel, a regional retail manager, reviews Profit Margin % by Region and Avg. Customer Rating by Store to compare branch performance.
Sophia, a retail analyst, studies Return % by Product Category and Profit Margin % by Product to recommend better merchandising decisions.
Frequently Asked Questions
What does the Gift Shops Dashboard in Excel track?
It tracks revenue, net profit, transactions, quantity, customer rating, costs, product categories, promotions, sales channels, regions, cities, stores, returns, customer types, and order status.
Do I need advanced Excel skills?
No. The workbook is already built. You only need to replace the sample data and click Refresh All.
Can I customize the dashboard?
Yes. You can edit charts, colors, labels, formulas, pivot tables, and workbook layout because this is a standard Excel file.
Can I use this for multiple gift shop locations?
Yes. The Store View and region/city charts are designed to help compare performance across locations.
Can I hide the Support sheet?
Yes. The Support sheet contains backend pivot tables and can be hidden after setup.
Is this a subscription?
No. It is a one-time purchase with lifetime access to the downloaded file.
About the Author
Built by PK – Microsoft Certified Professional with 15+ years of Excel, Google Sheets, and Power BI experience. Founder of NextGenTemplates, reaching 300K+ subscribers across YouTube channels. Every template is hand-built and tested before release.
Explore Related Templates
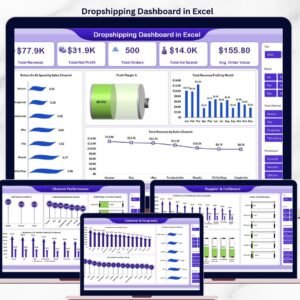
Pair this file with Discount Stores Dashboard in Excel, Outlet Stores Dashboard in Excel, Baby Products Retail Dashboard in Excel, Dropshipping Dashboard in Excel, or browse the Excel Dashboard Templates category.
Click here to read the detailed blog post
Download the Gift Shops Dashboard in Excel today and start tracking gift shop sales, products, stores, and customers with a clean Excel workbook.
Last updated: June 2026


Reviews
There are no reviews yet.