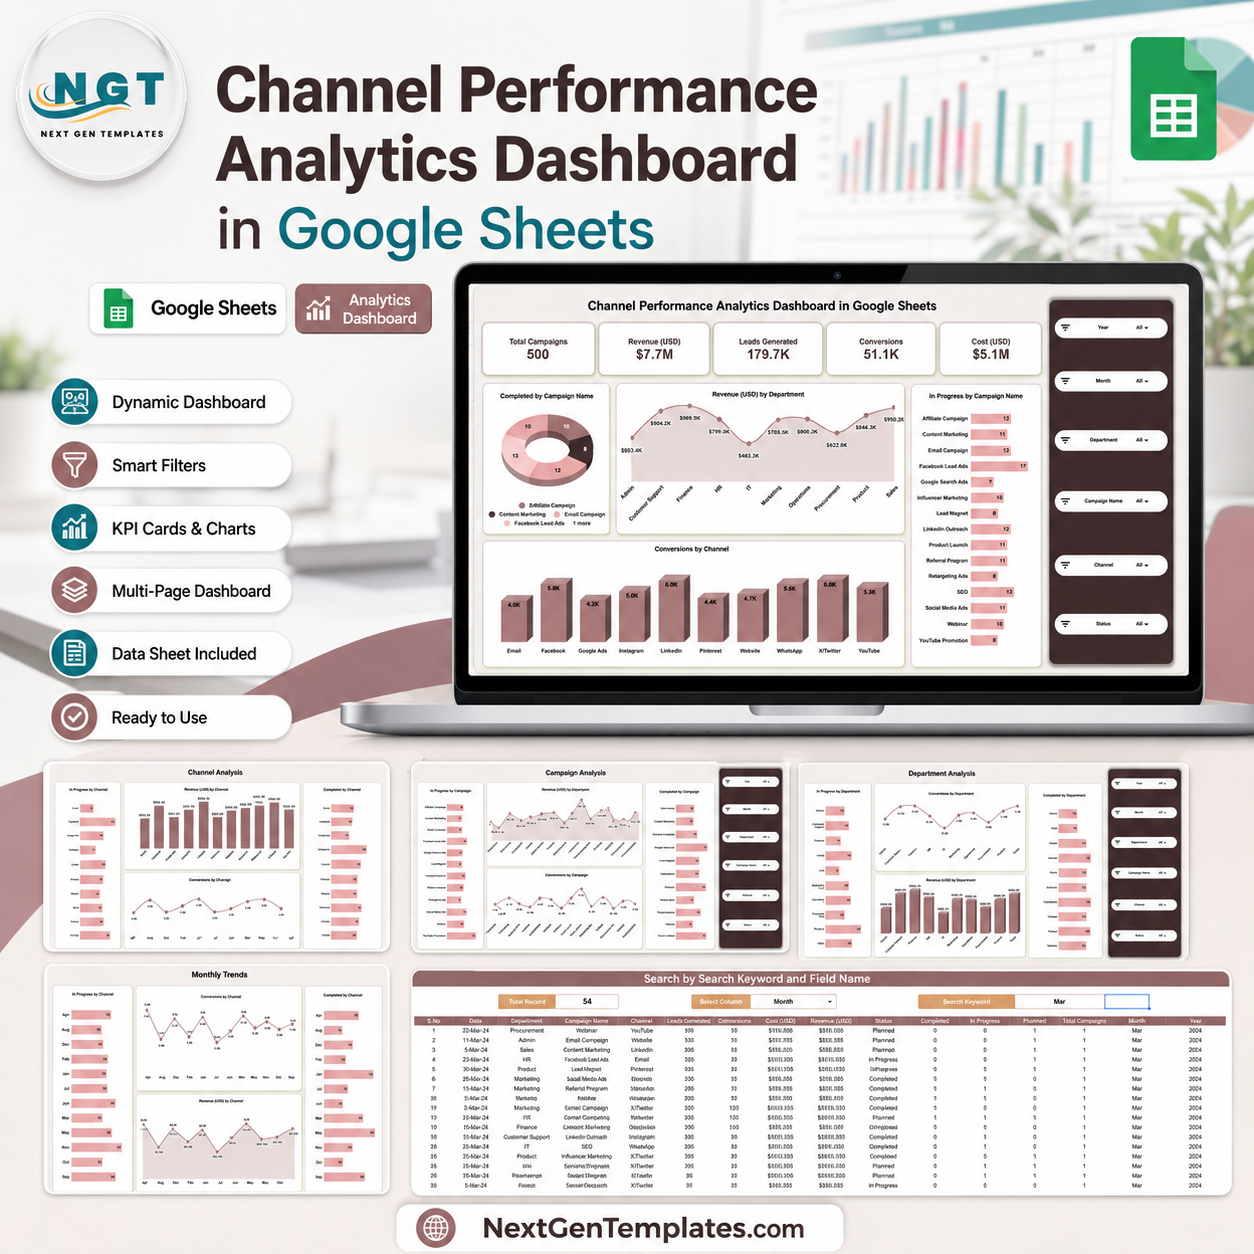


The Channel Performance Analytics Dashboard in Google Sheets gives marketing and operations teams one clear place to track campaign activity, revenue, leads, conversions, and cost. The template includes 5 KPI cards, 5 dashboard analysis pages, 20 chart views, a search sheet, and a structured data sheet. Built by PK, a Microsoft Certified Professional with 15+ years of spreadsheet and BI experience and 300K+ YouTube subscribers across channels, this ready-made dashboard helps teams replace scattered manual reports with a one-time Google Sheets template. It is a draft purchase listing with no subscription, no per-user fee, and a simple refund-friendly review process before publishing.
Key Features of Channel Performance Analytics Dashboard in Google Sheets
- 5 top-level KPI cards: Total Campaigns, Revenue (USD), Leads Generated, Conversions, and Cost (USD).
- 20 chart views: Track completed campaigns, in-progress work, revenue, and conversions by campaign, channel, department, and month.
- Interactive slicers: Filter dashboard views quickly without rebuilding formulas or charts.
- Channel analysis: Compare in-progress work, completed work, revenue, and conversions by channel.
- Search sheet: Select a column, type a keyword, and see matching records with a total record count.
- Editable data structure: Replace sample rows in the same format so the dashboard pages refresh from your own data.
What’s Inside the Channel Performance Analytics Dashboard in Google Sheets
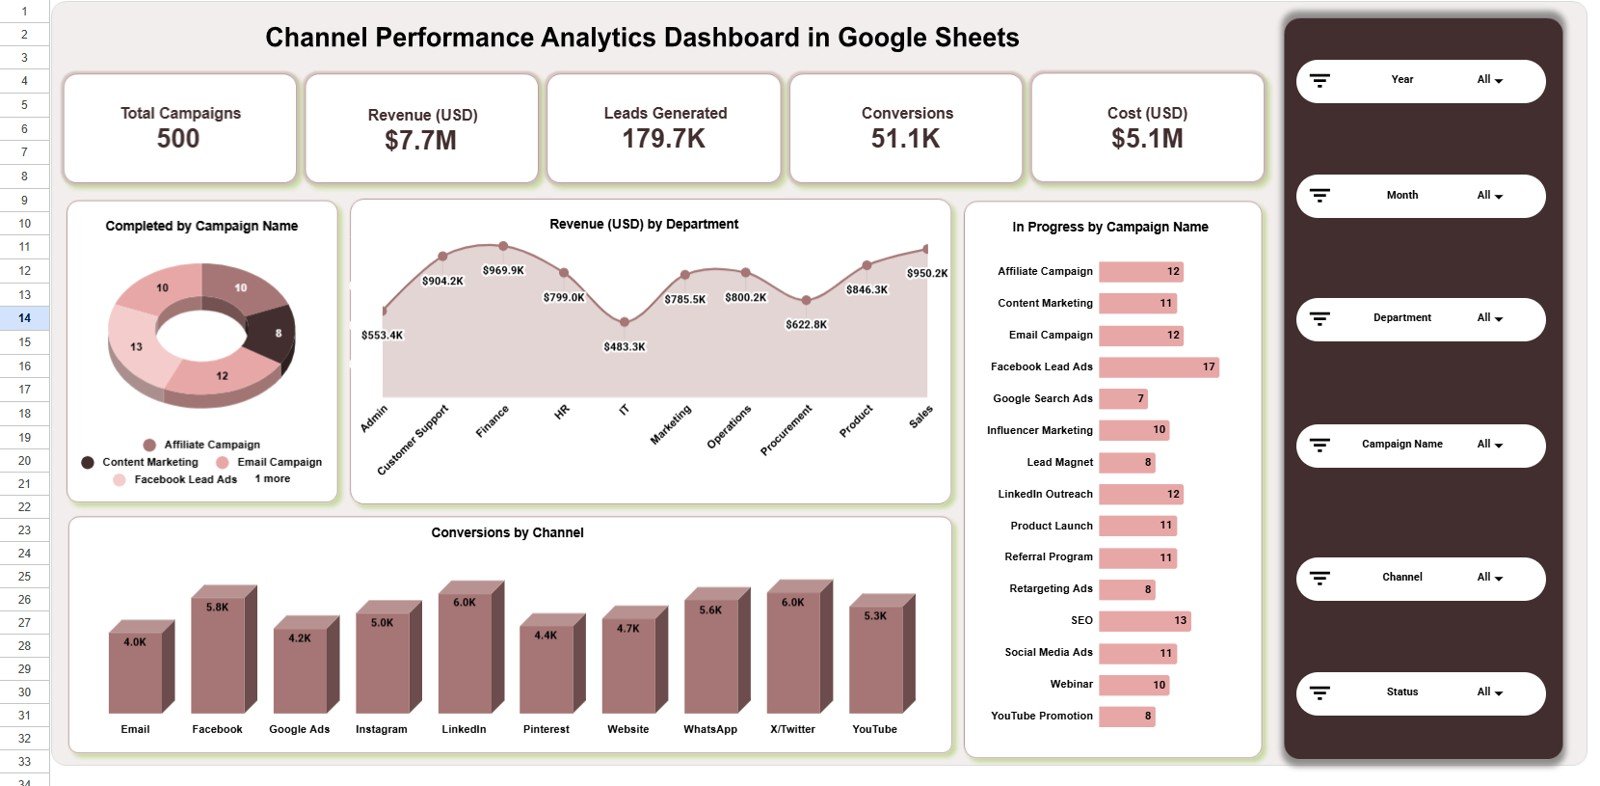
1. Overview Page
The Overview page summarizes Total Campaigns, Revenue (USD), Leads Generated, Conversions, and Cost (USD). Its charts show Completed by Campaign Name, Revenue (USD) by Department, In Progress by Campaign Name, and Conversions by Channel, giving managers a fast campaign health snapshot.
Completed by Campaign Name shows which campaigns have reached completion and where delivery has already closed. Revenue (USD) by Department helps compare which departments contribute the strongest campaign revenue.
In Progress by Campaign Name highlights open campaign workload and follow-up pressure. Conversions by Channel shows which channels are producing the most completed actions from your campaign efforts.
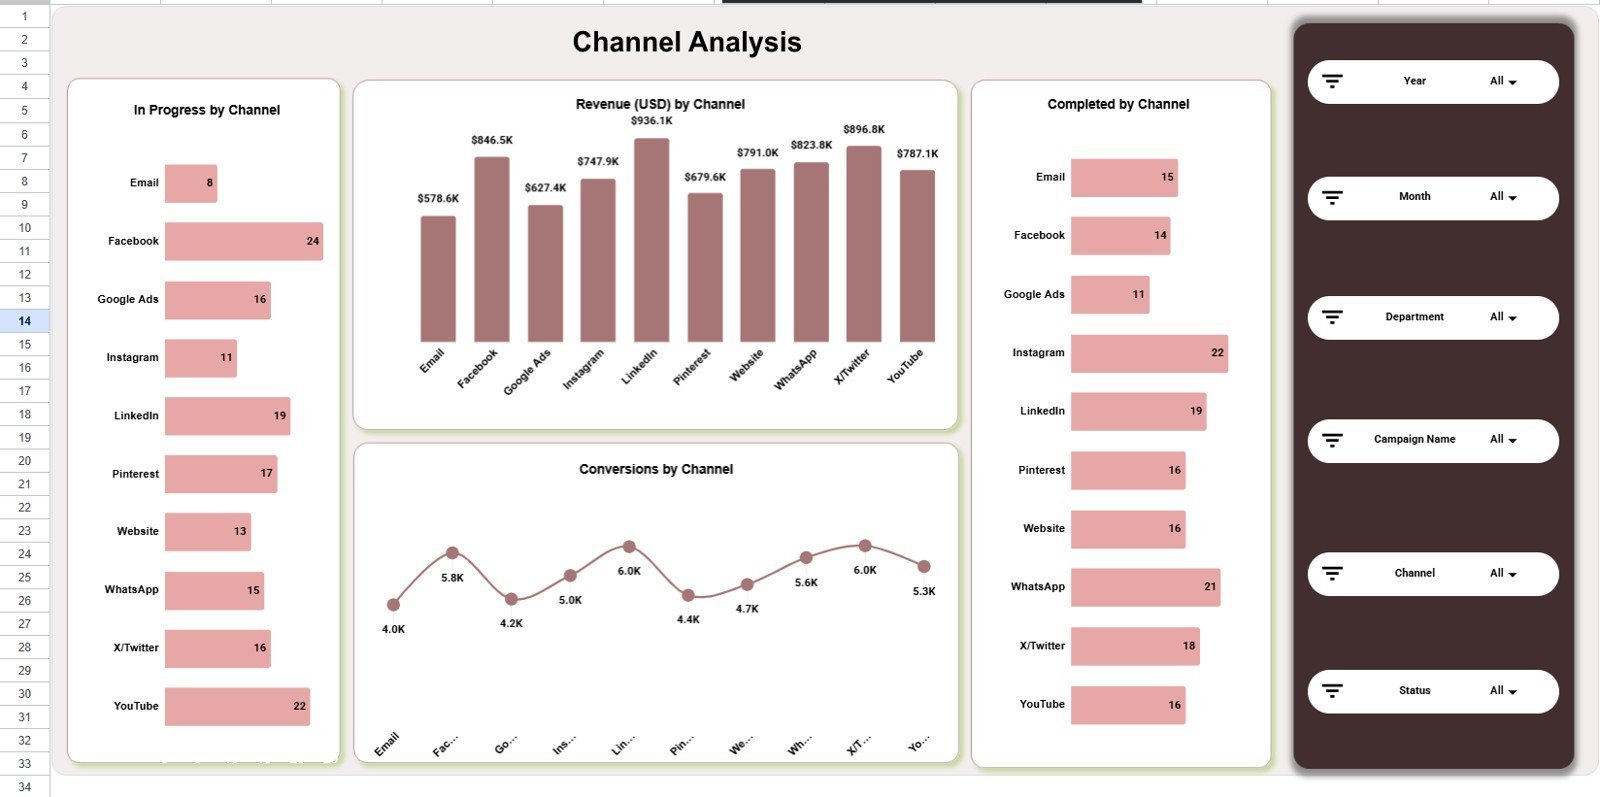
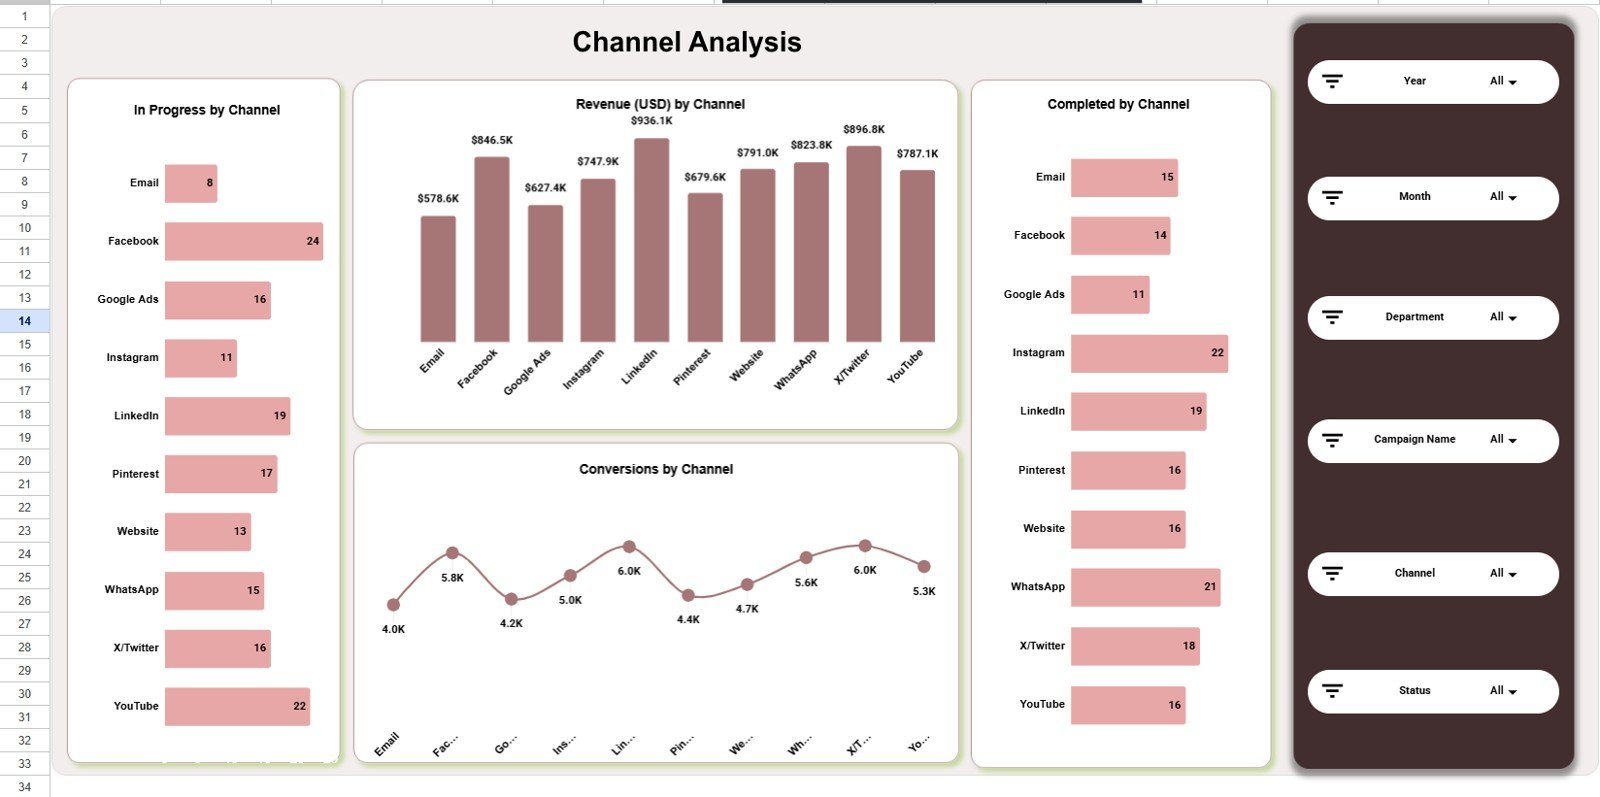
2. Channel Analysis
The Channel Analysis sheet compares In Progress by Channel, Revenue (USD) by Channel, Completed by Channel, and Conversions by Channel. Use it to see which channels are still active, which channels finish campaigns faster, and which channels create stronger conversion volume.
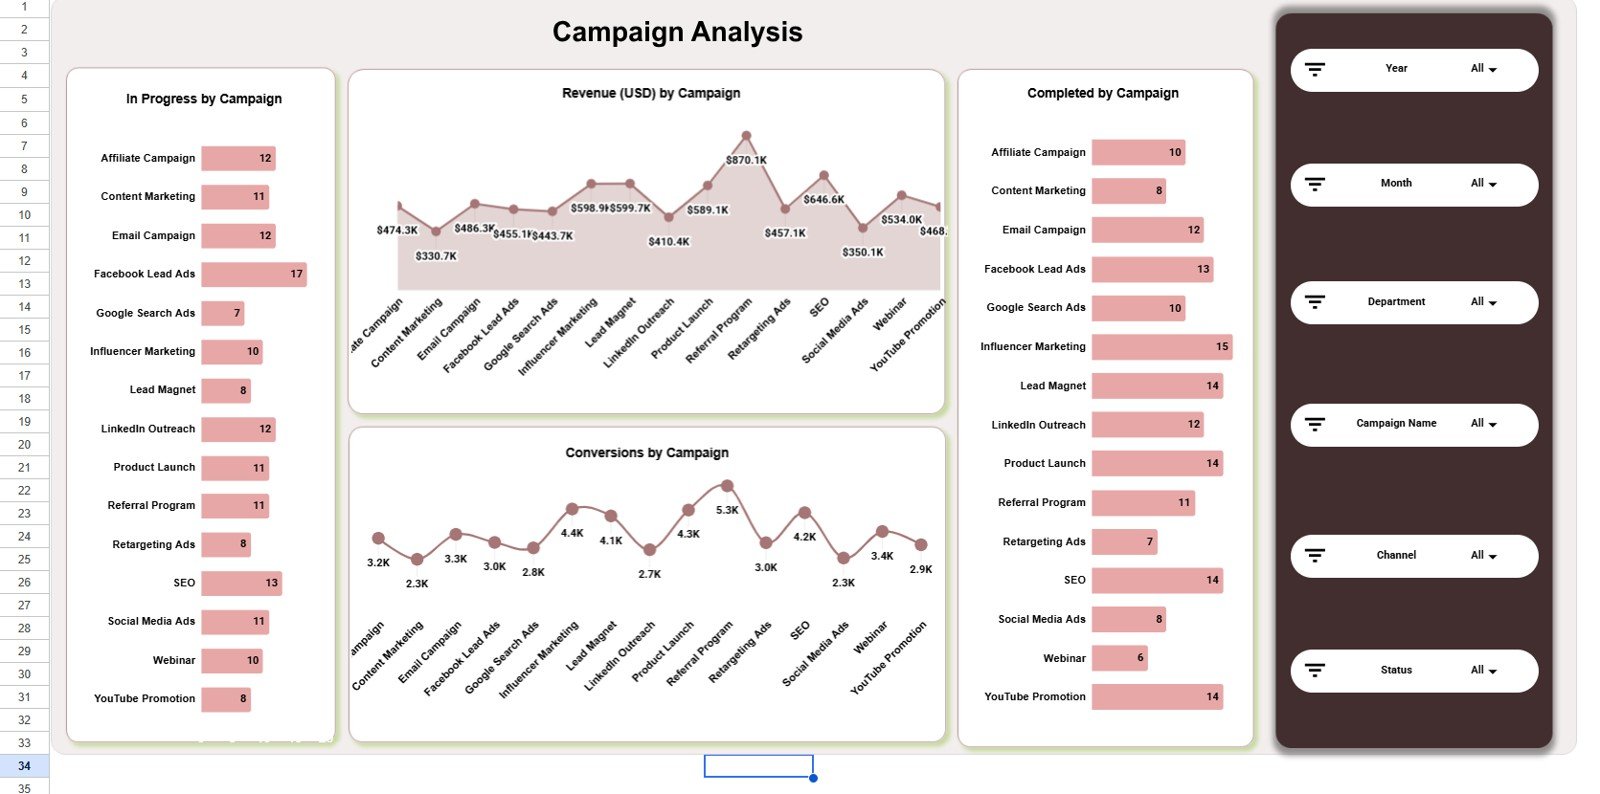
3. Campaign Analysis
The Campaign Analysis sheet tracks In Progress by Campaign, Revenue (USD) by Campaign, Completed by Campaign, and Conversions by Campaign. It is useful for spotting campaigns that consume effort without matching revenue or conversion output.
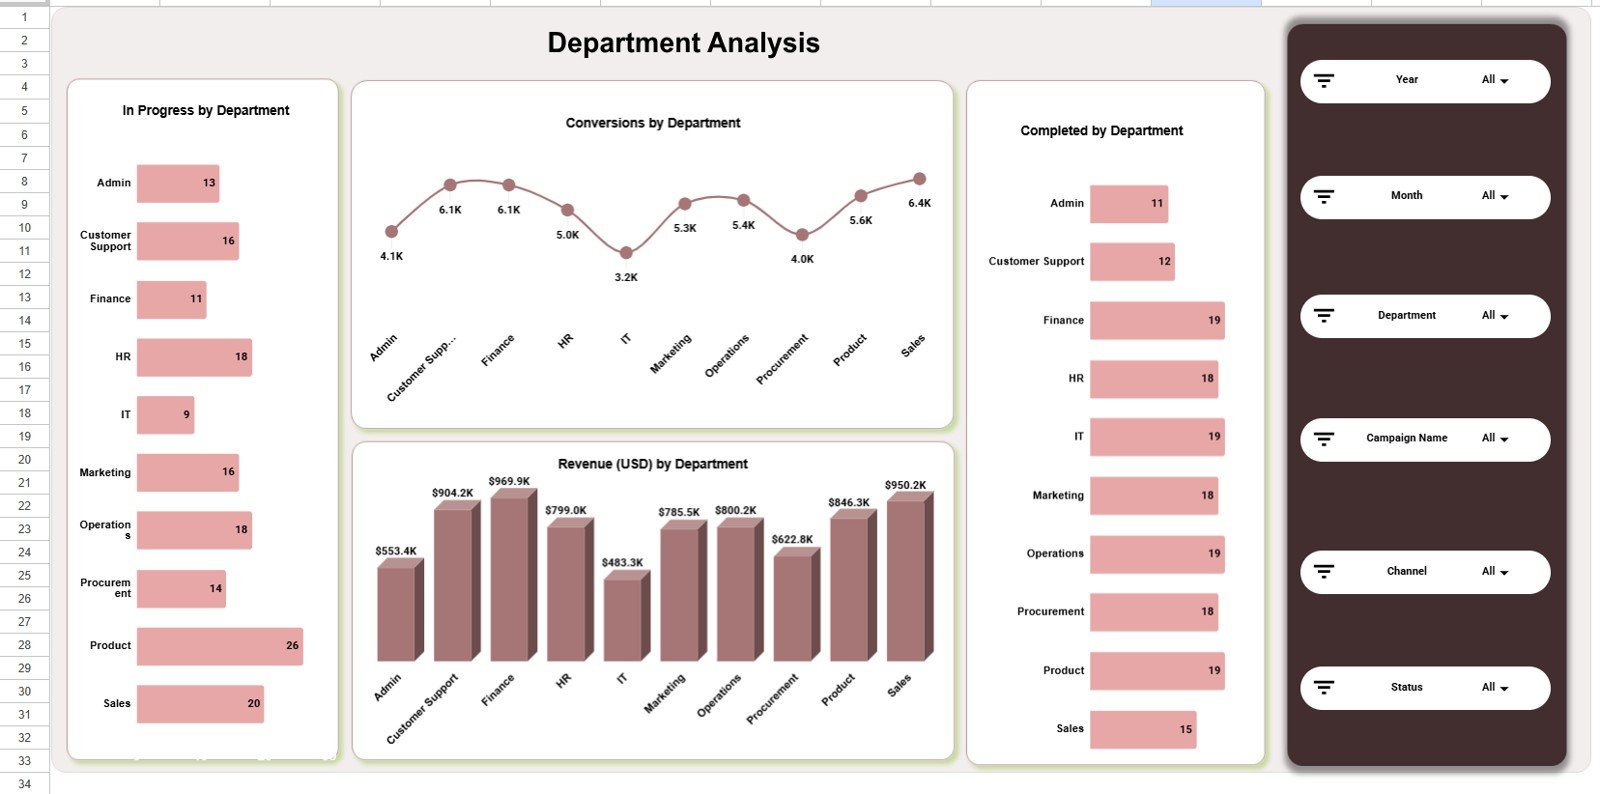
4. Department Analysis
The Department Analysis sheet reviews In Progress by Department, Conversions by Department, Completed by Department, and Revenue (USD) by Department. This helps leaders compare team or department contribution without creating separate reports.
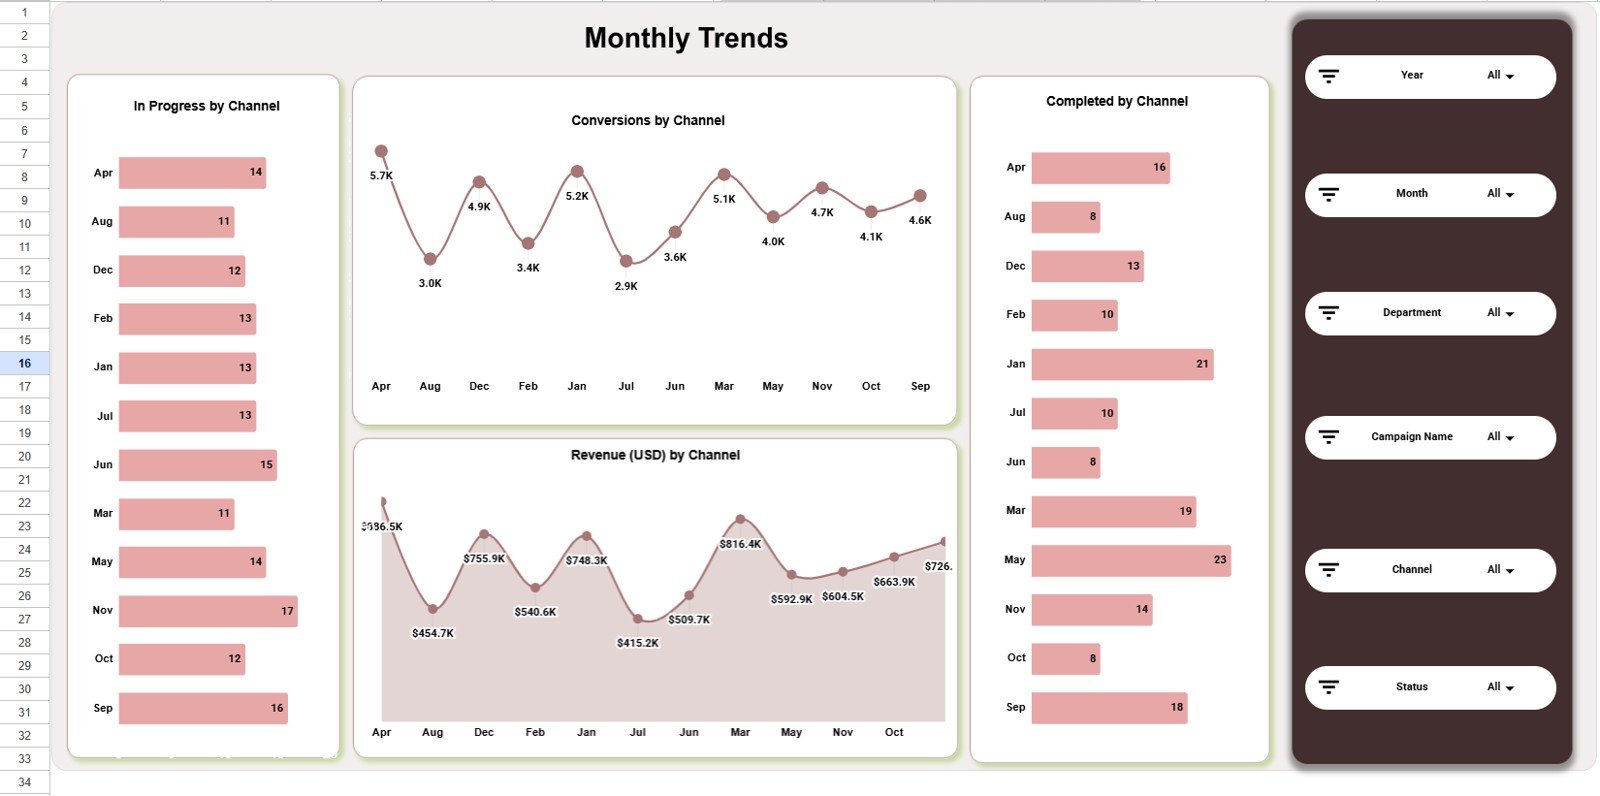
5. Monthly Trends
The Monthly Trends sheet shows In Progress by Month, Conversions by Month, Completed by Month, and Revenue (USD) by Month. It helps teams identify whether performance is improving, flattening, or becoming more seasonal over time.
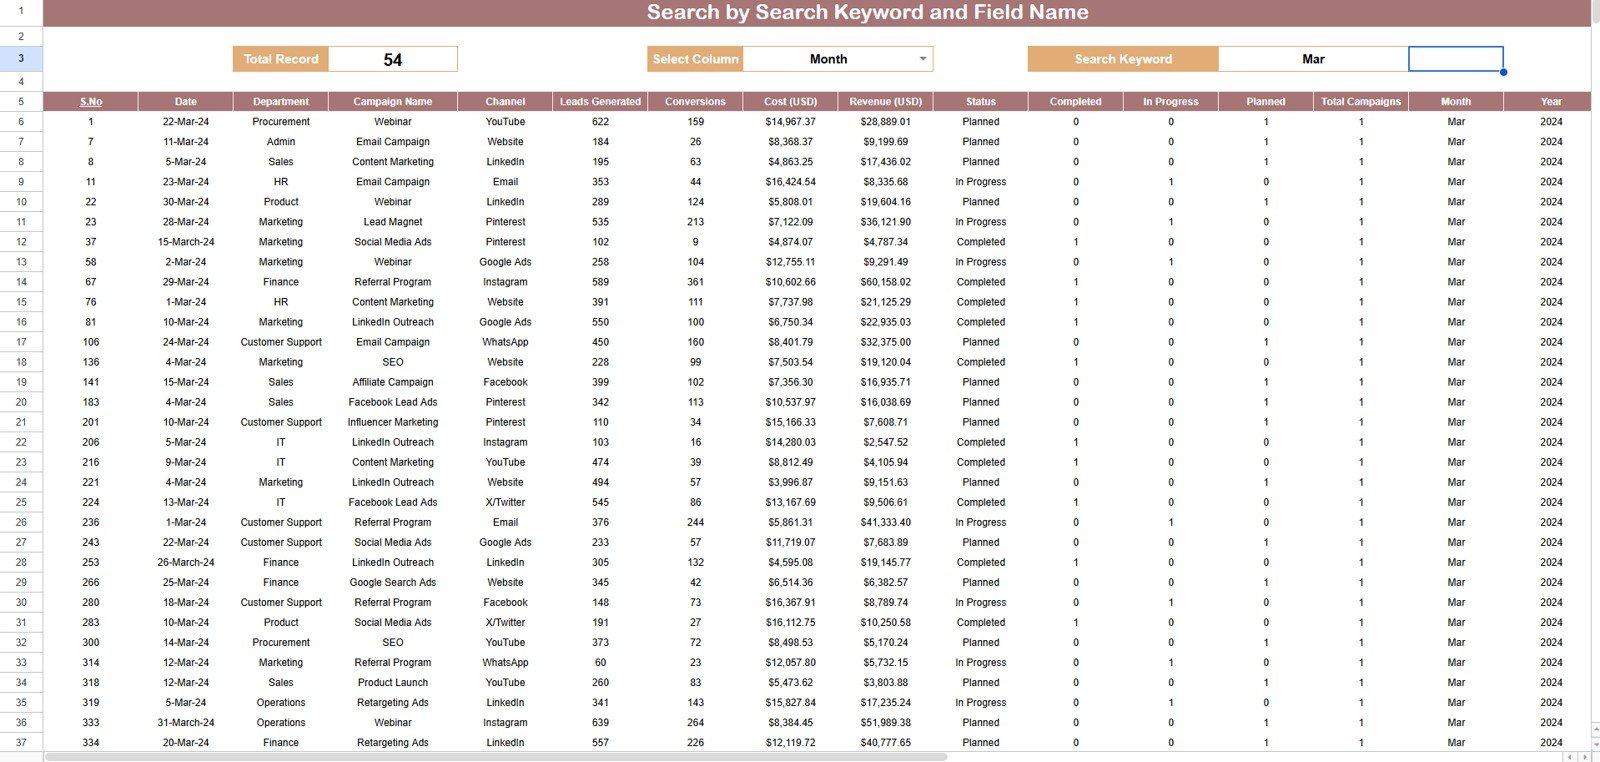
6. Search Sheet Tab
The Search sheet lets you select any column from the dropdown, type a search keyword, and instantly return all matching records with the total record count. This is helpful when you need to find a campaign, channel, department, or status without filtering the main data table.
7. Data Sheet Tab
The Data sheet is where you add your campaign records in the same column format as the sample data. Keep the headers and structure consistent so the dashboard cards, slicers, and charts continue to update correctly.
Channel Performance Analytics Dashboard in Google Sheets vs. Microsoft Excel vs. Paid CRM/SaaS – Where This Fits
| Feature | This Google Sheets Dashboard | Microsoft Excel Dashboard | HubSpot Marketing Hub or similar SaaS |
|---|---|---|---|
| Cost | $9.99 one-time | Usually one-time file purchase | Monthly subscription |
| Platform | Google Sheets in browser | Desktop Excel or OneDrive | Vendor-hosted web app |
| Setup time | Copy the file and replace data | Open workbook and replace data | Implementation and configuration |
| Real-time team collaboration | Native Google Drive sharing | Possible with Microsoft 365 | Built in |
| Mobile access | Google Sheets mobile app | Excel app or browser | Vendor mobile app |
| Customizable fields | Editable spreadsheet columns | Editable workbook structure | Plan and admin dependent |
| Share with link | Yes, through Google Drive | Yes, through OneDrive or file sharing | Role-based account access |
| Year-1 cost at 5 users | $9.99 total | Template cost plus Microsoft access | Often hundreds or thousands of dollars |
| Best fit | Fast campaign reporting and channel reviews | Offline-heavy analysis | Full marketing automation and CRM workflows |
Who This Template Is For – and Who It’s Not For
This dashboard is for marketing managers, channel owners, campaign analysts, agencies, startup founders, and department heads who need a low-cost way to review campaign activity by channel, campaign, department, and month. It is especially useful when teams already store exports in spreadsheets and want a cleaner reporting view.
It is not a replacement for automated ad-platform connectors, CRM workflows, lead nurturing automation, attribution modeling, or a full marketing operations system. If you need live API refreshes, permissions by sales territory, or campaign automation, a CRM or BI implementation may be a better fit.
How to Use the Channel Performance Analytics Dashboard in Google Sheets
- Open the PDF guide from your purchase and use the Google Sheets copy link.
- Create your own editable copy in Google Drive.
- Go to the Data sheet and replace the sample rows with your campaign records.
- Keep the same column structure so charts and slicers continue working.
- Use the Overview page first, then review Channel, Campaign, Department, and Monthly Trends pages.
- Use the Search sheet when you need to find matching records quickly.
Real-World Use Cases
Riya, a marketing manager, uses the overview page in Monday meetings to compare revenue, leads, conversions, and cost before deciding which campaigns need follow-up.
Marcus, an agency analyst, uses the Channel Analysis and Campaign Analysis pages to prepare client updates without rebuilding charts for every reporting cycle.
Elena, a department lead, uses the Department Analysis page to compare completed work and revenue contribution across teams before monthly planning.
Frequently Asked Questions
Is this dashboard built in Google Sheets?
Yes. It is designed for Google Sheets and can be copied into your Google Drive from the included guide.
What KPI cards are included?
The overview page includes Total Campaigns, Revenue (USD), Leads Generated, Conversions, and Cost (USD).
Can I filter the dashboard?
Yes. The dashboard uses slicers so you can filter the visuals quickly by available fields in the data.
Does it include channel-level analysis?
Yes. The Channel Analysis page compares in-progress campaigns, completed campaigns, revenue, and conversions by channel.
Can I add my own data?
Yes. Add your records to the Data sheet in the same format as the sample data so the dashboard continues to refresh correctly.
Does this replace marketing software?
No. It is a reporting template, not a CRM, ad platform, or marketing automation system.
About the Author
Built by PK – Microsoft Certified Professional with 15+ years of Excel, Google Sheets, and Power BI experience. Founder of NextGenTemplates, reaching 300K+ subscribers across YouTube channels. Every template is hand-built and tested before release.
Explore Related Templates
For a broader marketing reporting setup, explore the , PPC Campaign KPI Dashboard in Google Sheets, Marketing and Social Media Analytics Kit, and Digital Marketing Campaign Dashboard in Excel. You can also browse all Google Sheets Dashboard templates and Sales and Marketing Google Sheets templates.
Download the Channel Performance Analytics Dashboard in Google Sheets to turn campaign, channel, department, conversion, and revenue data into a clean operating view.
Click here to Read Detailed blog post
Watch the step-by-step video Demo:
Last updated: June 14, 2026.


Reviews
There are no reviews yet.