

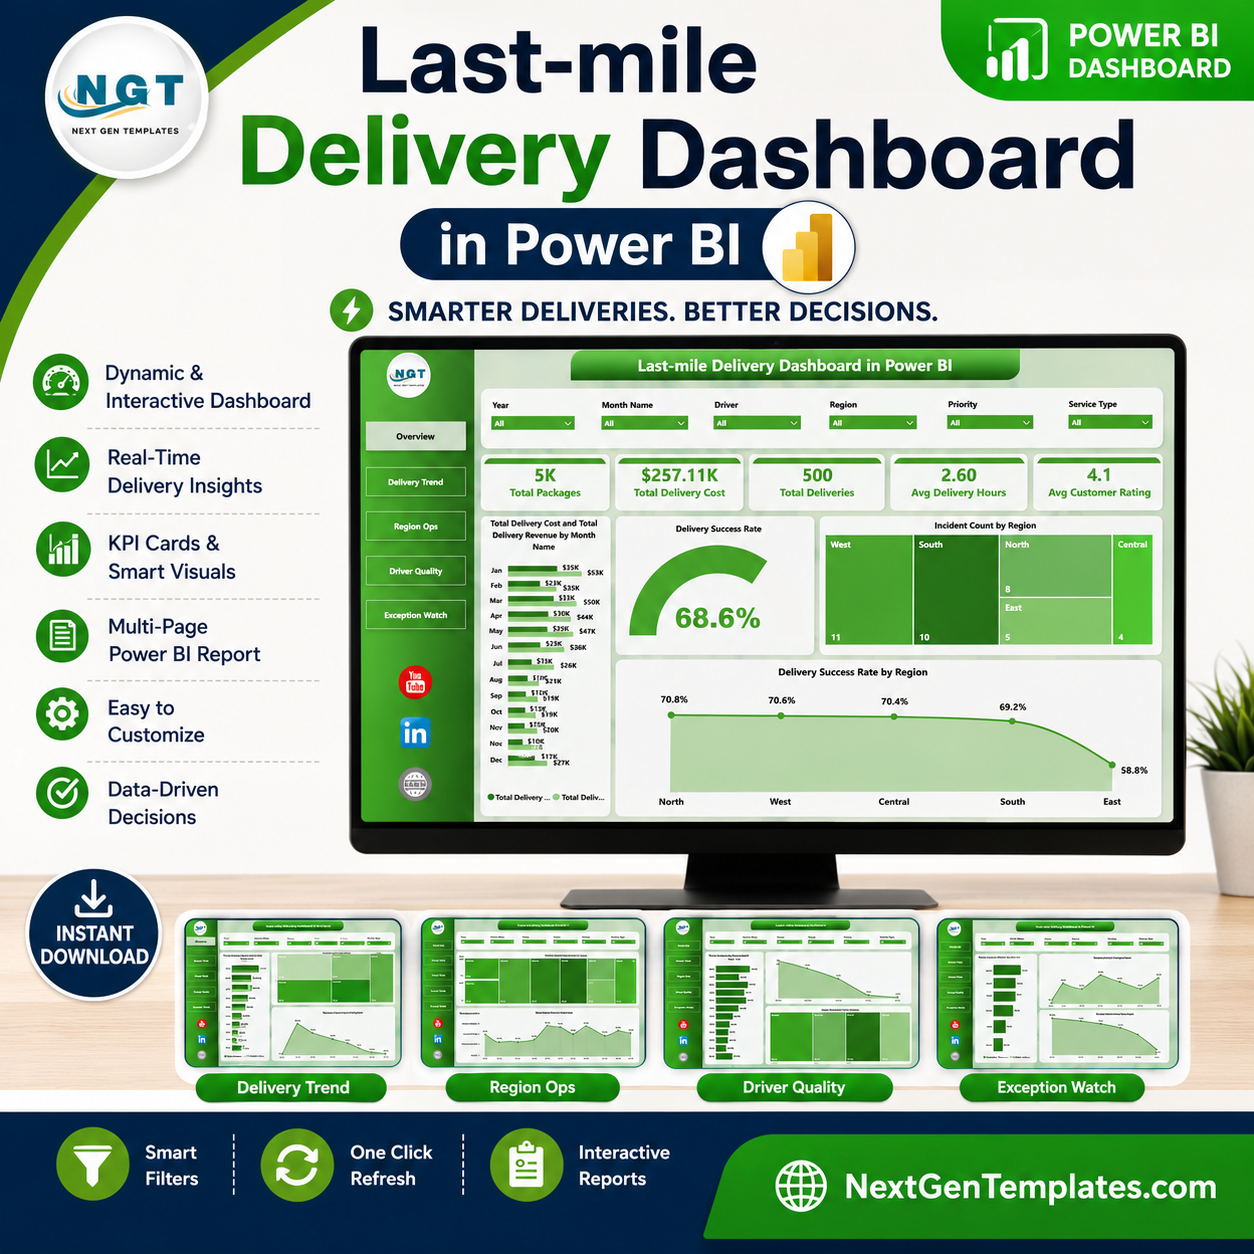

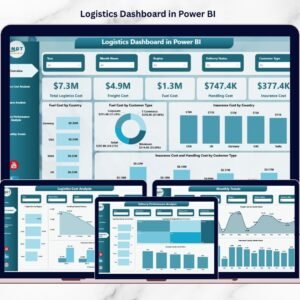
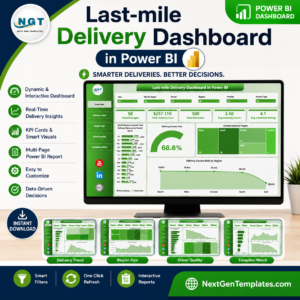
Last-mile Delivery Dashboard in Power BI helps ecommerce, courier, 3PL, transportation, and logistics teams monitor packages, delivery cost, revenue, delivery hours, customer ratings, regional incidents, and success rates from one interactive Power BI report. Last-mile delivery is often one of the most expensive and customer-visible parts of the supply chain, so delayed visibility can quickly turn into higher costs and weaker service reviews. This template gives you 5 ready-made Power BI pages, executive KPI cards, multiple slicers, and report visuals built for recurring delivery performance reviews. Built by PK and backed by 300K+ YouTube subscribers across the NextGenTemplates ecosystem, it is a practical, one-time purchase alternative to starting every delivery report from scratch.
Key Features of Last-mile Delivery Dashboard in Power BI
- 5 Power BI report pages: Overview Page, Delivery Trend, Region Ops, Driver Quality, and Exception Watch.
- Executive KPI cards: Track Total Packages, Total Delivery Cost, Total Deliveries, Avg Delivery Hours, and Avg Customer Rating.
- Revenue and cost tracking: Compare Total Delivery Cost and Total Delivery Revenue by month and region.
- Delivery success analysis: Review success rate by overall performance, region, and priority.
- Regional operations views: Analyze packages by city, deliveries by vehicle type, and ratings by driver.
- Driver quality monitoring: Compare customer rating by service type and revenue trends by month.
- Exception watch page: Review net delivery profit, delivered count, and average delivery hours by vehicle type.
- Interactive slicers: Use Power BI filters to drill into regions, time periods, drivers, service types, priorities, and vehicle groups.
What’s Inside the Last-mile Delivery Dashboard in Power BI
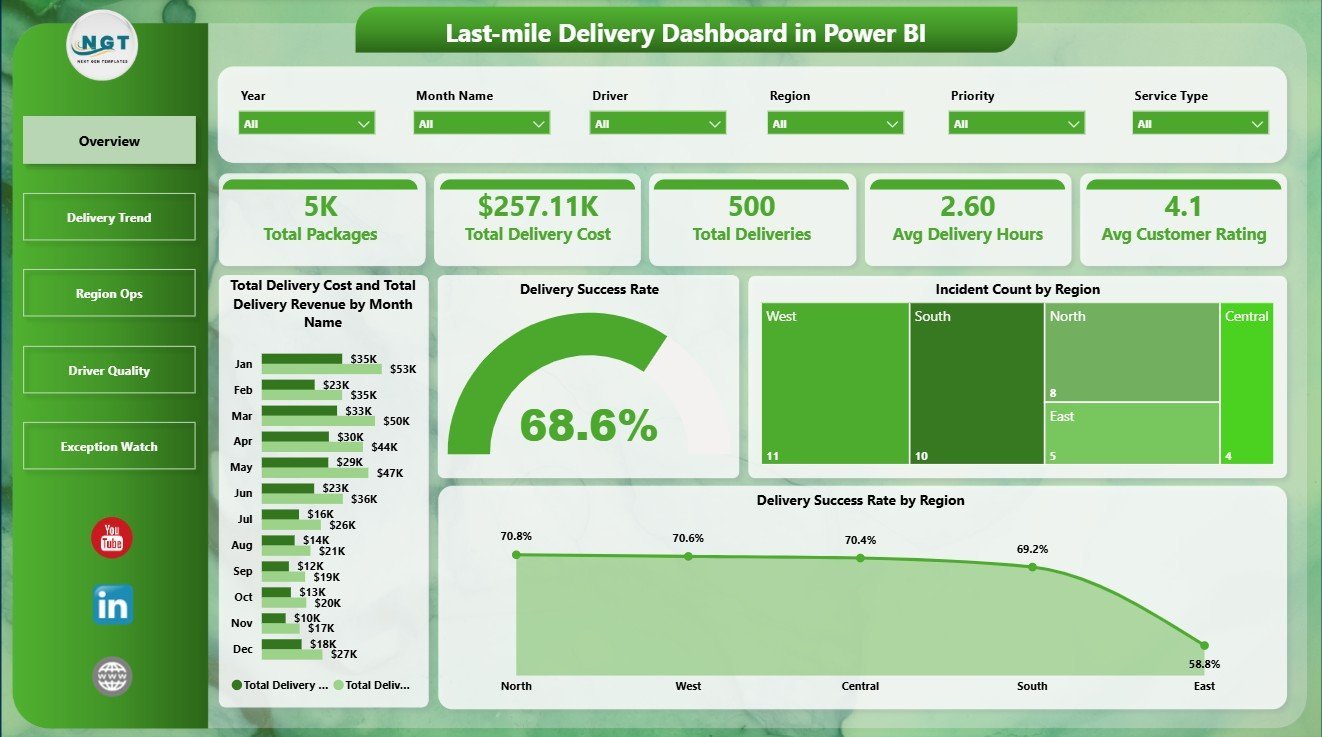
The Overview Page gives leadership a quick operating summary through five cards: Total Packages, Total Delivery Cost, Total Deliveries, Avg Delivery Hours, and Avg Customer Rating. These cards help managers understand volume, spend, service speed, and customer experience before reviewing deeper visuals.
The Total Delivery Cost and Total Delivery Revenue by Month Name chart compares monthly spend against revenue so teams can see whether delivery economics are improving or tightening. Delivery Success Rate by Overall Performance separates strong and weak operating outcomes, making it easier to spot underperforming delivery groups. Incident Count by Region shows where service issues are concentrated. Delivery Success Rate by Region helps managers compare regional reliability and prioritize operational fixes.
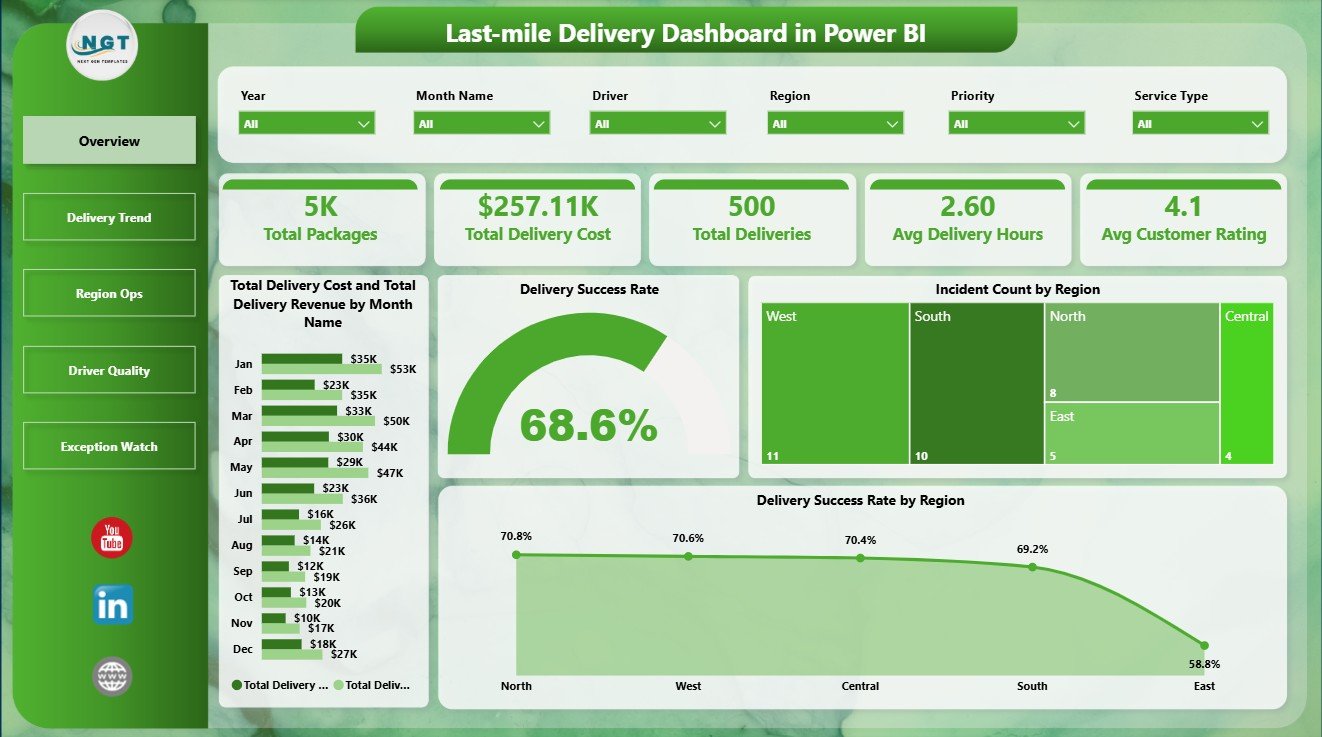
Last-mile Delivery Dashboard in Power BI
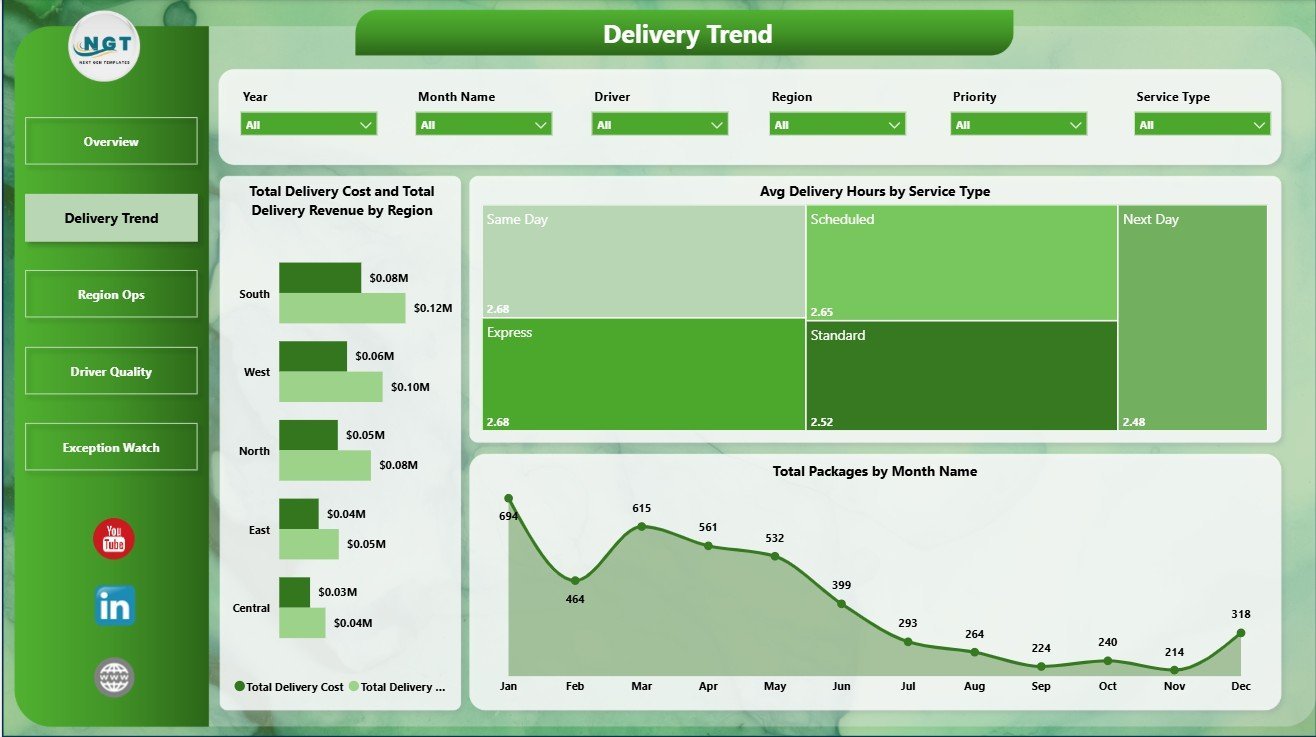
The Delivery Trend page focuses on cost, revenue, speed, and package movement. Total Delivery Cost and Total Delivery Revenue by Region compares margin pressure across markets. Avg Delivery Hours by Service Type shows which service categories are faster or slower. Total Packages by Month Name reveals seasonal package volume changes and peak workload periods.
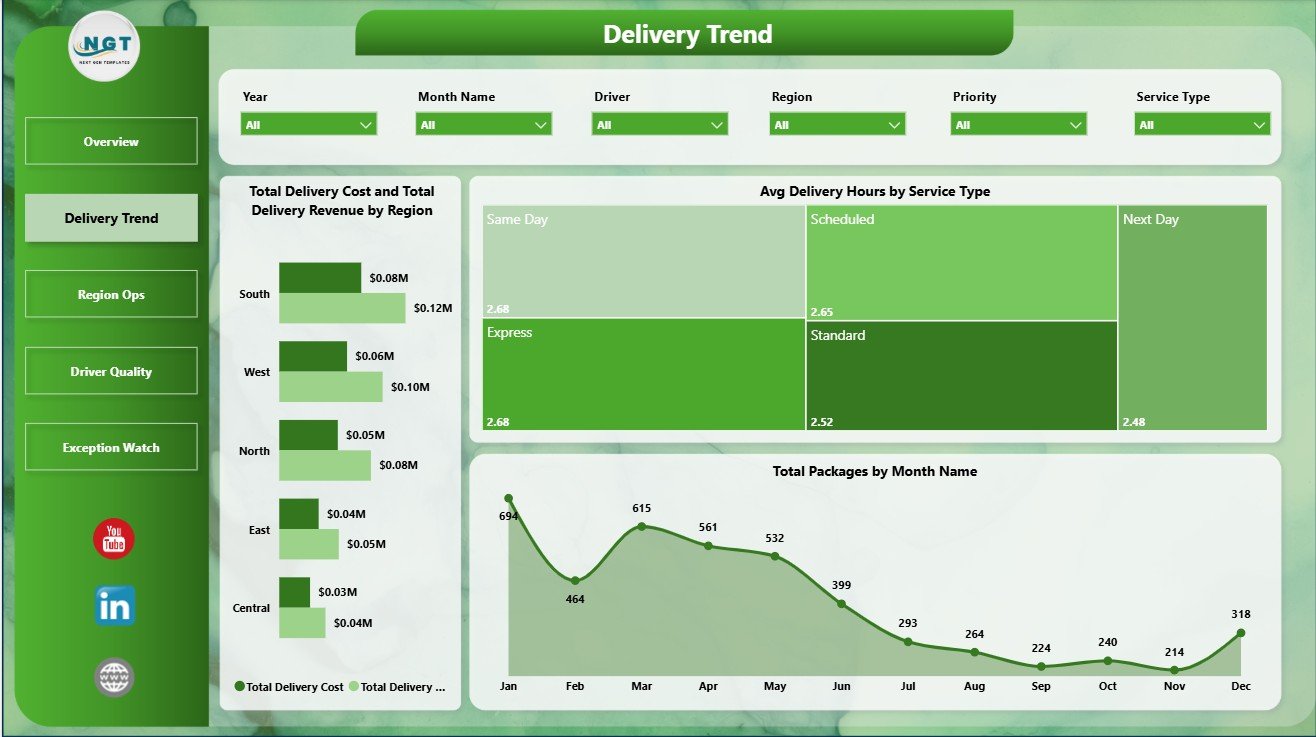
Delivery Trend
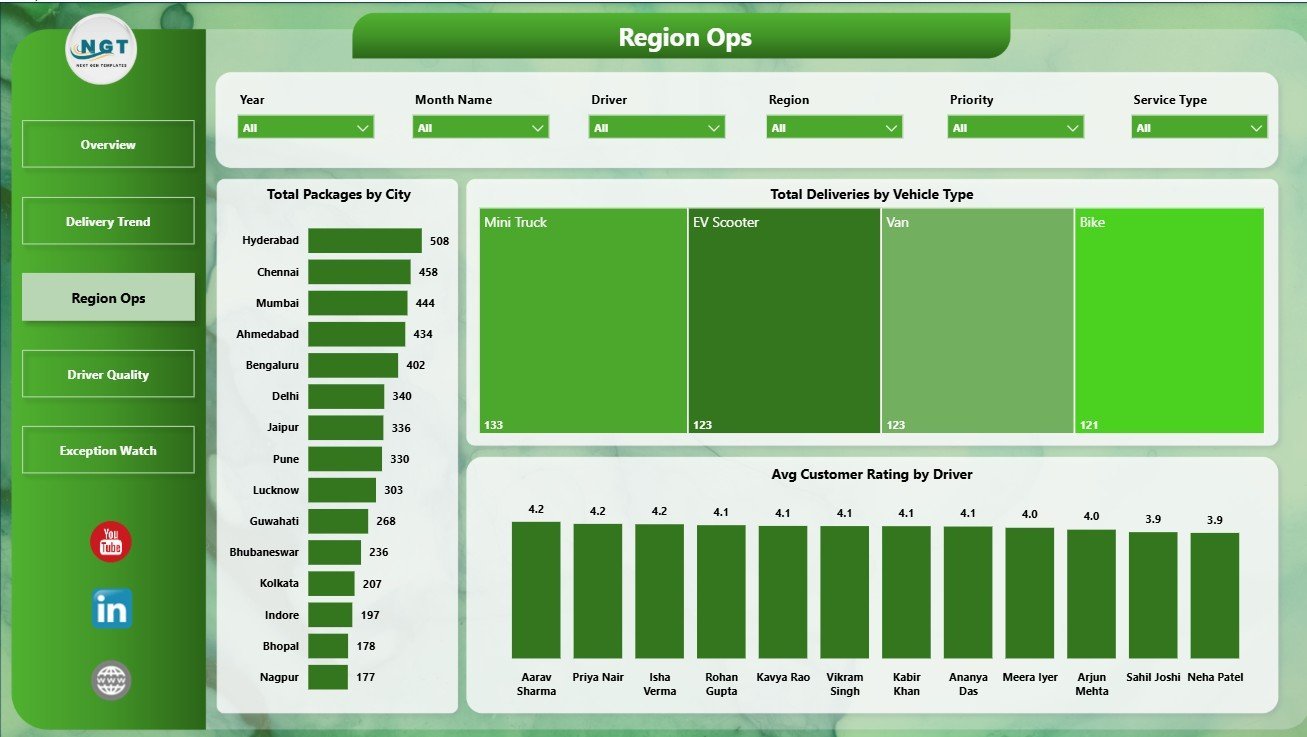
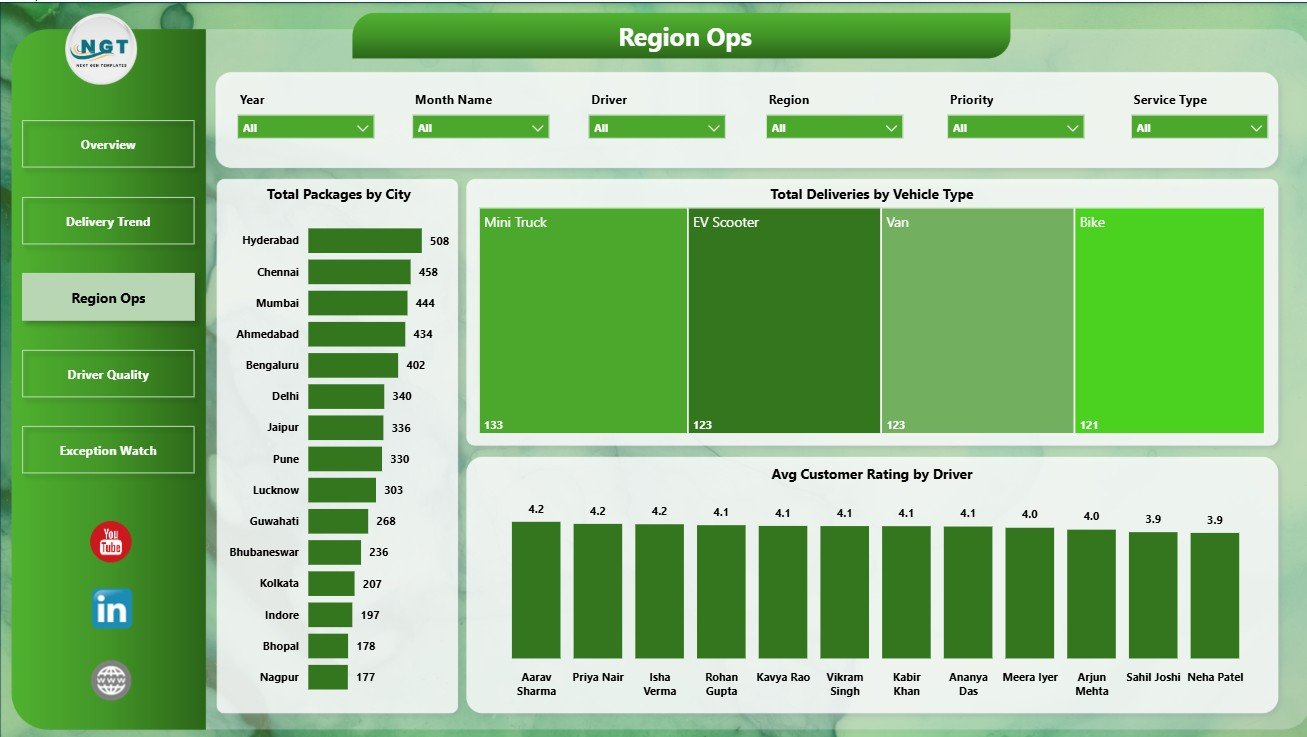
The Region Ops page is built for local operating review. Total Packages by City identifies cities with the highest delivery workload. Total Deliveries by Vehicle Type shows how different delivery modes contribute to completed work. Avg Customer Rating by Driver helps supervisors review service quality and spot coaching opportunities.
Region Ops
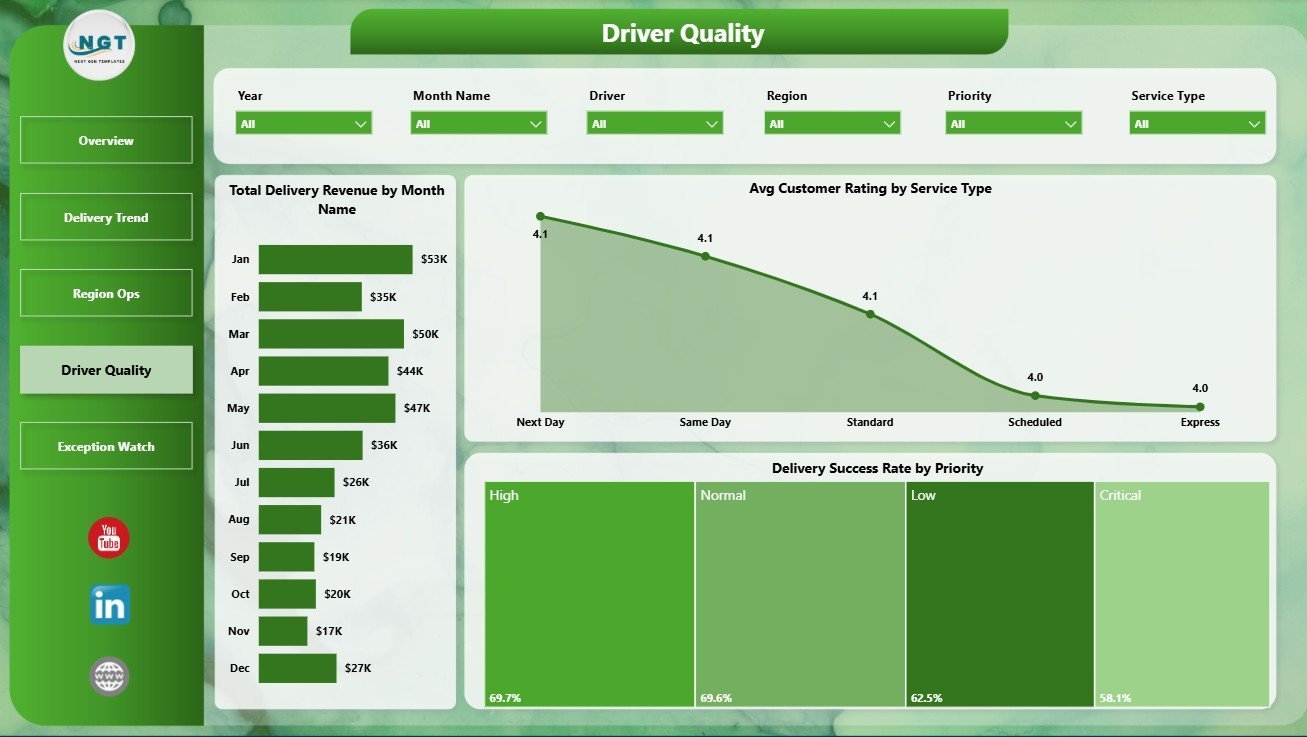
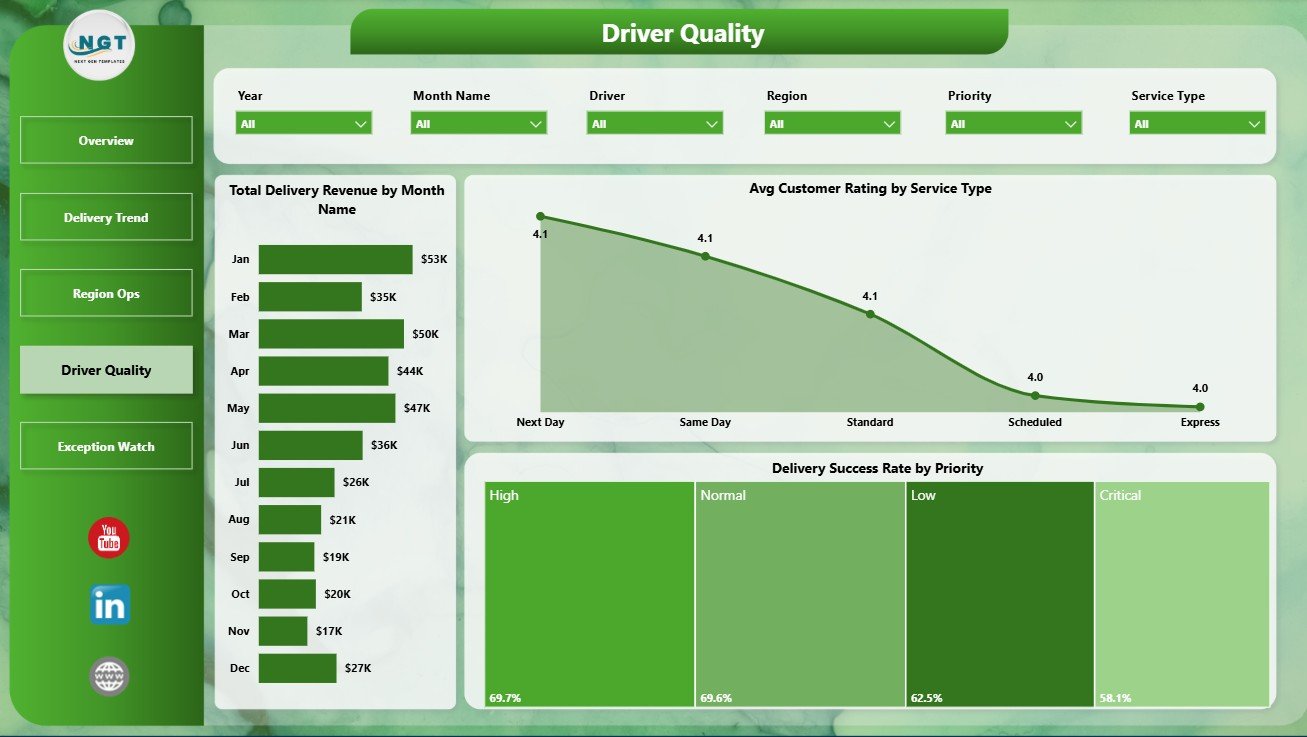
The Driver Quality page supports service review and recurring quality meetings. Total Delivery Revenue by Month Name shows revenue movement over time. Avg Customer Rating by Service Type compares how customers experience each service category. Delivery Success Rate by Priority helps teams check whether high-priority deliveries are being completed with the reliability they require.
Driver Quality
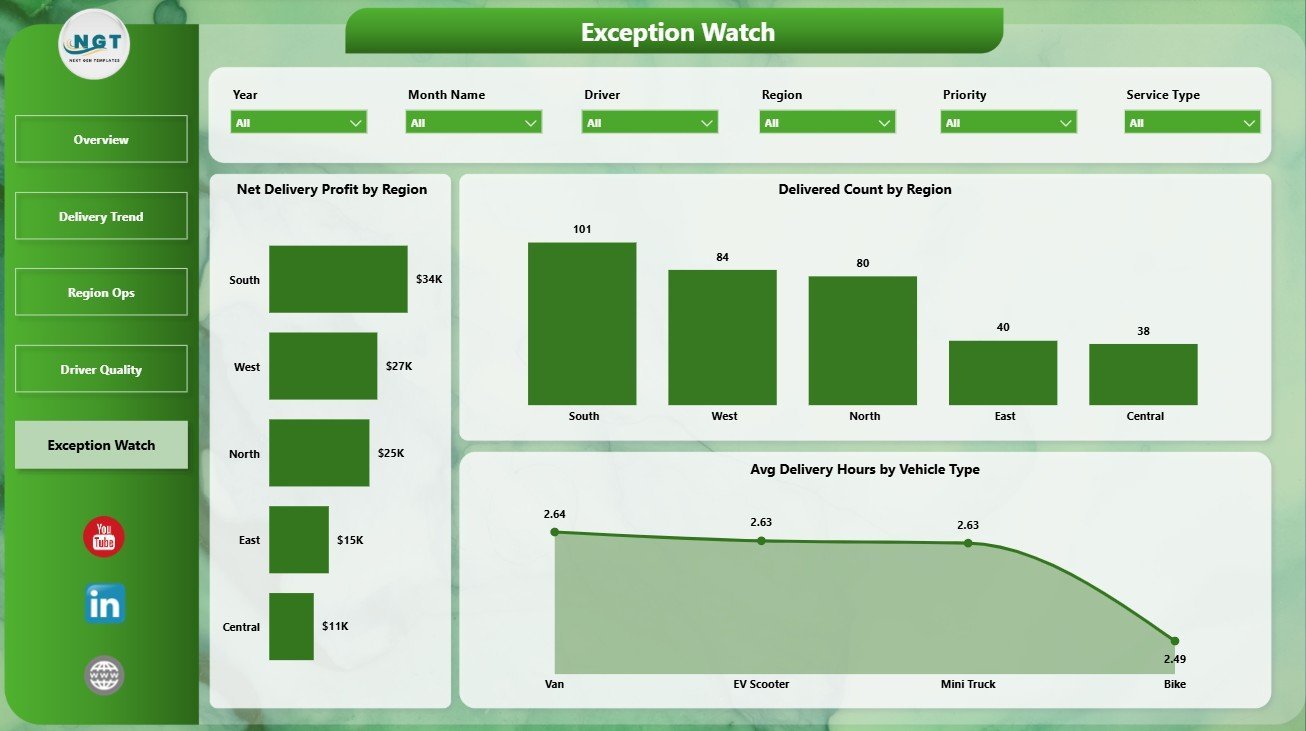
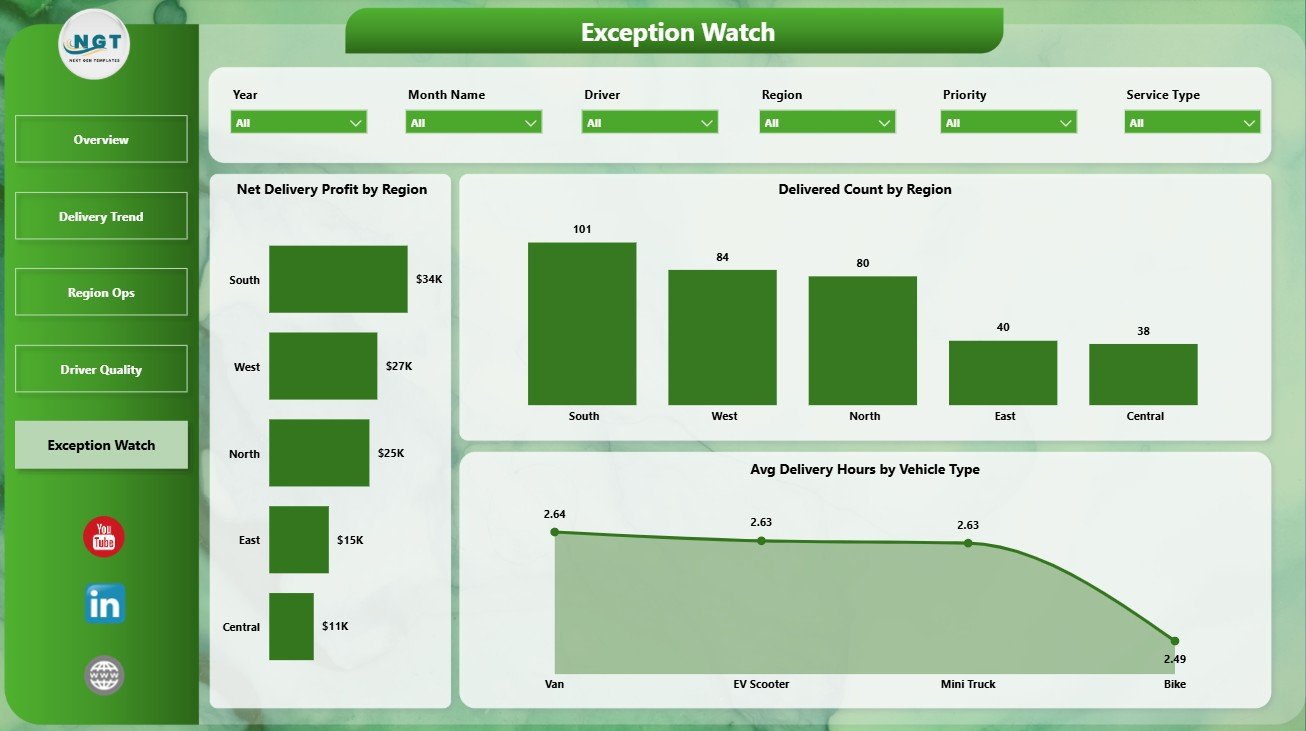
The Exception Watch page is designed for operational follow-up. Net Delivery Profit by Region shows where delivery economics are strongest or weakest. Delivered Count by Region compares completed delivery output across territories. Avg Delivery Hours by Vehicle Type helps teams understand whether vehicle selection is affecting service speed.
Exception Watch
Last-mile Delivery Dashboard in Power BI vs. Tableau vs. Paid CRM/SaaS – Where This Fits
| Feature | This Power BI template | Tableau alternative | Paid delivery SaaS |
|---|---|---|---|
| Cost | $17.99 one-time | Requires Tableau setup and licensing | Monthly or annual subscription |
| Platform | Power BI Desktop | Tableau Desktop or Cloud | Vendor-hosted system |
| Setup time | Open PBIX, connect or replace data, refresh | Build or adapt workbook | Implementation and onboarding |
| Real-time team collaboration | Available through Power BI Service when published | Available through Tableau Cloud/Server | Usually included |
| Mobile access | Power BI mobile after publishing | Tableau mobile after publishing | Usually included |
| Customizable fields | Editable model, visuals, pages, and measures | Editable if you build or own workbook | Depends on plan and vendor |
| Share with link | Available through Power BI Service | Available through Tableau sharing | Login controlled |
| Year-1 cost at 5 users | $17.99 plus Microsoft licensing if sharing online | Software and implementation cost | Often hundreds or thousands |
| Delivery analytics pages | 5 ready-made pages | Must be built or purchased | Depends on vendor module |
Who This Template Is For – and Who It’s Not For
This template is for last-mile delivery teams, ecommerce operations managers, courier companies, 3PL analysts, fleet coordinators, regional delivery leaders, and consultants who need repeatable Power BI reporting for packages, delivery cost, revenue, driver quality, incidents, ratings, success rate, and delivery hours.
It is not a dispatch system, route optimizer, GPS tracker, barcode scanner, proof-of-delivery app, or driver mobile workflow. It is a reporting dashboard for teams that already collect delivery data and want a cleaner way to analyze it in Power BI.
How to Use the Last-mile Delivery Dashboard in Power BI
- Download and unzip the template package.
- Open the PBIX file in Power BI Desktop, which is free from Microsoft.
- Review the sample delivery data and required field structure.
- Replace the sample data or connect the report to your own source.
- Click Refresh to update cards, slicers, measures, and visuals.
- Use the report pages to review overview performance, delivery trends, regional operations, driver quality, and exceptions.
Real-World Use Cases
Ravi, ecommerce operations manager: Ravi uses the Overview and Delivery Trend pages every Monday to compare package volume, delivery cost, revenue, and delivery hours before meeting courier partners.
Meera, regional logistics lead: Meera reviews Region Ops and Exception Watch to compare city workload, vehicle usage, delivered count, incidents, and profit by region.
Daniel, 3PL reporting consultant: Daniel adapts the Power BI model for client reporting and uses driver rating, service type, and priority views to support service improvement discussions.
Frequently Asked Questions
What software do I need?
You need Power BI Desktop to open and edit the PBIX file. Power BI Desktop is available from Microsoft.
How many pages are included?
The report includes 5 pages: Overview Page, Delivery Trend, Region Ops, Driver Quality, and Exception Watch.
Can I connect my own delivery data?
Yes. You can replace the sample data or connect the PBIX file to your own source, then refresh the report.
Can I customize the visuals?
Yes. You can edit visuals, slicers, measures, report pages, colors, labels, and the underlying data model in Power BI Desktop.
Does this replace delivery management software?
No. It is a reporting and analytics template, not a dispatch, routing, tracking, or proof-of-delivery platform.
Can I publish it online?
Yes. You can publish the report to Power BI Service if your Microsoft licensing supports online sharing and collaboration.
About the Author
Built by PK – Microsoft Certified Professional with 15+ years of Excel, Google Sheets, and Power BI experience. Founder of NextGenTemplates, reaching 300K+ subscribers across YouTube channels. Every template is hand-built and tested before release.
Explore Related Templates
Explore more Power BI dashboard templates. Related options include Third-Party Logistics (3PL) Dashboard in Power BI, Trucking and Logistics Dashboard in Power BI, Cold Chain Logistics Dashboard in Power BI, and Last-mile Delivery Dashboard in Excel.
Ready to analyze delivery performance in Power BI? Download the Last-mile Delivery Dashboard in Power BI, connect your delivery data, refresh the model, and start reviewing performance today.
Last updated: June 30, 2026
Watch the step-by-step video tutorial:
Compatibility and Requirements
- Works in Power BI Desktop, which is free from Microsoft. Get it from Get Power BI Desktop.
- Open the PBIX file, replace the sample data or connect your own source, then refresh the report.










Reviews
There are no reviews yet.