

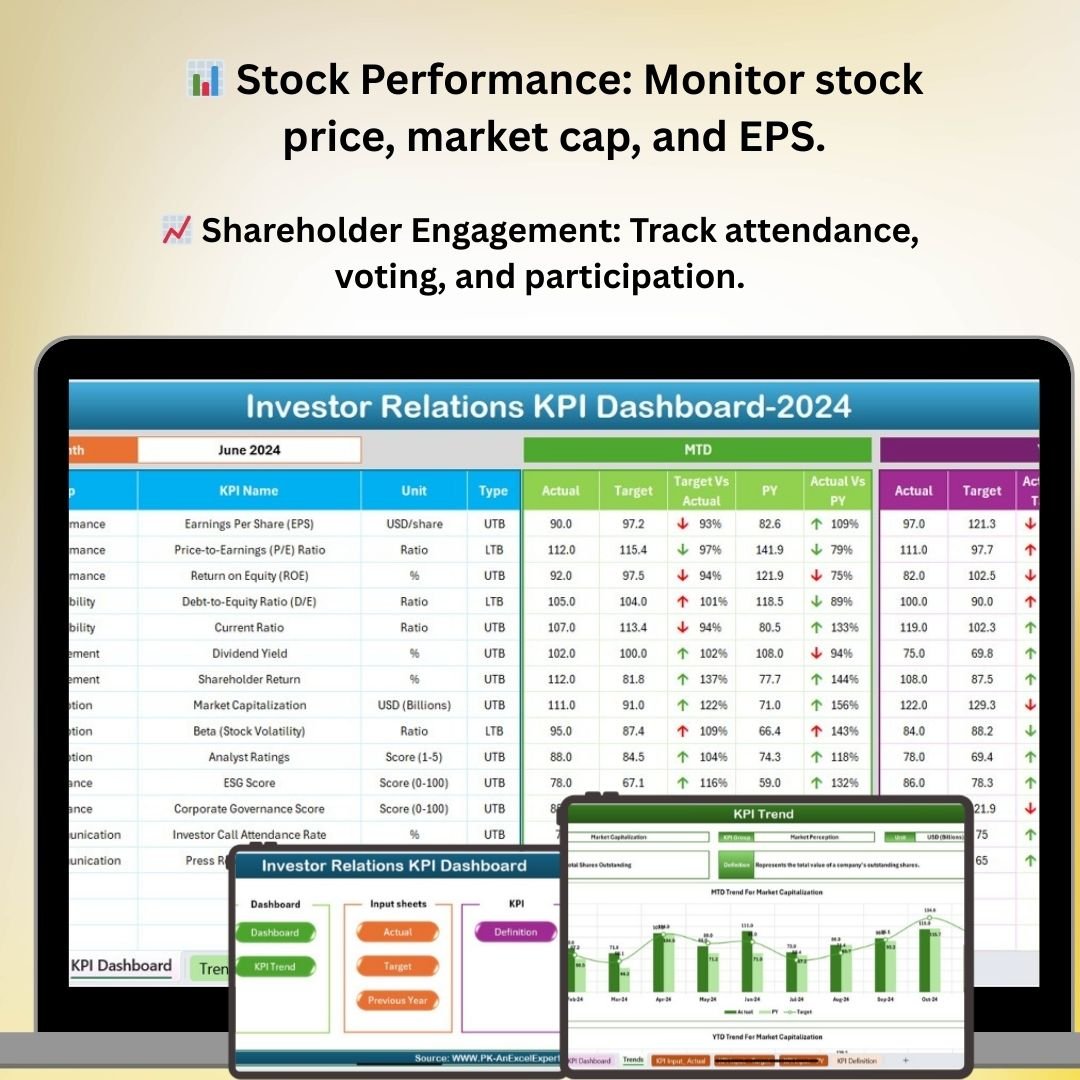

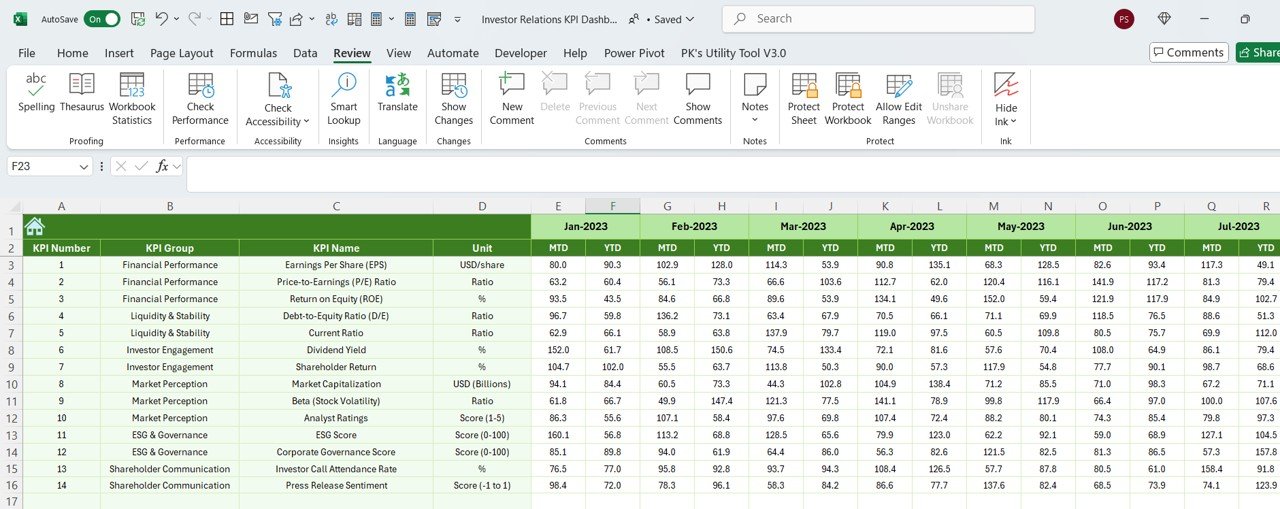
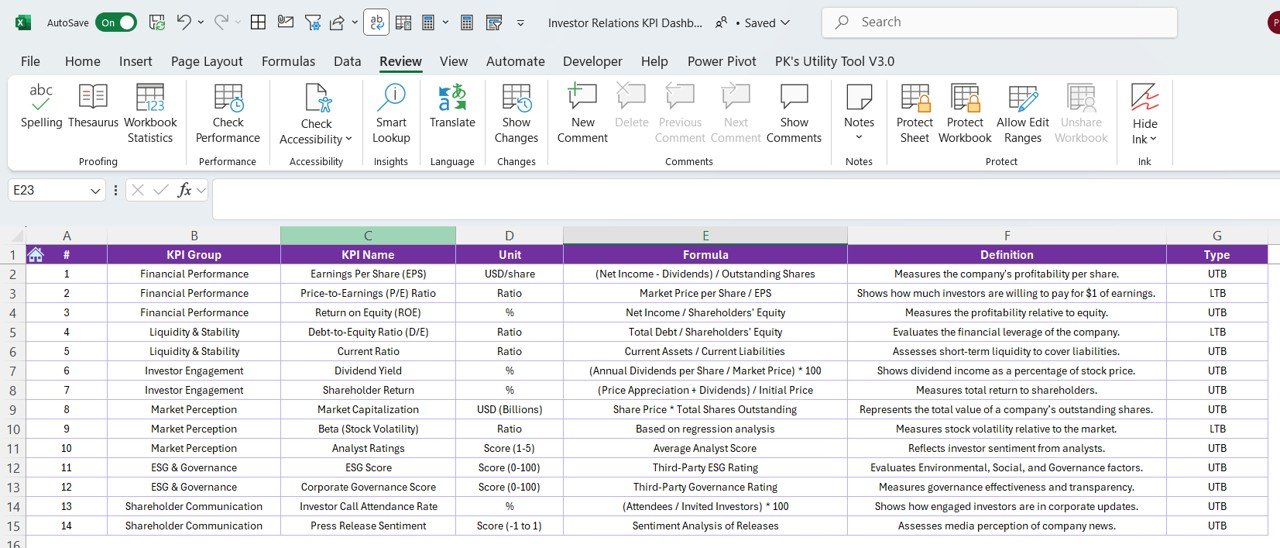

The Investor Relations KPI Dashboard in Excel is a comprehensive tool designed to help businesses manage and track key performance indicators (KPIs) related to investor relations. This Excel-based dashboard provides insights into critical metrics like shareholder performance, stock price trends, investor engagement, and overall financial health. By using this dashboard, investor relations teams, corporate executives, and financial analysts can make data-driven decisions to strengthen investor relations and enhance shareholder value.
Designed with easy-to-read visuals and real-time data integration, the dashboard helps businesses keep investors informed and engaged by providing transparency and detailed reports on performance metrics. This tool is perfect for improving communication with investors, ensuring transparency, and maximizing the effectiveness of your investor relations strategies.
Key Features of the Investor Relations KPI Dashboard in Excel
📊 Investor Engagement Tracking
Monitor key metrics related to investor engagement, such as shareholder voting, participation in meetings, and communication frequency. Track how actively your investors are involved with the company.
📈 Stock Price Performance Monitoring
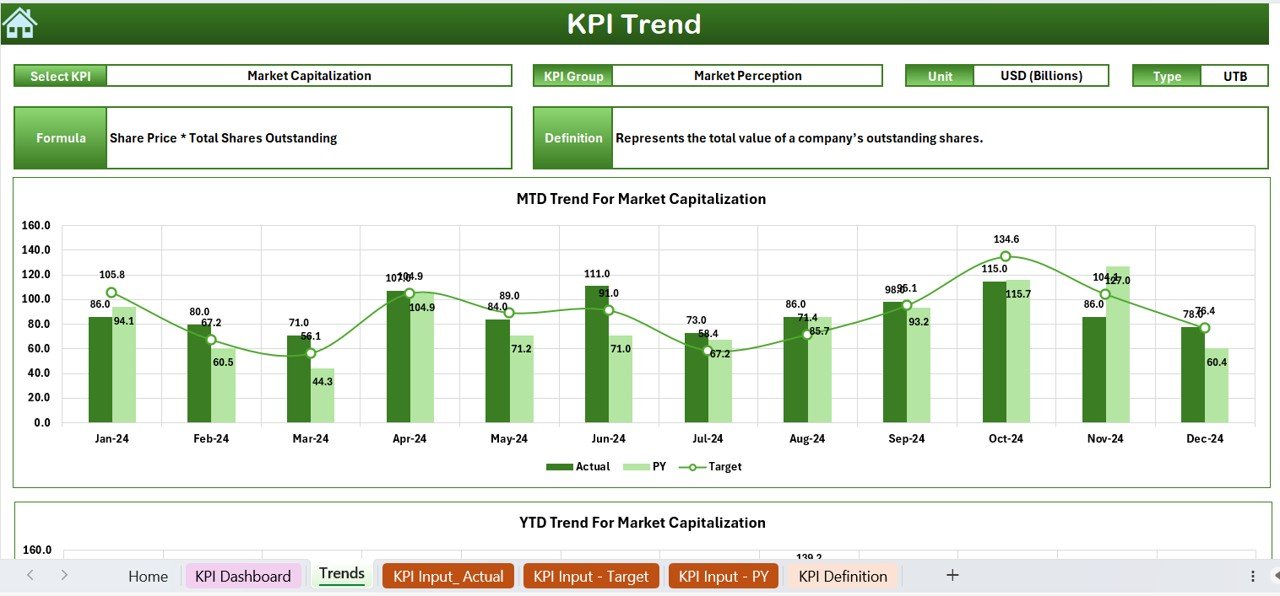
Track and visualize stock price trends over time. Compare performance against industry benchmarks and set targets to assess how well the stock is performing in the market.
📉 Dividend Performance & Returns
Monitor dividends, payout ratios, and total returns to gauge how effectively your company is rewarding investors. Ensure that dividends are aligned with investor expectations and profitability.
📅 Time-Based Performance Analysis
Track performance metrics over various periods—monthly, quarterly, or annually—to observe trends and make adjustments to your investor relations strategies.
⚙️ Customizable Metrics
Tailor the dashboard to include specific KPIs relevant to your organization’s investor relations goals. Add custom metrics, visualizations, and reports as needed to reflect the unique needs of your stakeholders.
🔑 Real-Time Data Integration
Integrate real-time financial data to get up-to-date insights into stock performance, dividends, and other key financial metrics. Ensure that you are always working with the most current data available.
Why You’ll Love the Investor Relations KPI Dashboard in Excel
✅ Comprehensive Investor Tracking
Keep track of key performance metrics related to your investor base, ensuring effective communication and engagement.
✅ Track Stock Price & Financial Health
Monitor stock performance and dividend returns in one place, allowing for quick adjustments in strategy to enhance investor value.
✅ Improve Investor Engagement
Measure investor engagement to identify opportunities for deeper engagement and more transparent communication.
✅ Make Informed, Data-Driven Decisions
Leverage real-time data and comprehensive performance metrics to make informed decisions that will positively impact investor relations and shareholder value.
✅ Customizable & Scalable
The dashboard can be tailored to fit the specific needs of your organization, making it suitable for businesses of all sizes. Whether you’re a small business or a large corporation, this tool can scale to meet your needs.
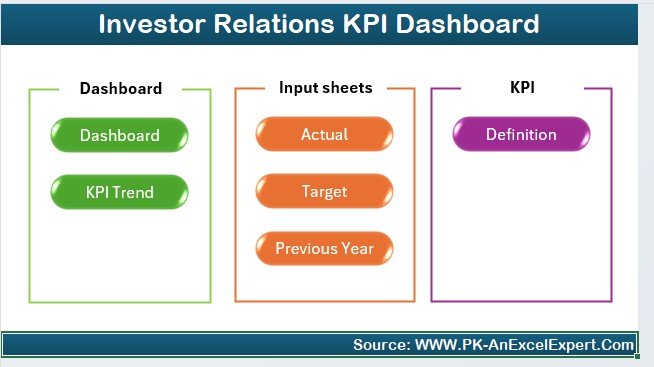
What’s Inside the Investor Relations KPI Dashboard in Excel?
- Investor Engagement Tracking: Measure how actively investors are engaging with the company.
- Stock Price & Performance Monitoring: Track stock price trends, performance against benchmarks, and set goals for improvement.
- Dividend & Return Analysis: Monitor dividends, returns, and payout ratios.
- Time-Based Performance Metrics: Track performance over different periods to identify trends.
- Real-Time Data Integration: Get real-time financial data for up-to-date insights.
- Customizable KPIs: Add and adjust metrics that suit your company’s goals.
How to Use the Investor Relations KPI Dashboard in Excel
1️⃣ Download the Template: Access the Investor Relations KPI Dashboard in Excel instantly.
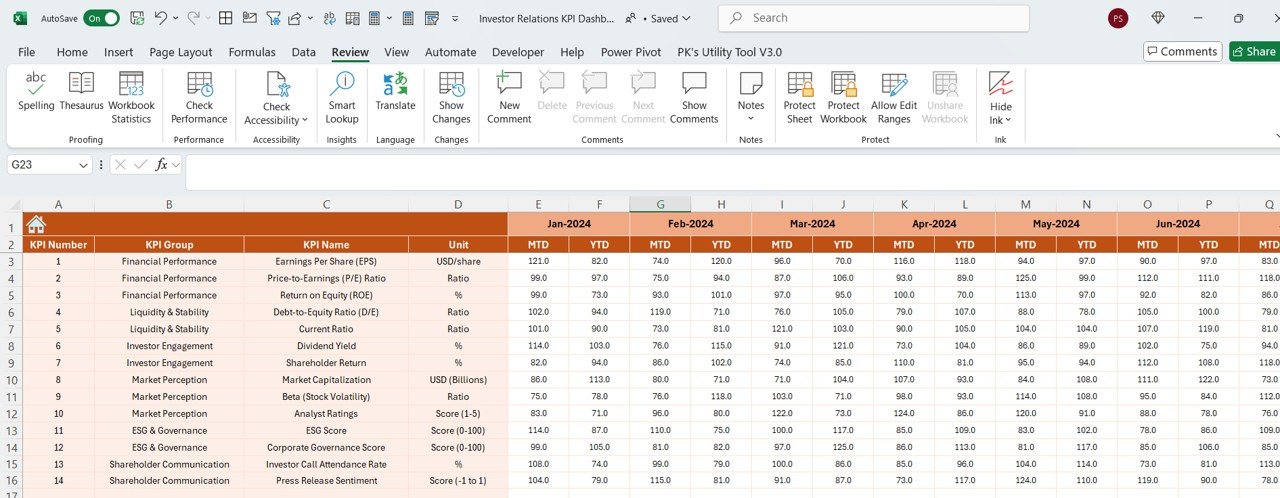
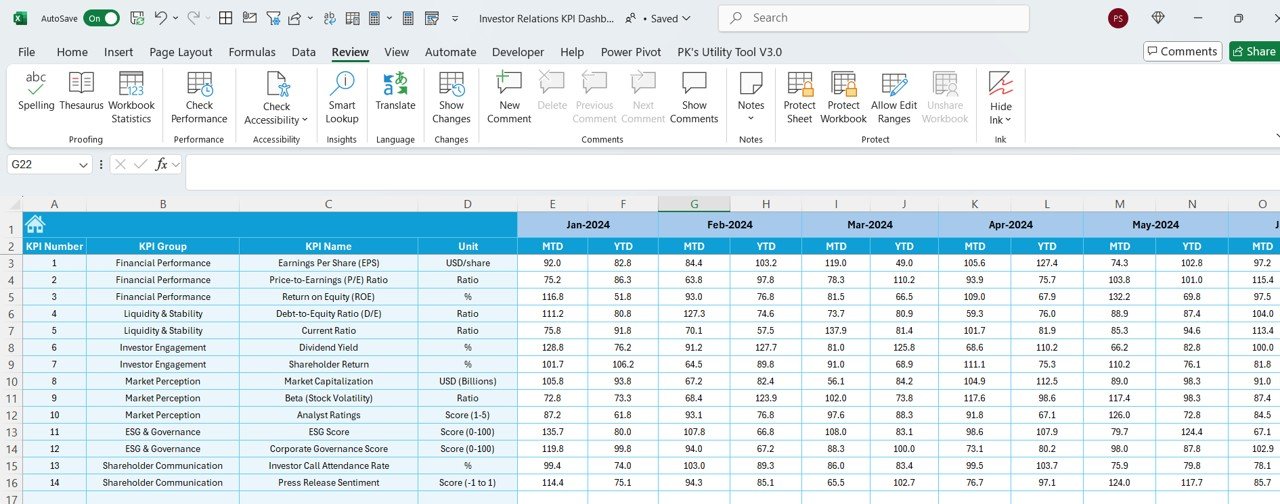
2️⃣ Integrate Financial Data: Link your data sources for real-time tracking of stock prices, dividends, and other KPIs.
3️⃣ Track Key Metrics: Monitor investor engagement, stock performance, and dividend performance in one place.
4️⃣ Analyze Trends & Make Adjustments: Use time-based performance analysis to make data-driven decisions.
5️⃣ Customize Metrics: Tailor the dashboard to include the specific KPIs that matter most to your business and stakeholders.
Who Can Benefit from the Investor Relations KPI Dashboard in Excel?
🔹 Investor Relations Teams & Managers
🔹 Corporate Executives & Board Members
🔹 Financial Analysts & Data Analysts
🔹 Small & Medium Enterprises (SMBs)
🔹 Large Corporations with Publicly Traded Stocks
🔹 Shareholder Relations Teams
🔹 Investor & Stakeholder Engagement Specialists
Improve your investor relations strategy and make data-driven decisions with the Investor Relations KPI Dashboard in Excel. Track key financial metrics, monitor stock performance, and engage with investors to maximize shareholder value and enhance corporate transparency.
Click here to read the Detailed blog post
Visit our YouTube channel to learn step-by-step video tutorials
Youtube.com/@PKAnExcelExpert














Reviews
There are no reviews yet.