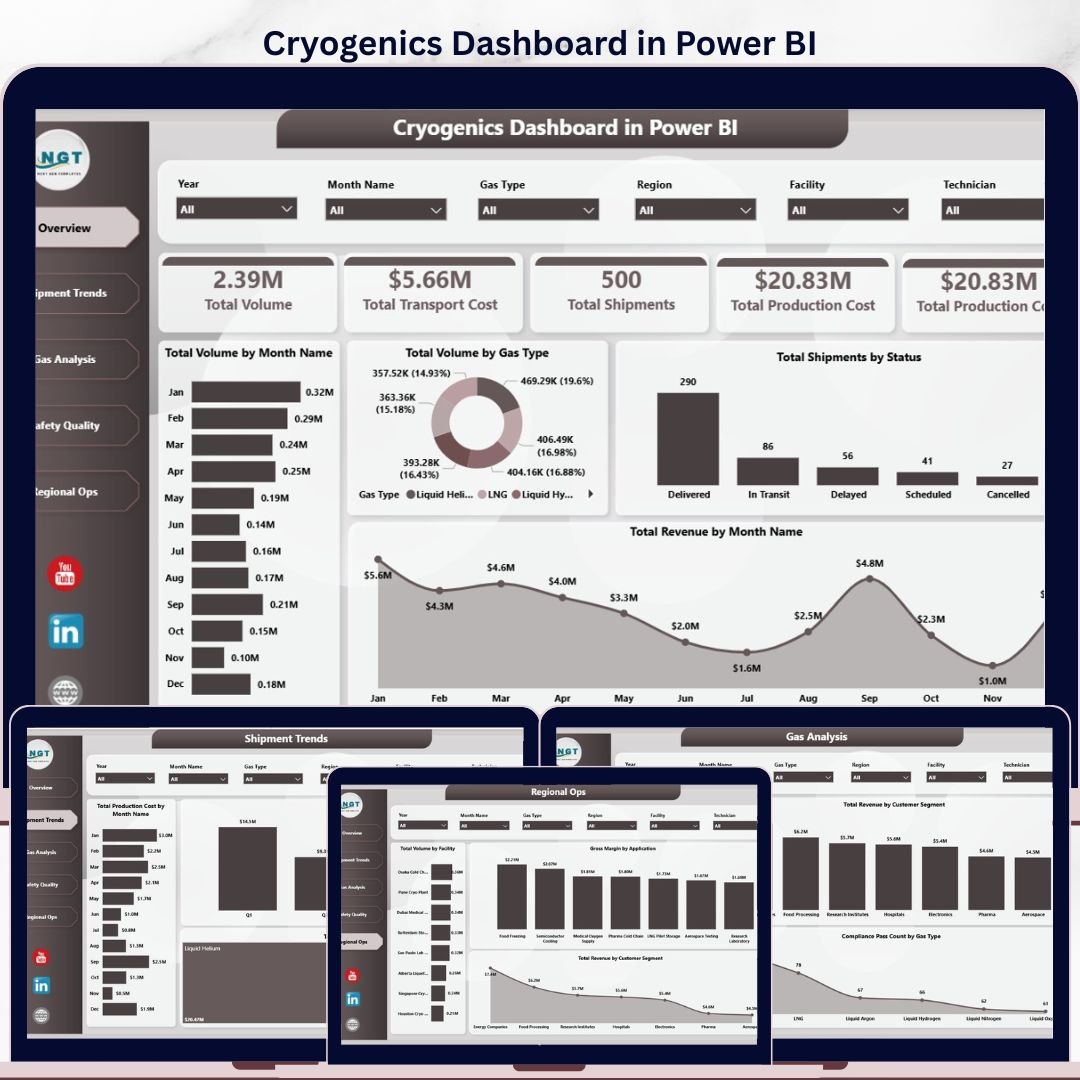
Cryogenics Dashboard in Power BI gives cryogenic gas distributors, industrial gas companies, facility leaders, safety teams, and operations analysts a ready-to-use .pbix report for monitoring gas volume, shipment cost, production cost, revenue, compliance, and regional performance. The dashboard includes 5 Power BI pages, executive KPI cards, 16+ analysis visuals, and slicers for fast filtering during monthly operating reviews. Join 8,400+ teams in 40+ countries using NextGenTemplates to replace scattered reports and expensive BI builds with one-time-purchase templates. Instant download, lifetime access, no subscription, and no per-user template fee.
Key Features of Cryogenics Dashboard in Power BI
- 5 interactive report pages: Overview, Shipment Trends, Gas Analysis, Safety Quality, and Regional Ops.
- Executive KPI cards: Track Total Volume, Total Transport Cost, Total Shipments, and Total Production Cost from the top of the Overview page.
- 16+ Power BI visuals: Review monthly volume, gas type mix, shipment status, revenue trends, compliance pass counts, technician cost, region revenue, and facility volume.
- Native slicer filtering: Filter the dashboard by gas type, month, quarter, region, facility, customer segment, shipment status, application, or compliance result.
- Built for Power BI Desktop: Open the .pbix file in the free Microsoft Power BI Desktop app, replace sample data, and refresh.
- Editable report design: Change colors, chart types, DAX measures, field names, pages, and branding to match your cryogenic operations workflow.
What’s Inside the Cryogenics Dashboard in Power BI
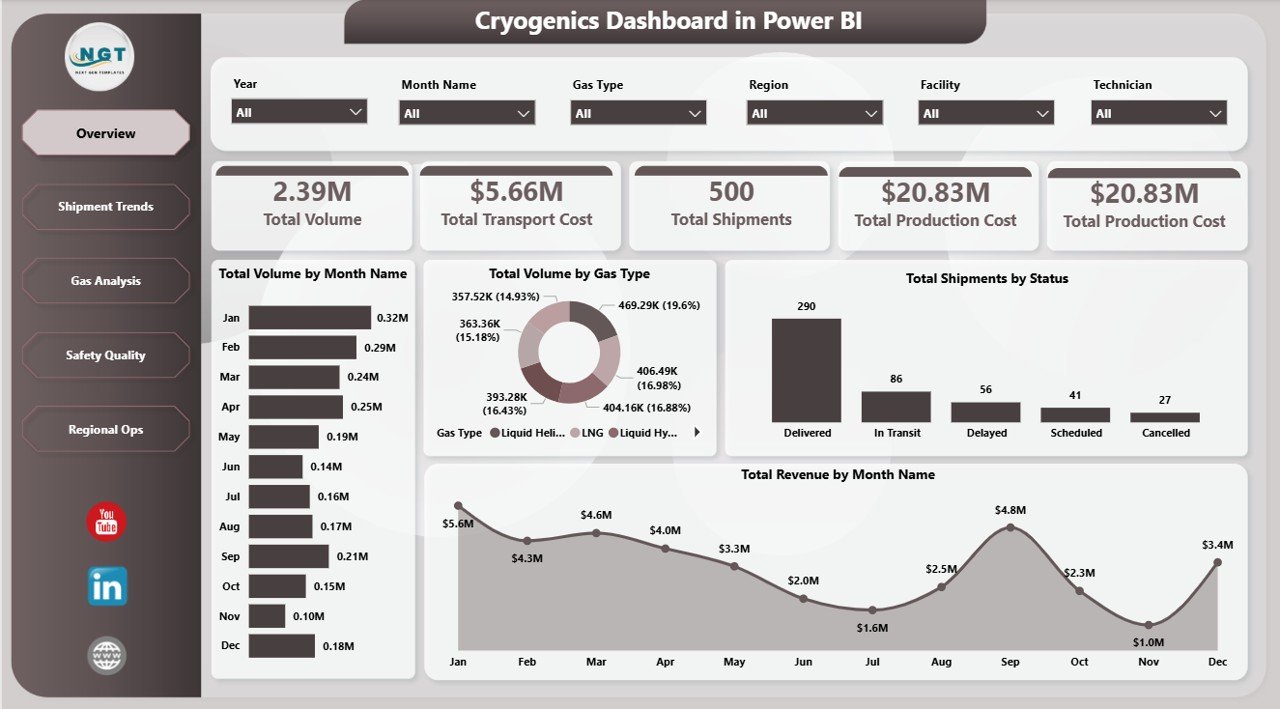
1. Overview Page
The Overview page gives leadership a high-level view of cryogenic operations. KPI cards summarize Total Volume, Total Transport Cost, Total Shipments, and Total Production Cost so managers can understand scale, cost, and shipment activity before drilling into page-level details.
Total Volume by Month Name shows how gas movement changes month by month. It helps operations teams identify seasonal demand, production load, and abnormal volume movement.
Total Volume by Gas Type compares shipped or produced volume across cryogenic gases. This makes it easier to see which gas types are driving operational workload and storage demand.
Total Shipments by Status breaks shipment records into status groups. Use it to monitor completed, pending, delayed, or cancelled shipments quickly.
Total Revenue by Month Name tracks revenue trends across the reporting period. Pair it with volume and cost visuals to see whether growth is margin-led or volume-led.
Cryogenics Dashboard in Power BI
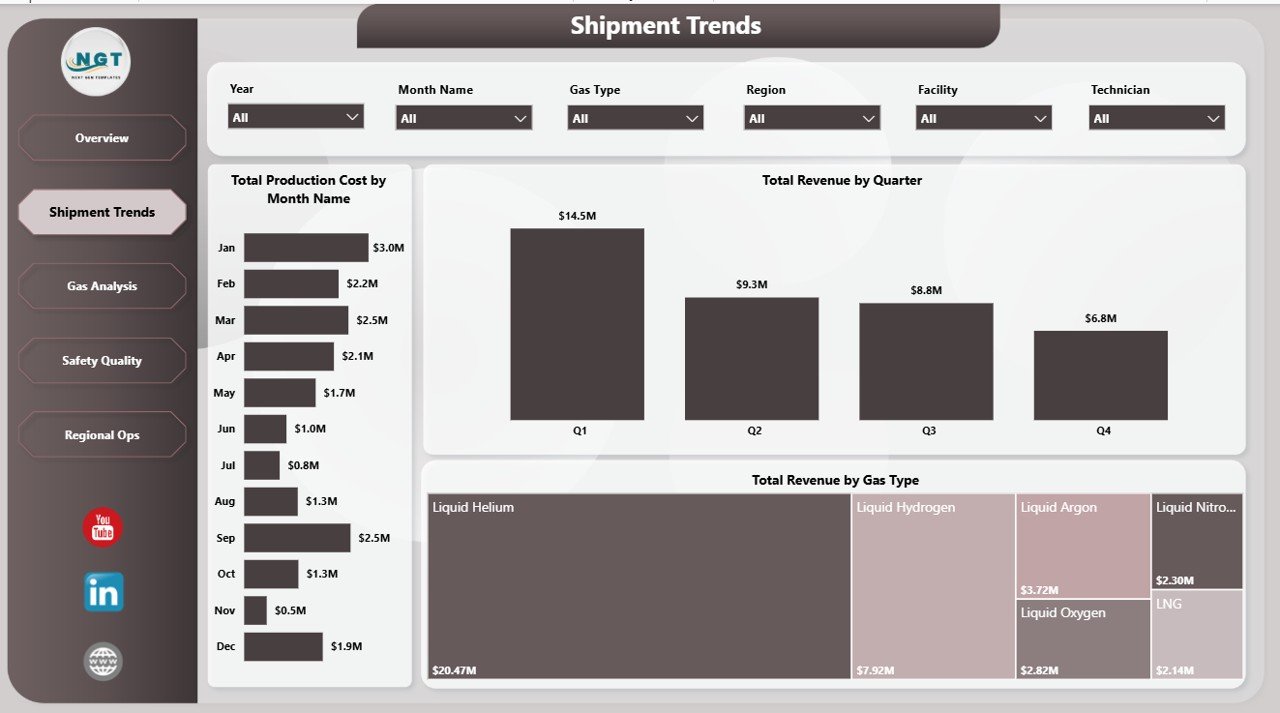
2. Shipment Trends
The Shipment Trends page focuses on cost and revenue movement over time. Total Production Cost by Month Name highlights monthly production cost patterns, Total Revenue by Quarter supports quarterly performance reviews, and Total Revenue by Gas Type shows which gas categories contribute the most value.
Shipment Trends
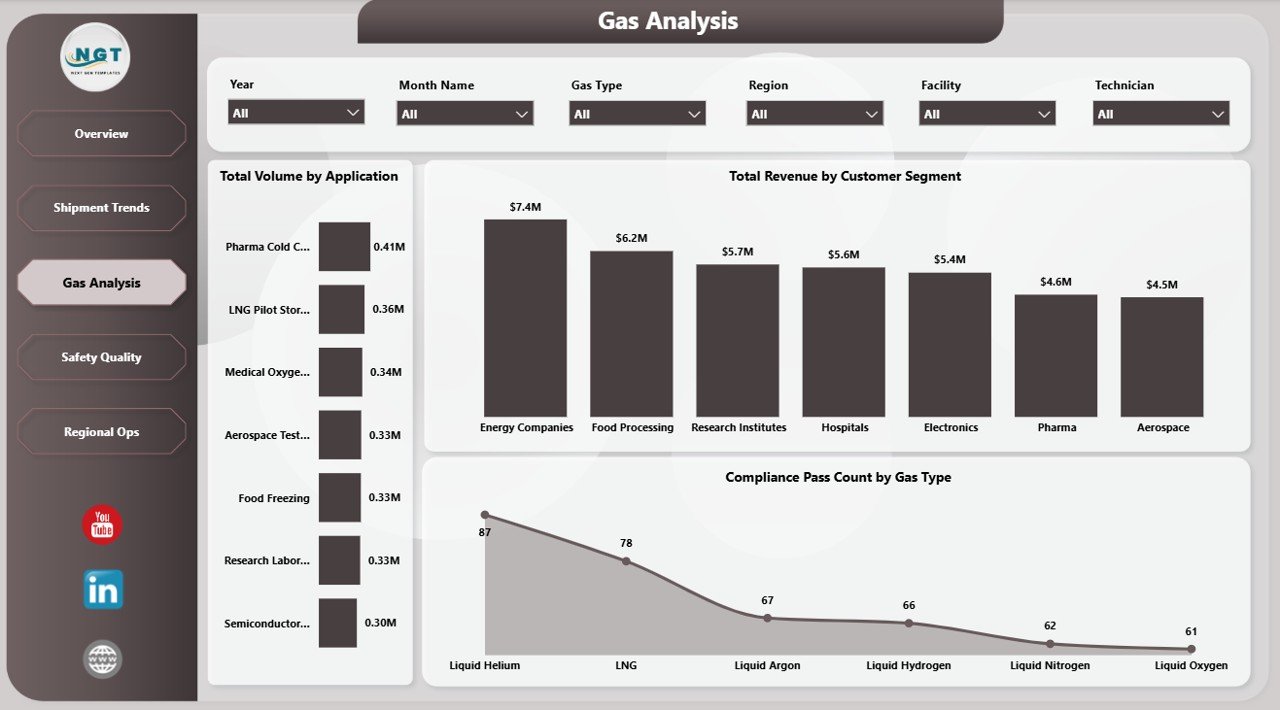
3. Gas Analysis
The Gas Analysis page explains demand, revenue, and compliance by gas usage patterns. Total Volume by Application reveals which applications consume the most gas, Total Revenue by Customer Segment shows customer mix, and Compliance Pass Count by Gas Type helps teams compare quality and compliance across gases.
Gas Analysis
4. Safety Quality
The Safety Quality page connects technician activity, compliance result, and regional revenue. Total Production Cost by Technician supports resource review, Gross Margin by Compliance Result shows the financial impact of pass/fail outcomes, and Total Revenue by Region keeps commercial performance visible beside quality data.
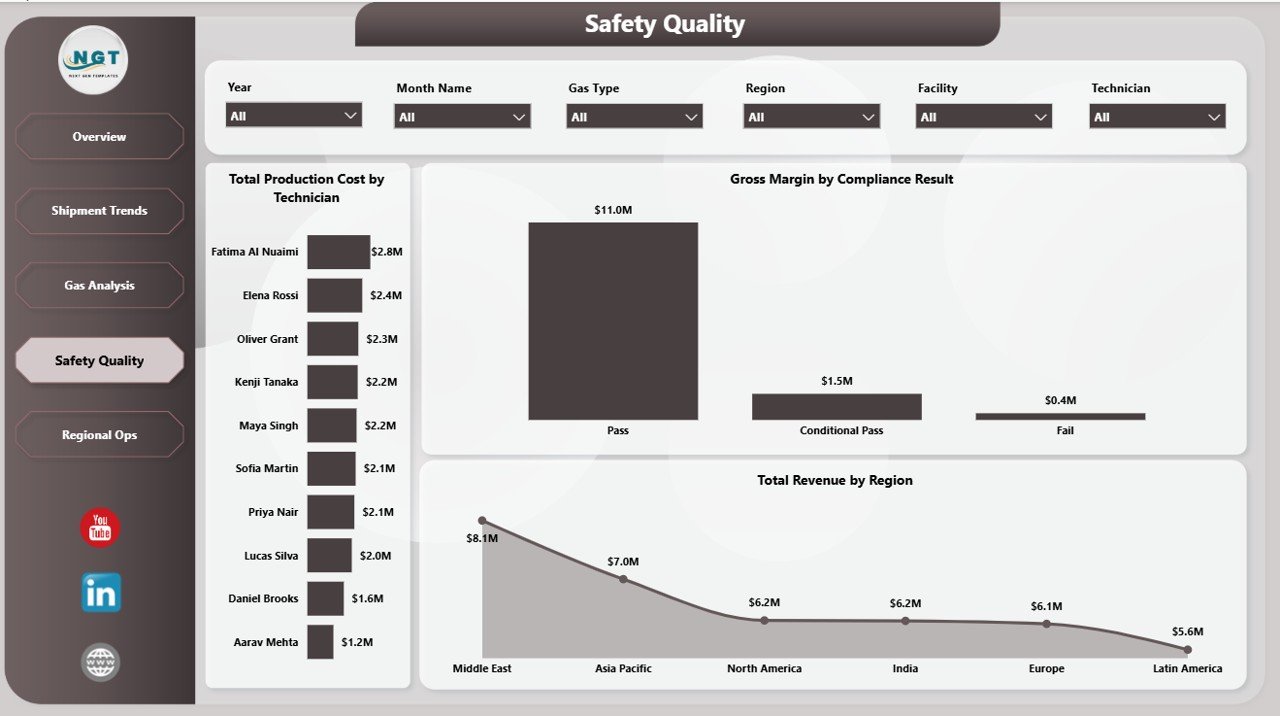
Safety Quality
5. Regional Ops
The Regional Ops page compares facility, application, and customer-segment performance. Total Volume by Facility shows where production or shipment activity is concentrated, Gross Margin by Application highlights profitable use cases, and Total Revenue by Customer Segment helps prioritize high-value customer groups.
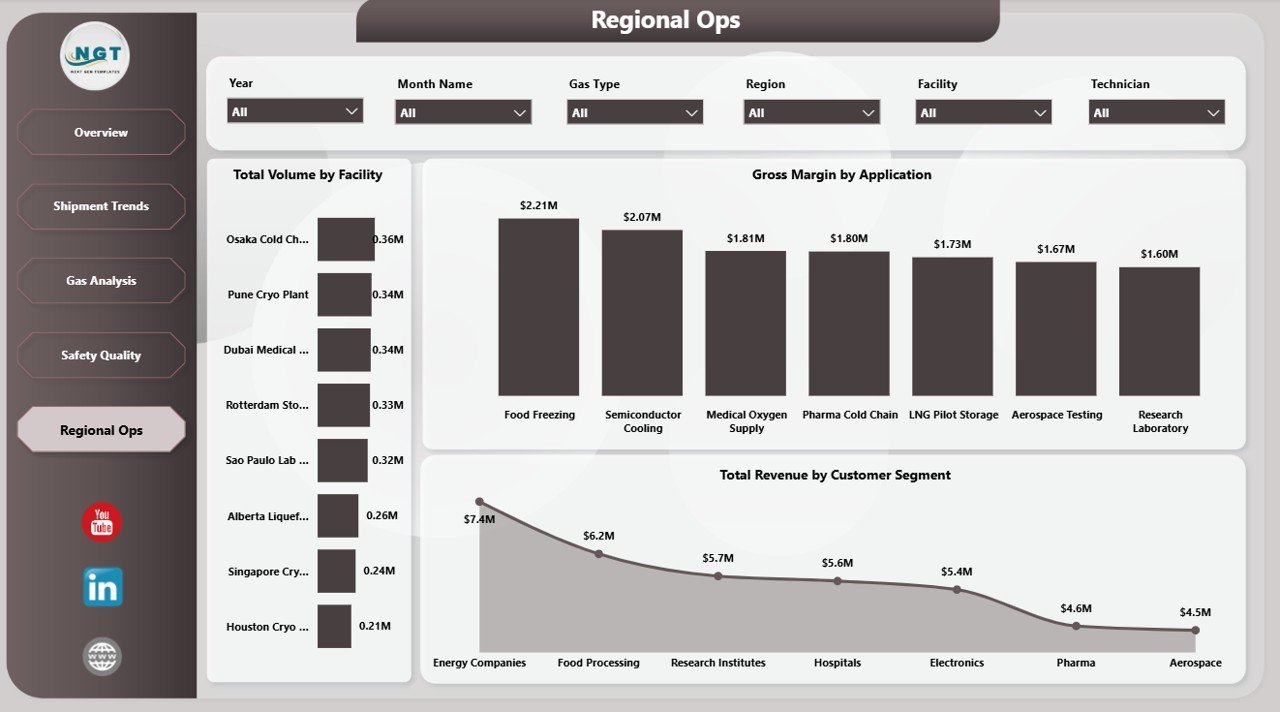
Regional Ops
Cryogenics Dashboard in Power BI vs. Tableau/Qlik vs. Paid Operations SaaS – Where This Fits
| Feature | This Power BI Dashboard | Tableau / Qlik Alternative | Paid Operations SaaS |
|---|---|---|---|
| Cost | $17.99 one-time | Monthly user license | Monthly or annual subscription |
| Platform | Power BI Desktop | Tableau or Qlik | Vendor cloud platform |
| Setup time | Open, connect data, refresh | Build visuals and data model | Configuration and onboarding |
| Mobile access | Available through Power BI Service | Available with paid plans | Usually included |
| Customizable fields | Fully editable .pbix | Fully editable if you build it | Depends on vendor |
| Year-1 cost at 5 users | $17.99 plus optional Power BI Pro | Often thousands of dollars | Often hundreds or thousands of dollars |
Who This Template Is For – and Who It’s Not For
This template is for industrial gas suppliers, cryogenic logistics teams, production planners, operations managers, quality teams, safety leaders, and finance analysts who want interactive Power BI reporting for gas volume, shipment status, production cost, revenue, compliance, and regional performance.
It is not a live SCADA, ERP, tank telemetry, dispatch optimization, or fleet-routing platform. If your team needs real-time sensor streaming or automated routing, use this dashboard as the reporting layer beside those operational systems.
How to Use the Cryogenics Dashboard in Power BI
- Download and unzip the product file.
- Open the .pbix file in Microsoft Power BI Desktop.
- Use Transform Data to point the report to your own Excel, CSV, database, or exported operations data.
- Keep the same column structure for the smoothest refresh.
- Click Refresh to update every page and visual.
- Use slicers to filter by gas type, month, facility, region, status, customer segment, application, and compliance result.
- Optionally publish to Power BI Service for controlled team access, scheduled refresh, and mobile viewing.
Real-World Use Cases
Ravi, Operations Manager: Ravi reviews Total Shipments by Status, Total Volume by Gas Type, and Total Transport Cost before the weekly dispatch meeting to spot delayed or high-cost shipment patterns.
Meera, Quality Lead: Meera uses Compliance Pass Count by Gas Type and Gross Margin by Compliance Result to prepare audit follow-ups and discuss failed batches with facility managers.
Daniel, Finance Analyst: Daniel compares Total Revenue by Quarter, Gross Margin by Application, and Total Revenue by Customer Segment before the quarterly business review.
Frequently Asked Questions
What KPIs are included?
The Overview page includes Total Volume, Total Transport Cost, Total Shipments, and Total Production Cost cards, with supporting visuals across shipment, gas, safety, quality, and regional pages.
Do I need a paid Power BI license?
No. You can open and edit the .pbix in Power BI Desktop, which is free from Microsoft. A Power BI Pro license is only needed if you publish to Power BI Service for sharing and scheduled refresh.
Can I use my own cryogenic gas data?
Yes. Replace the sample source with your own operations data and keep the expected field structure. After refresh, the visuals update automatically.
Can I customize the dashboard?
Yes. The .pbix file is editable, so you can change visuals, colors, field names, measures, slicers, and pages.
Is there an Excel version?
Yes. The related Cryogenics Dashboard in Excel is available for Excel-first teams.
About the Author
Built by PK – Microsoft Certified Professional with 15+ years of Excel, Google Sheets, and Power BI experience. Founder of NextGenTemplates, reaching 300K+ subscribers across YouTube channels. Every template is hand-built and tested before release.
Explore Related Templates
Browse more Power BI Dashboard Templates. Related picks include Cryogenics Dashboard in Excel, Oil and Gas Analysis Dashboard in Power BI, Oil and Gas Dashboard in Power BI, and Contract Manufacturing Dashboard in Power BI.
Ready to monitor cryogenic operations in Power BI? Download the Cryogenics Dashboard in Power BI, connect your data, refresh the model, and start reviewing volume, shipments, costs, revenue, compliance, and regional performance today.
Last updated: May 23, 2026
🔗 Click here to read the Detailed blog post


Reviews
There are no reviews yet.