


The Virtual Classrooms KPI Dashboard in Excel tracks 20+ virtual classroom KPIs across 7 interactive worksheets, with MTD and YTD trend charts, conditional formatting arrows, and month-based filtering. Setup takes under 10 minutes — enter your KPI definitions, input actual and target numbers, and the entire dashboard updates automatically.
🌍 Join 8,400+ teams in 40+ countries using NextGenTemplates to replace paid SaaS tools with one-time-purchase Excel, Google Sheets, Power BI, and HTML templates.
✅ Instant download · One-time payment · No subscription · No per-user fees · Lifetime access
🔑 Key Features of Virtual Classrooms KPI Dashboard in Excel
📌 Month-Based Dynamic Filtering – Select any month from a dropdown on the Dashboard sheet (range D3) and all MTD and YTD numbers refresh instantly across every KPI row. This Excel KPI Dashboard delivers real-time virtual classroom analytics without macros or VBA.
📌 MTD and YTD Comparison Engine – View Actual vs. Target and Actual vs. Previous Year side by side, with conditional formatting arrows (▲ green for favorable, ▼ red for unfavorable) that flag performance gaps at a glance across all virtual classroom metrics.
📌 KPI Trend Analysis with Charts – Select any KPI from a dropdown on the KPI Trend sheet (range C3) and view MTD and YTD trend lines for Actual, Target, and Previous Year — spot seasonal patterns and long-term shifts in student engagement, attendance rates, and course completion.
📌 Structured KPI Definition Library – Every KPI includes its group, unit, formula, definition, and direction type (LTB — Lower the Better, or UTB — Upper the Better). This ensures your entire team interprets and reports metrics consistently.
📌 Three Separate Input Sheets – Enter Actual numbers, Target numbers, and Previous Year numbers on dedicated worksheets. Change the starting month on range E1 and the entire year adjusts automatically. All KPI Dashboard Templates from NextGenTemplates follow this proven three-sheet input structure.
📌 Home Navigation Sheet – Jump to any worksheet using 6 interactive buttons — no scrolling through tabs needed, making it easy for non-technical users.
📌 No Macros, No Coding – Built entirely with Excel formulas (SUMIFS, INDEX-MATCH, IFERROR) so it works on Windows, Mac, and Excel Online without compatibility issues.
📦 What’s Inside the Virtual Classrooms KPI Dashboard
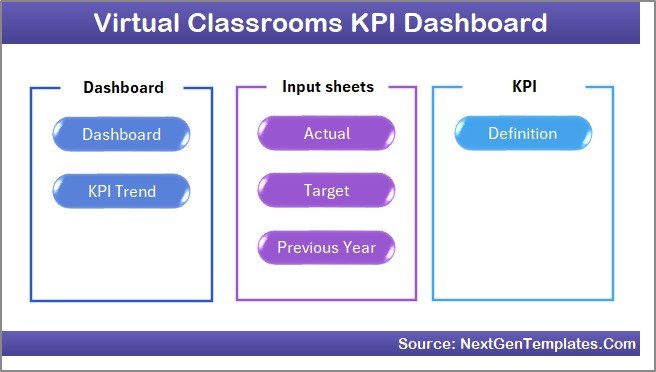
This ready-to-use Excel template contains 7 worksheets designed specifically for virtual classroom performance tracking:
📘 Home Sheet – Index page with 6 navigation buttons for instant access to every section of the dashboard.
 Home Page
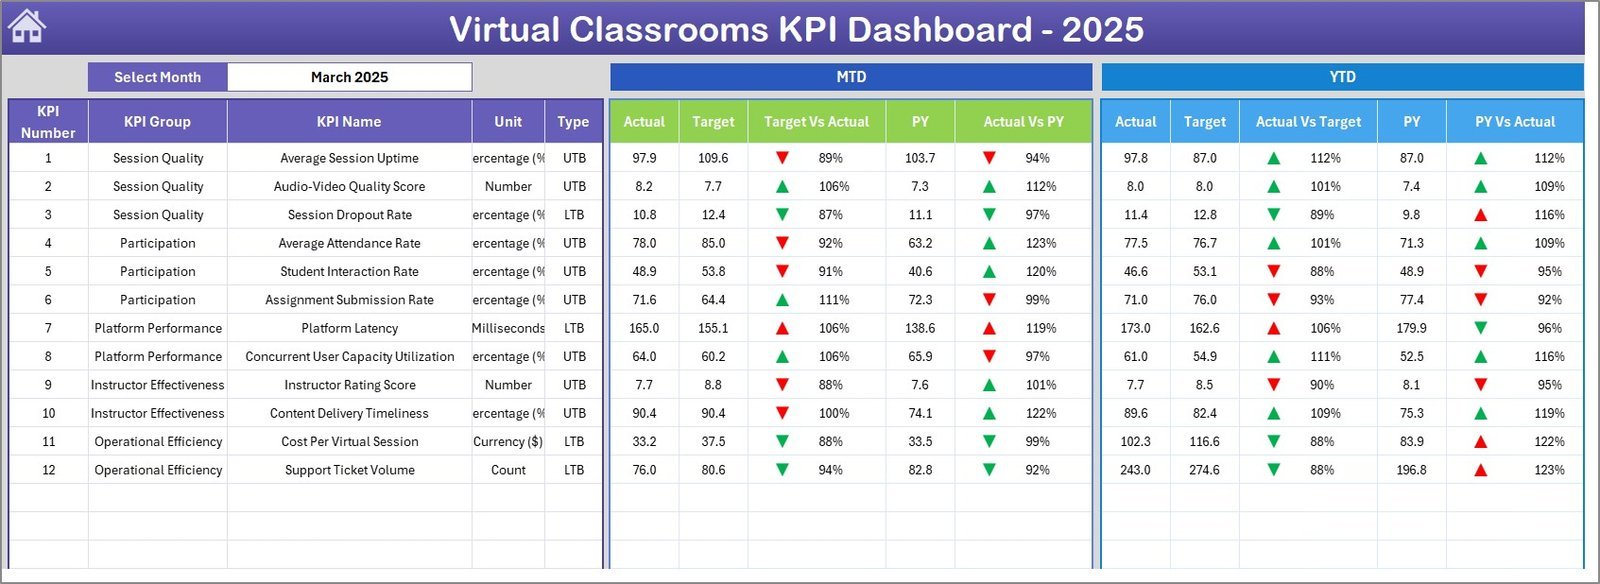
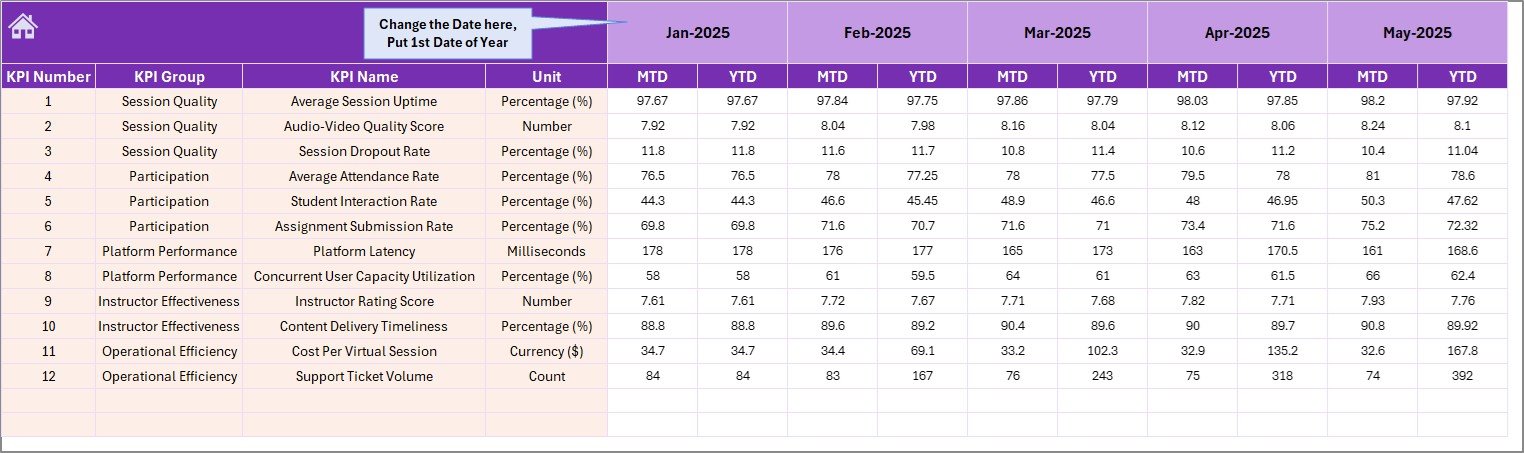
📘 Dashboard Sheet – Central performance view showing all KPIs with MTD Actual, Target, Previous Year plus YTD Actual, Target, Previous Year. Select any month from the dropdown on range D3 and all numbers update instantly. Conditional formatting arrows highlight favorable and unfavorable trends.
 Virtual Classrooms KPI Dashboard
📘 KPI Trend Sheet – Select any KPI from the dropdown on range C3 to view its KPI Group, Unit, Type (LTB/UTB), Formula, and Definition alongside MTD and YTD trend charts comparing Actual, Target, and Previous Year performance.
 KPI Trend Sheet
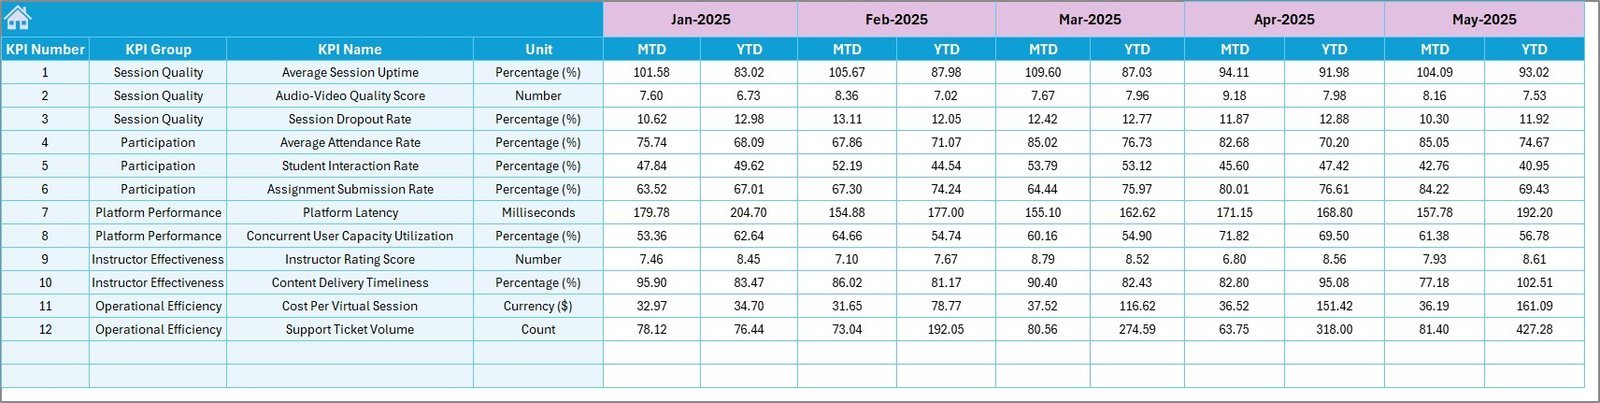
📘 Actual Numbers Input Sheet – Enter your actual MTD and YTD numbers for each KPI. Adjust the start month on range E1 to align with your fiscal or academic year.
 Actual Numbers Input Sheet
📘 Target Number Input Sheet – Set MTD and YTD targets for each KPI by month so the dashboard can calculate Target vs. Actual variances automatically.
 Target Number Input Sheet
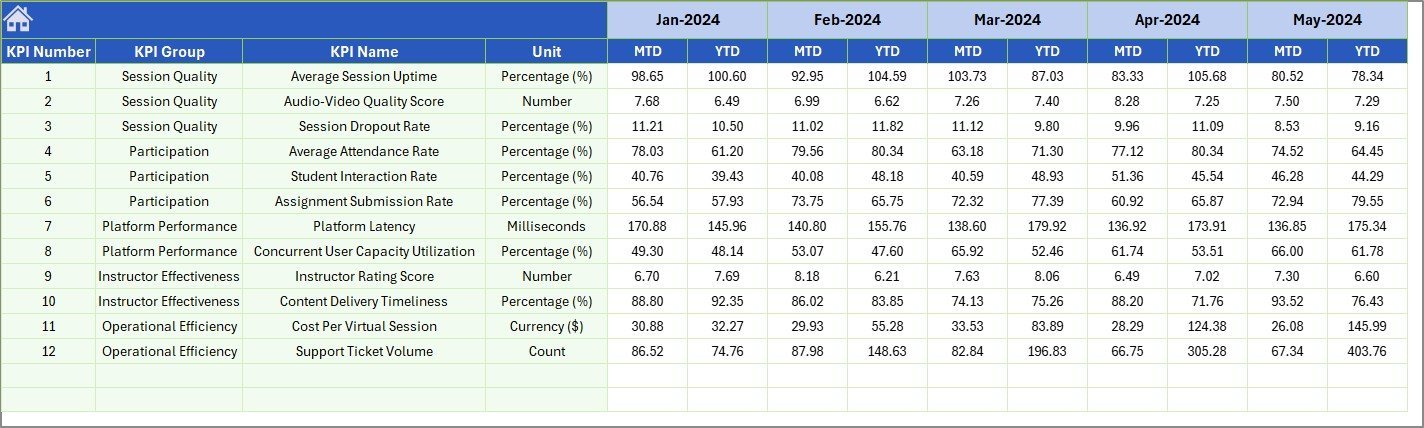
📘 Previous Year Number Sheet – Enter last year’s data in the same structure so the dashboard can compute year-over-year comparisons for every KPI.
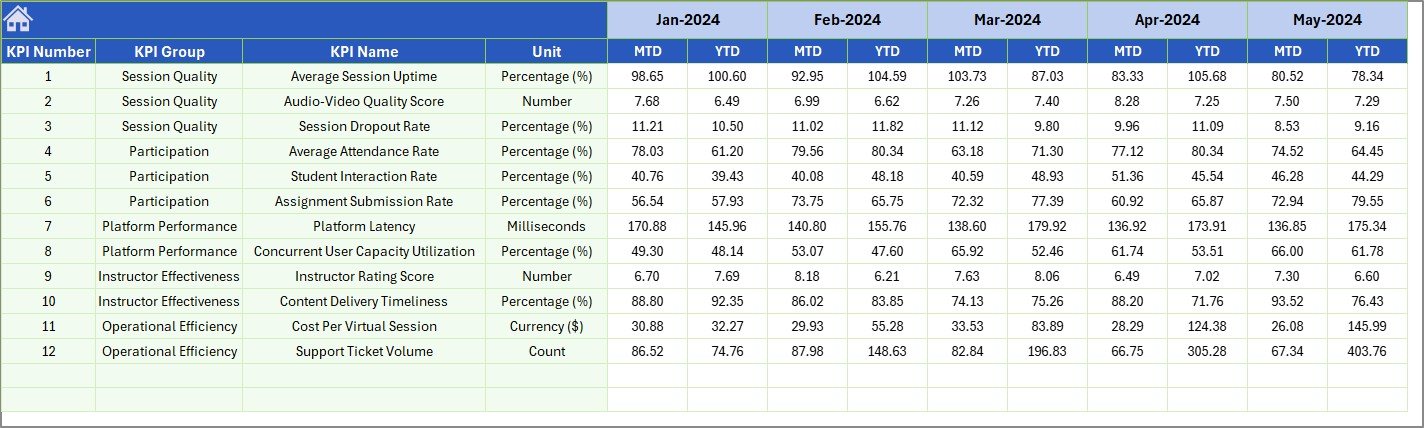 Previous Year Number Input Sheet
📘 KPI Definition Sheet – Define each KPI’s Name, Group, Unit, Formula, Definition, and Type (LTB or UTB). This sheet drives the KPI Trend sheet’s metadata display.
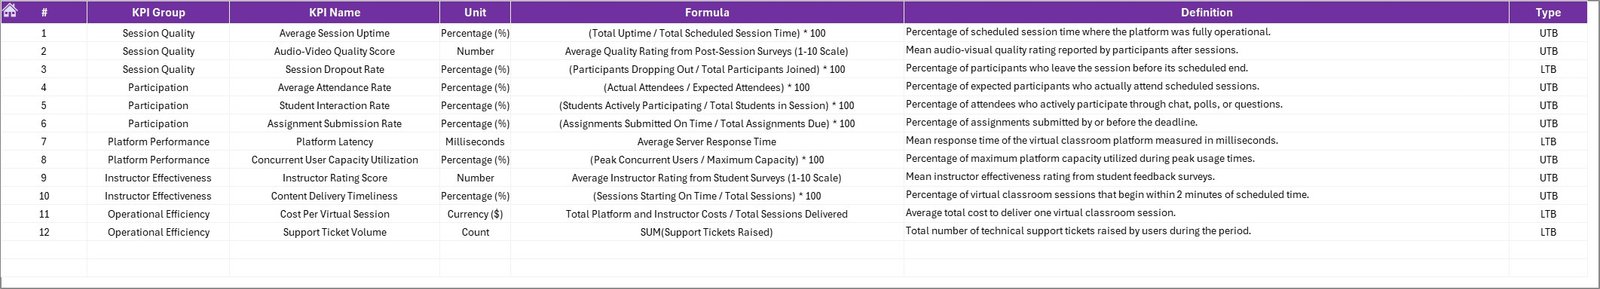 KPI Definition Sheet
📊 Virtual Classrooms KPI Dashboard vs. Google Sheets vs. Paid LMS Analytics — Where This Fits
| Feature | Virtual Classrooms KPI Dashboard (Excel) | Google Sheets Dashboard | Canvas LMS / Blackboard Analytics |
|---|---|---|---|
| Cost | $14.99 one-time ✅ | Free (manual setup) | $5,000–$50,000+/year |
| Platform | Microsoft Excel ✅ | Google Sheets | Web-based SaaS |
| Setup Time | Under 10 minutes ✅ | 2–5 hours (build from scratch) | Weeks (IT integration) |
| Real-time Collaboration | Via OneDrive/SharePoint | Built-in ✅ | Built-in ✅ |
| Customizable KPIs | Unlimited — add your own ✅ | Manual formulas needed | Limited to platform defaults |
| Offline Access | Full offline use ✅ | Limited offline | Requires internet |
| MTD/YTD with PY Comparison | Built-in ✅ | Manual setup | Varies by tier |
| Year-1 Cost (5 Users) | $14.99 total ✅ | $0 (but hours of setup) | $5,000–$50,000+ |
| Data Ownership | 100% yours ✅ | Google Cloud | Vendor-hosted |
For education teams that want structured KPI tracking without paying enterprise LMS fees, the Virtual Classrooms KPI Dashboard in Excel sits in the sweet spot.
👥 Who This Template Is For — and Who It’s Not For
✅ This template is built for:
- Virtual classroom coordinators and online education managers tracking student engagement, attendance, and completion rates
- EdTech startups and small LMS operators monitoring platform performance without enterprise analytics tools
- School administrators and training department heads reporting monthly KPIs to leadership or accreditation bodies
- Freelance online tutors and course creators tracking revenue, student satisfaction, and course completion
❌ This template is NOT for:
- Enterprise universities needing real-time LTI integration with Canvas, Moodle, or Blackboard — use native LMS analytics
- Organizations requiring automated data ingestion from multiple APIs — this template uses manual data entryVirtual Classrooms KPI Dashboard in Excel
⚙️ How to Use the Virtual Classrooms KPI Dashboard
1️⃣ Open the KPI Definition sheet and enter your virtual classroom KPIs with their group, unit, formula, definition, and type (LTB or UTB).
2️⃣ Go to the Actual Numbers Input sheet, set the start month on range E1, and enter your MTD and YTD actual numbers for each month.
3️⃣ Switch to the Target Number Input sheet and enter your monthly MTD and YTD targets for each KPI.
4️⃣ Fill in the Previous Year Number sheet with last year’s data in the same format.
5️⃣ Navigate to the Dashboard sheet, select any month from the dropdown on range D3, and view your complete virtual classroom performance summary with conditional formatting arrows.
6️⃣ Use the KPI Trend sheet to select individual KPIs and analyze their MTD and YTD trend charts against targets and previous year benchmarks.
💼 Real-World Use Cases
Priya manages virtual classrooms for a K-12 online school with 2,000 students. She uses the Virtual Classrooms KPI Dashboard to track monthly attendance rates, assignment submission rates, and student satisfaction scores across 15 virtual classrooms. Each month, she selects the current month on the Dashboard sheet and presents a one-page performance summary to the principal — replacing a 3-hour manual reporting process with a 10-minute data entry task.
James runs an EdTech startup offering live coding bootcamps. He tracks course completion rates, instructor ratings, and revenue per student using this dashboard. The KPI Trend sheet helps him spot that completion rates drop in Q3, so he adjusts his curriculum pacing before the fall cohort starts. The Previous Year comparison lets him prove 22% year-over-year growth to investors.
Dr. Anita heads faculty development at a community college. She monitors virtual workshop attendance, faculty certification completion, and student feedback scores using the KPI tracking framework in this dashboard. The LTB/UTB classification on each KPI ensures her team knows whether a rising number is good or bad for each metric.
❓ Frequently Asked Questions
What KPIs does the Virtual Classrooms KPI Dashboard track?
The Virtual Classrooms KPI Dashboard in Excel tracks any KPI you define — student attendance, course completion, instructor ratings, revenue per session, dropout rates, and more. You enter KPI names, groups, units, and formulas on the KPI Definition sheet and the dashboard builds around them automatically.
Does this dashboard work on Mac and Excel Online?
Yes. The Virtual Classrooms KPI Dashboard uses only standard Excel formulas (no macros or VBA), so it runs on Windows, Mac, and Excel Online without compatibility issues. You can also share it via OneDrive or SharePoint for team access.
How long does setup take?
Setup takes under 10 minutes. Enter your KPI definitions, input your actual and target numbers, and the Dashboard and KPI Trend sheets populate automatically with charts, conditional formatting arrows, and MTD/YTD comparisons.Virtual Classrooms KPI Dashboard in Excel
Can I add more KPIs to this dashboard?
Yes. Add new rows to the KPI Definition sheet and corresponding rows to the Actual, Target, and Previous Year input sheets. The Dashboard and KPI Trend sheets will include the new KPIs automatically through the dropdown selections.Virtual Classrooms KPI Dashboard in Excel
How does this compare to Canvas or Blackboard analytics?
Canvas and Blackboard analytics cost $5,000–$50,000+ per year and require IT integration. The Virtual Classrooms KPI Dashboard in Excel costs $14.99 one-time, works offline, and lets you define custom KPIs that match your specific virtual classroom metrics — without vendor lock-in.Virtual Classrooms KPI Dashboard in Excel
Can I track multiple virtual classrooms in one dashboard?
The dashboard tracks KPIs at an aggregate level across your virtual classroom operation. For individual classroom-level tracking, you can create separate copies of the template or add classroom-specific KPI rows to the definition sheet.
Is previous year comparison built in?
Yes. The Virtual Classrooms KPI Dashboard includes a dedicated Previous Year Number sheet. Enter last year’s data and the Dashboard sheet automatically shows PY vs. Actual variance with conditional formatting arrows for every KPI, both MTD and YTD.
👤 About the Author
Built by PK — Microsoft Certified Professional with 15+ years of Excel, Google Sheets, and Power BI experience. Founder of NextGenTemplates, reaching 300K+ subscribers across YouTube channels (@PK-AnExcelExpert, @NextGenTemplates, @NeoTechNavigators). Every template is hand-built and tested before release.
🔗 Explore Related Templates
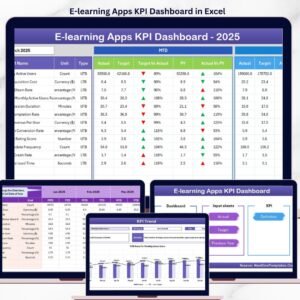
📌 E-learning Apps KPI Dashboard in Excel – Track e-learning platform KPIs including enrollments, engagement, and content performance.
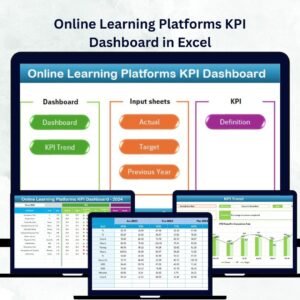
📌 Online Learning Platforms KPI Dashboard in Excel – Monitor student progress, instructor metrics, and financial KPIs for LMS platforms.
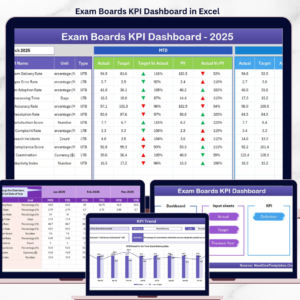
📌 Exam Boards KPI Dashboard in Excel – Track examination performance, pass rates, and assessment quality metrics.
📌 Educational NGOs KPI Dashboard in Excel – Monitor education program impact, beneficiary metrics, and funding utilization.
Browse all KPI Dashboard Templates on NextGenTemplates.
📖 Click here to read the Detailed Blog Post
🎥 Visit our YouTube channel for step-by-step video tutorials
👉 YouTube.com/@NextGenTemplates


Reviews
There are no reviews yet.