

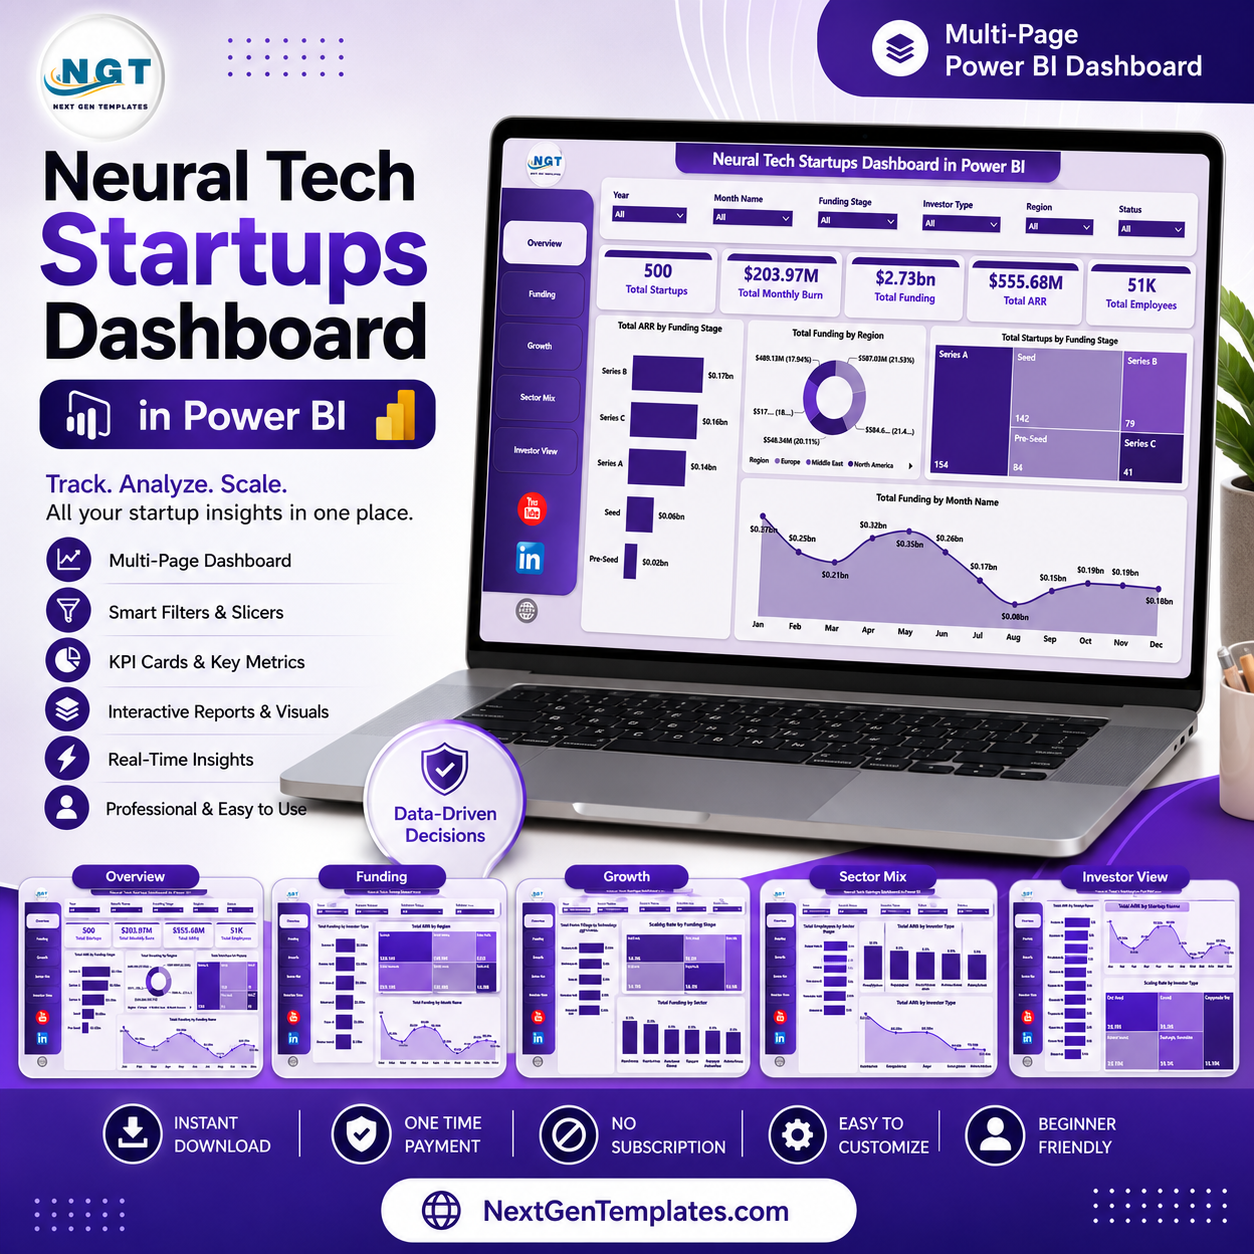
Neural Tech Startups Dashboard in Power BI is a ready-to-use Power BI dashboard template for AI founders, startup finance teams, venture analysts, accelerators, incubators, innovation hubs, and portfolio managers who need quick visibility into funding, ARR, burn, employees, regions, sectors, investor types, funding stages, patents, and scaling performance. The report includes 5 Power BI pages, 5 executive KPI cards, 16 focused charts, and multiple slicers for fast filtering. Built by PK, a Microsoft Certified Professional with 15+ years of Excel, Google Sheets, and Power BI experience and 300K+ subscribers across YouTube channels, this template gives you a one-time downloadable reporting asset instead of a recurring analytics subscription.
Key Features of Neural Tech Startups Dashboard in Power BI
- 5 Power BI pages: Overview Page, Funding, Growth, Sector Mix, and Investor View.
- 5 headline KPI cards: Total Startups, Total Monthly Burn, Total Funding, Total ARR, and Total Employees.
- 16 startup analytics visuals: Analyze funding stage, region, month, investor type, sector, technology focus, startup name, and scaling rate.
- Interactive slicers: Filter the report quickly for investor reviews, board updates, accelerator reporting, and portfolio analysis.
- Editable Power BI file: Open the .pbix file in Power BI Desktop and replace sample data with your own startup records.
What’s Inside the Neural Tech Startups Dashboard in Power BI
1 – Overview Page
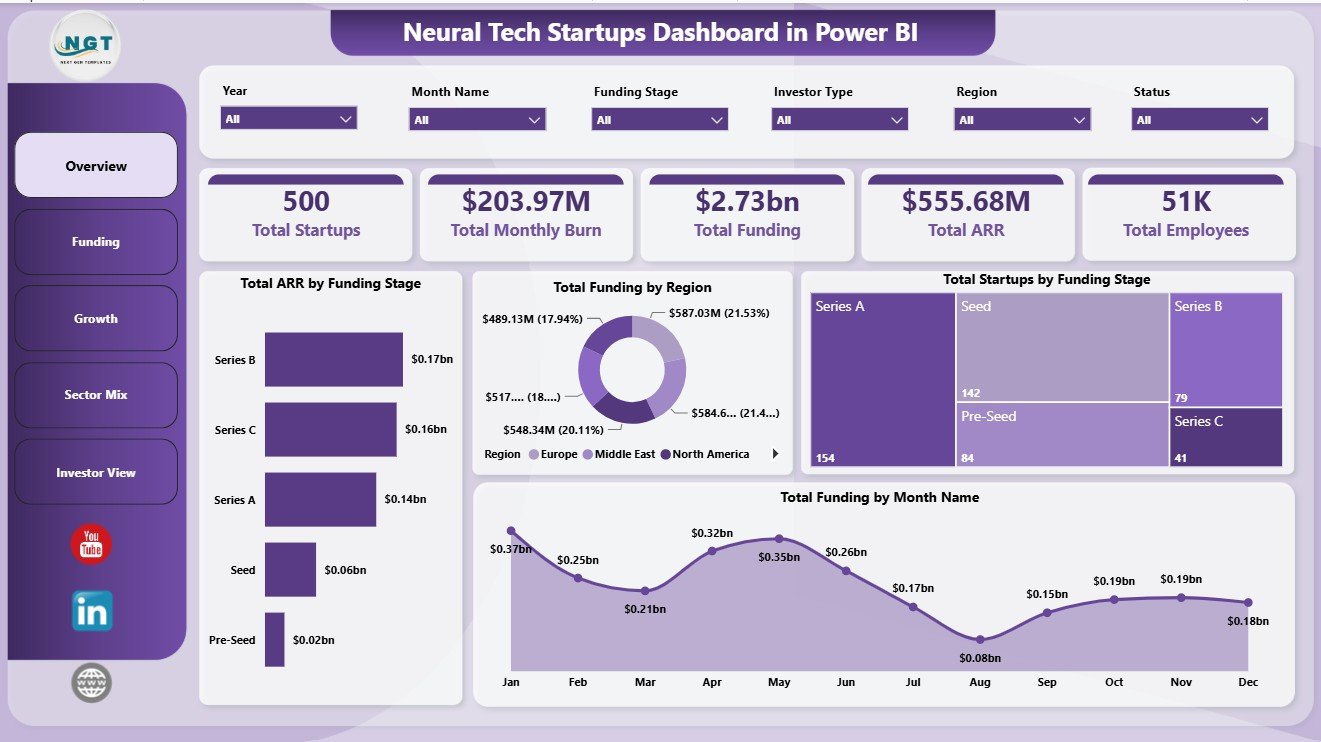
The Overview Page shows high-level startup portfolio performance with KPI cards for Total Startups, Total Monthly Burn, Total Funding, Total ARR, and Total Employees. These cards help users check portfolio size, cash pressure, fundraising scale, recurring revenue, and workforce footprint before reviewing the detailed pages.
Total ARR by Funding Stage: This chart compares recurring revenue across funding stages. It helps users understand whether later-stage startups are producing stronger ARR than early-stage companies.
Total Funding by Region: This visual compares total funding across regions. It helps investors and accelerators identify which geographies are attracting more capital.
Total Startups by Funding Stage: This chart shows how many startups sit in each funding stage. It helps users understand portfolio maturity and stage concentration.
Total Funding by Month Name: This trend view shows funding movement by month. It helps teams spot seasonal funding patterns and months with stronger capital inflow.
2 – Funding
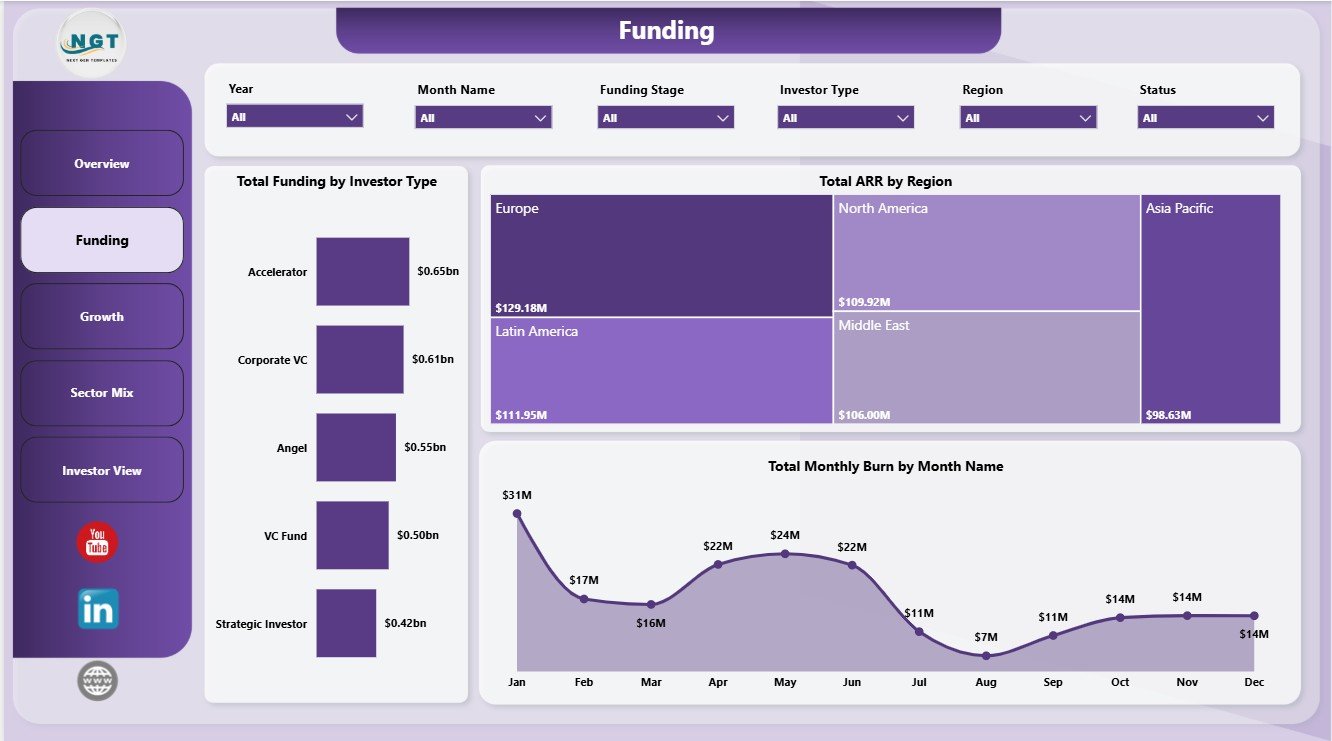
The Funding page is designed for capital mix, regional performance, and burn-rate monitoring.
Total Funding by Investor Type: This chart compares capital by investor group. It helps users see whether funding is driven by venture capital, angel investors, corporate investors, grants, or other investor sources.
Total ARR by Region: This visual compares recurring revenue by geography. It helps identify regions where startups are showing stronger commercial traction.
Total Monthly Burn by Month Name: This chart tracks burn over time. It helps founders and analysts monitor spending pressure and runway risk.
3 – Growth
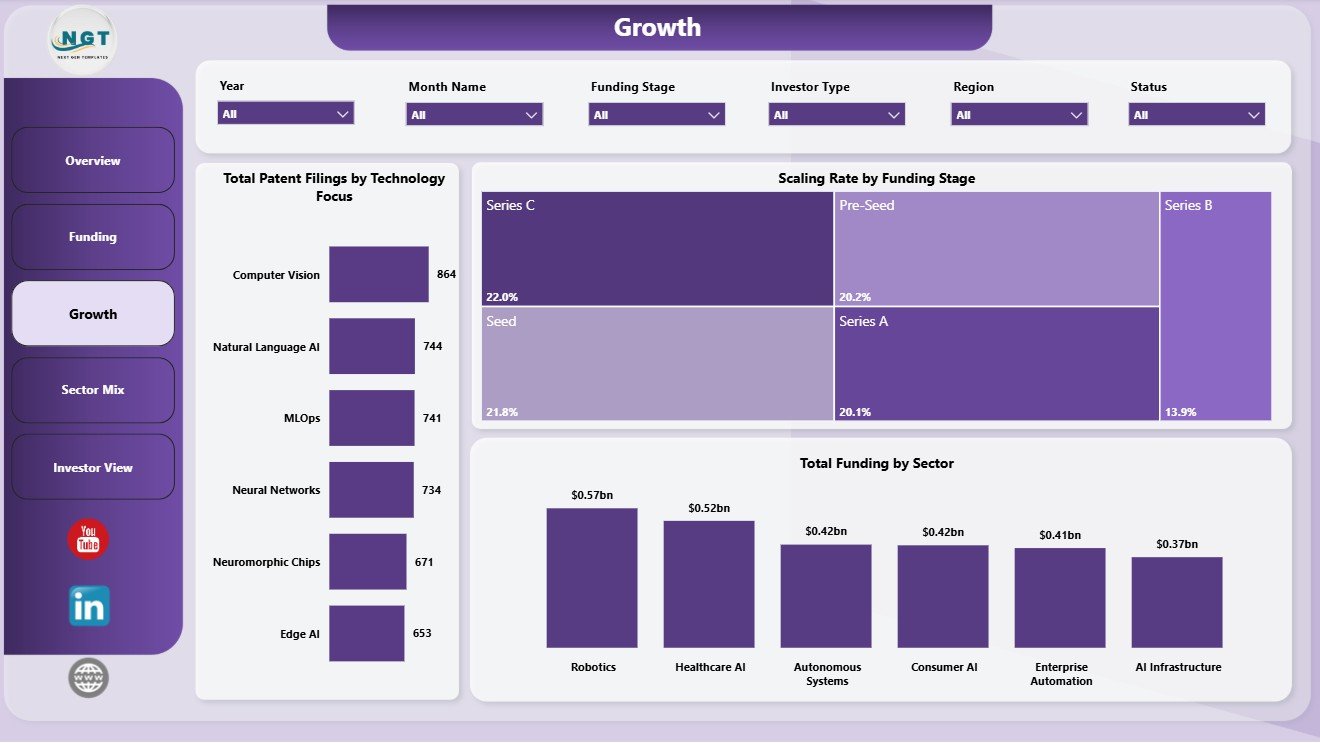
The Growth page connects technology focus, funding stage, and sector performance to help users review scale signals.
Total Patent Filings by Technology Focus: This chart compares patent activity across technology focus areas. It highlights where innovation output is strongest.
Scaling Rate by Funding Stage: This visual compares scaling performance by stage. It helps teams check whether growth-stage companies are scaling faster than earlier-stage startups.
Total Funding by Sector: This chart compares sector-level funding. It helps investors understand which market segments are receiving the most capital.
4 – Sector Mix
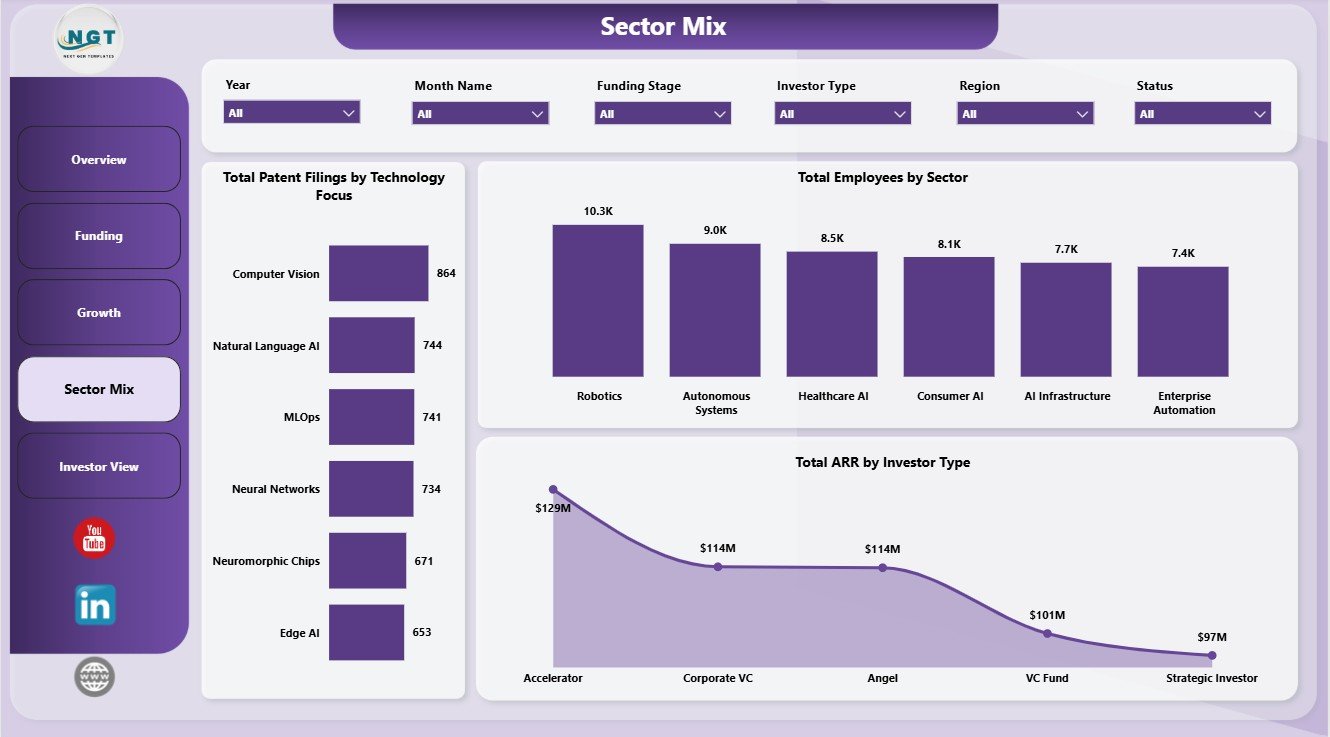
The Sector Mix page explains portfolio composition by technology, sector, employees, and investor type.
Total Patent Filings by Technology Focus: This chart shows where intellectual property activity is concentrated. It helps teams compare innovation depth across neural tech focus areas.
Total Employees by Sector: This visual compares workforce size by sector. It helps users identify which sectors have the largest operating footprint.
Total ARR by Investor Type: This chart links recurring revenue with investor categories. It helps users see which investor groups are backing stronger ARR companies.
5 – Investor View
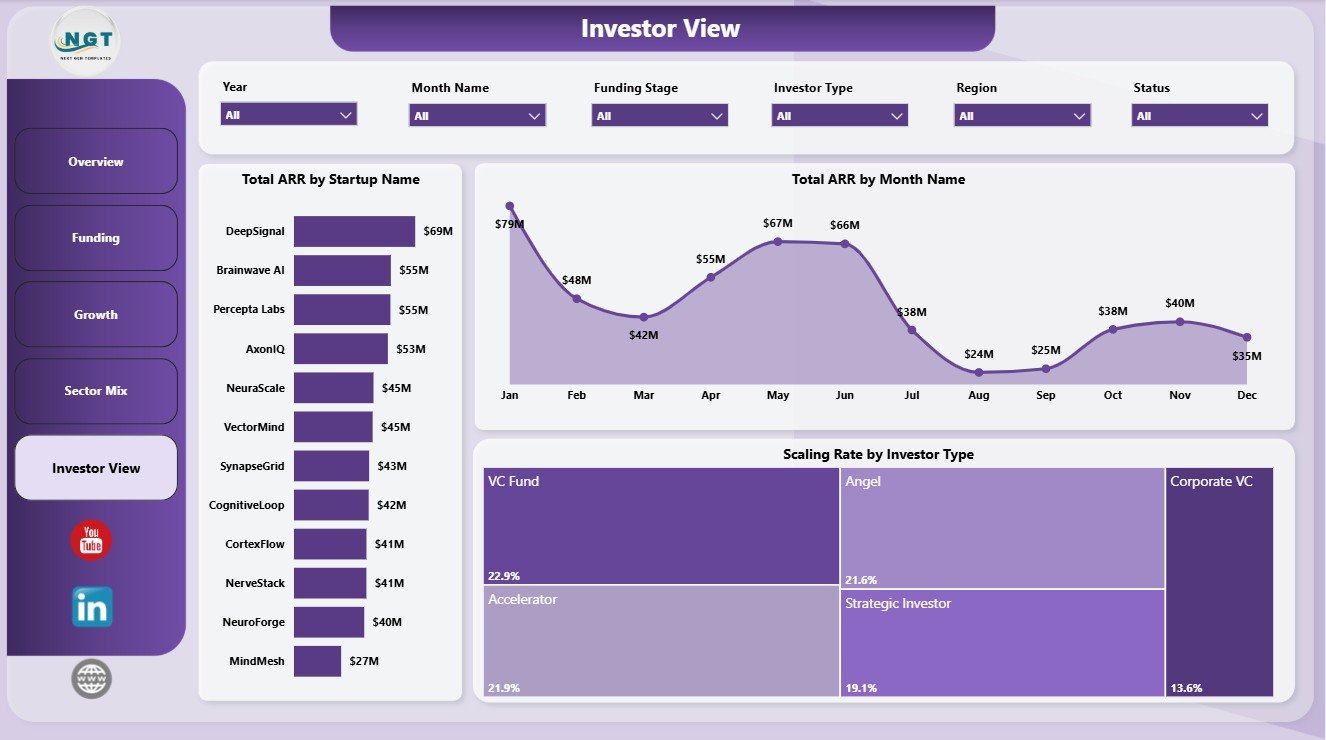
The Investor View page is built for investor-facing review and startup-level revenue comparison.
Total ARR by Startup Name: This chart ranks startups by ARR. It helps investors identify the strongest revenue generators in the portfolio.
Total ARR by Month Name: This trend view shows recurring revenue movement by month. It helps users monitor whether ARR is growing, flat, or declining over time.
Scaling Rate by Investor Type: This chart compares scale performance by investor category. It helps teams understand whether certain investor types are associated with stronger scaling outcomes.
Neural Tech Startups Dashboard in Power BI vs. Tableau vs. Paid Startup CRM/SaaS – Where This Fits
| Feature | This Power BI dashboard | Tableau alternative | Paid startup CRM/SaaS |
|---|---|---|---|
| Cost | $17.99 sale price, one-time | Requires Tableau setup and licensing | Recurring subscription |
| Platform | Power BI Desktop / Power BI Service | Tableau Desktop / Cloud | Vendor-hosted platform |
| Setup time | Open .pbix, connect/replace data, refresh | Build or adapt workbook | Implementation and onboarding |
| Customizable fields | Edit visuals, model, measures, and source tables | Editable with Tableau knowledge | Limited by plan and admin rights |
| Year-1 cost at 5 users | $17.99 plus Microsoft licensing if needed | Usually higher software cost | Often hundreds or thousands |
| Startup analytics | Funding, ARR, burn, employees, sectors, stages, regions, investors, patents, and scaling views included | Must be built or adapted | Depends on modules purchased |
Who This Template Is For – and Who It’s Not For
This template is for AI startup founders, neural tech operators, venture analysts, accelerator managers, incubator teams, innovation hubs, research commercialization offices, and portfolio finance teams that need a clean Power BI reporting file.
It is not a cap table system, investor CRM, accounting package, payroll system, legal diligence workspace, or automated fundraising database. It works best when startup data is already available in structured rows and columns.
How to Use the Neural Tech Startups Dashboard in Power BI
- Download and unzip the template package.
- Open the .pbix file in Power BI Desktop.
- Replace the sample data or connect your own startup data source.
- Refresh the report and check each page.
- Use slicers to filter by region, funding stage, sector, investor type, month, technology focus, and startup name.
Real-World Use Cases
Anika, accelerator program manager: reviews funding, employees, ARR, burn, patent filings, and sector mix before preparing a cohort update.
Marcus, venture analyst: compares ARR by startup, funding by region, and scaling rate by investor type before building an investment shortlist.
Dev, neural tech founder: uses the Overview and Funding pages during board updates to explain capital raised, burn movement, ARR, and team growth.
Frequently Asked Questions
What does this Power BI dashboard track?
It tracks startups, monthly burn, funding, ARR, employees, funding stage, region, investor type, sector, patent filings, technology focus, scaling rate, startup name, and month-level trends.
Do I need Power BI Desktop?
Yes. Open the .pbix file in Power BI Desktop, which is available from Microsoft.
Can I replace the sample data?
Yes. Replace or connect your own structured startup dataset, then refresh the report.
Is this a subscription?
No. It is a one-time downloadable Power BI dashboard template from NextGenTemplates.
Does it include CRM automation?
No. This is an analytics dashboard, not a CRM or investor workflow automation tool.
About the Author
Built by PK – Microsoft Certified Professional with 15+ years of Excel, Google Sheets, and Power BI experience. Founder of NextGenTemplates, reaching 300K+ subscribers across YouTube channels. Every template is hand-built and tested before release.
Explore Related Templates
- Neural Tech Startups Dashboard in Excel
- Geothermal Energy Dashboard in Power BI
- Knowledge Hubs Dashboard in Power BI
- Browse Power BI templates
- Browse Power BI dashboard templates
Download the Neural Tech Startups Dashboard in Power BI and start reviewing startup funding, ARR, burn, employees, patents, sectors, investor types, regions, funding stages, and scaling performance in one Power BI report.
Last updated: July 11, 2026.
Watch the step-by-step video tutorial:

































Reviews
There are no reviews yet.