

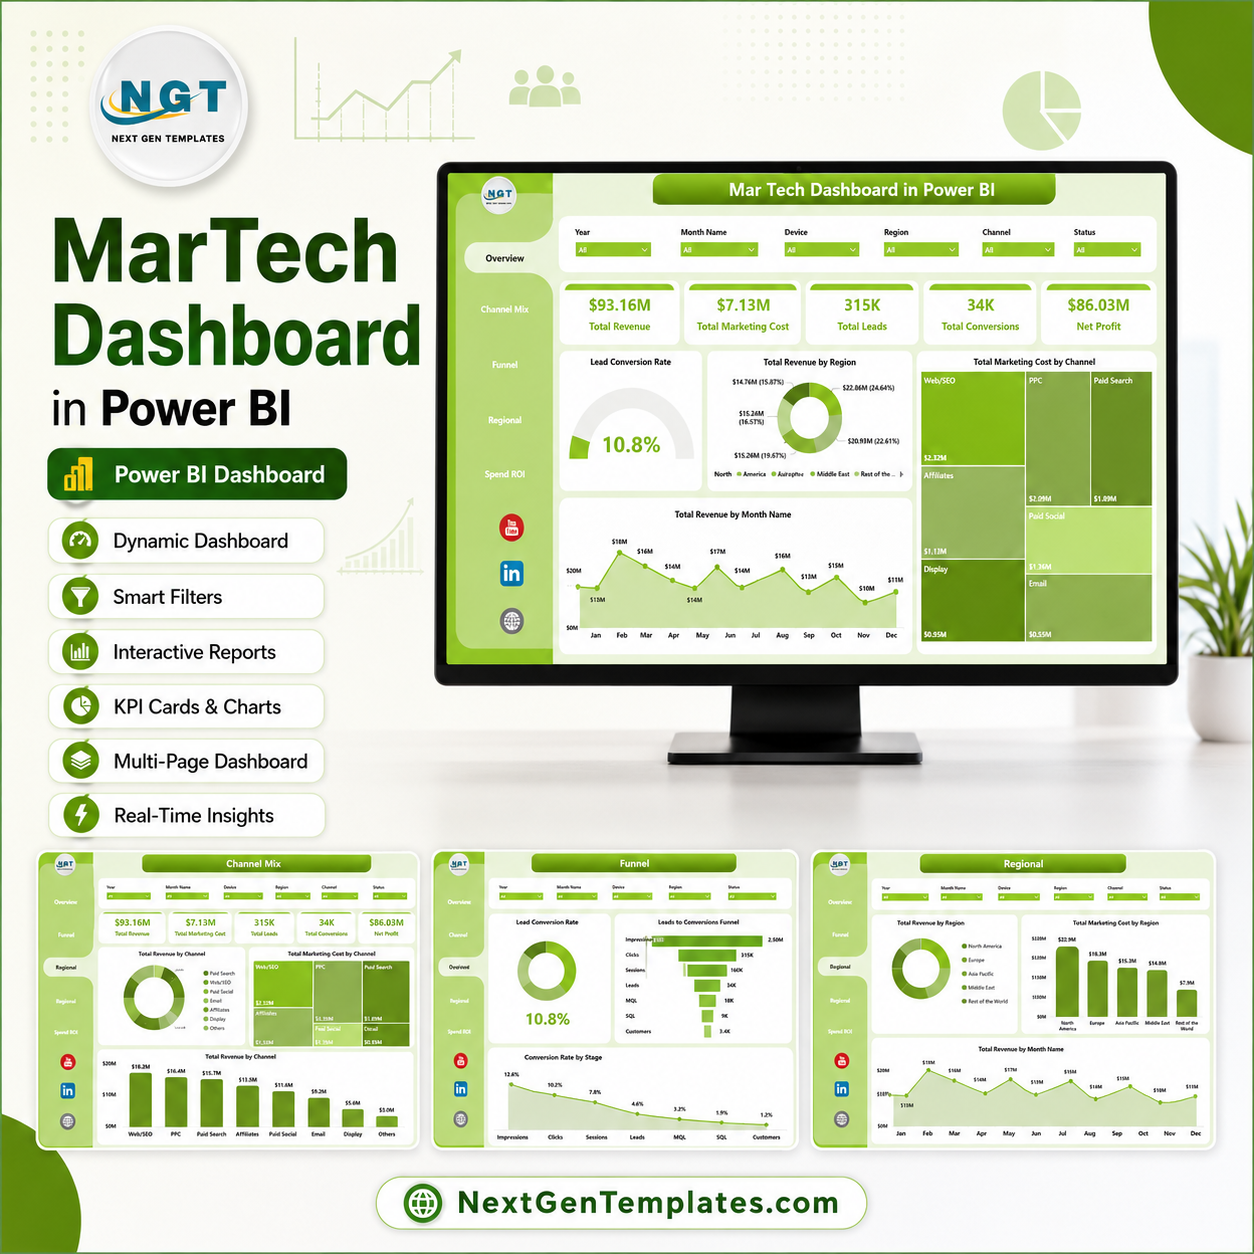
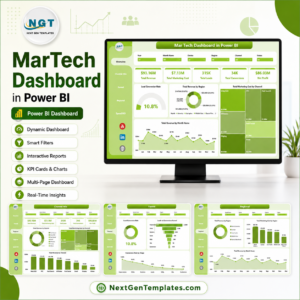
MarTech Dashboard in Power BI helps marketing leaders review revenue, marketing cost, leads, conversions, net profit, ROAS, channel mix, funnel movement, regional performance, campaign owners, devices, audience segments, and monthly trends in one editable PBIX report. Marketing teams often spend 5-20 hours each month combining exports from ad platforms, CRM tools, and campaign trackers. This Power BI dashboard gives you a structured reporting layer for a one-time $17.99 purchase, with 5 report pages, 5 executive cards, 20 analysis visuals, and slicers for quick filtering. Instant ZIP download, no subscription, and lifetime access.
Key Features of MarTech Dashboard in Power BI
- 5 Power BI pages: Overview Page, Channel Mix, Funnel, Regional, and Spend ROI.
- 5 headline cards: Total Revenue, Total Marketing Cost, Total Leads, Total Conversions, and Net Profit.
- 20 analysis visuals: Review revenue, marketing cost, leads, conversions, ROAS, ad spend, channels, regions, devices, audience segments, funnel stages, campaign owners, months, quarters, and years.
- Interactive slicers: Filter the dashboard quickly during campaign review meetings.
- Power BI-ready layout: Open the PBIX in Power BI Desktop, replace or connect data, refresh, and customize the model as needed.
- Marketing ROI focus: Built for marketing operations, demand generation, paid media, agency reporting, and MarTech analytics teams.
What’s Inside the MarTech Dashboard in Power BI
1 – Overview Page
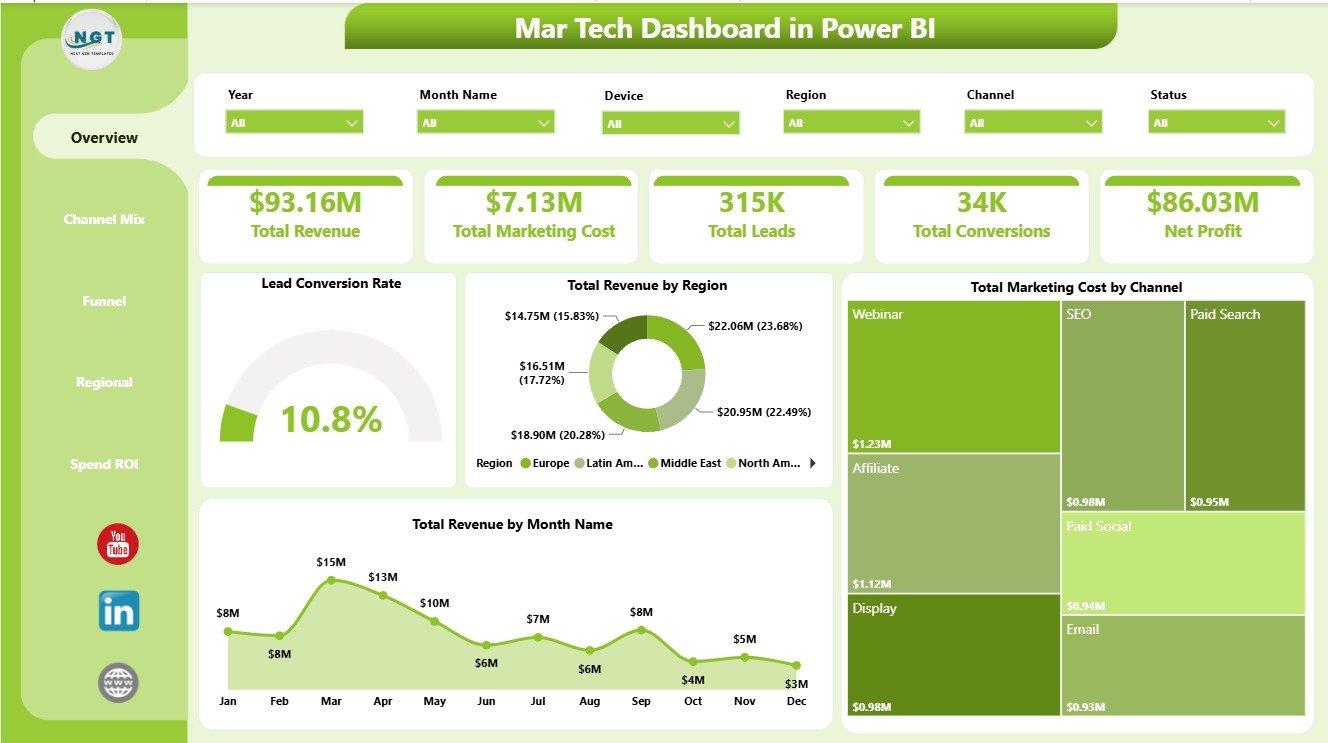
The Overview Page gives a high-level read on marketing performance before users drill into detailed views. The top cards show Total Revenue, Total Marketing Cost, Total Leads, Total Conversions, and Net Profit, while slicers help teams filter the report quickly by selected campaign dimensions.
Lead Conversion Rate by Overall Leads: This visual summarizes how effectively leads turn into conversions. It helps leaders see whether campaign volume is translating into measurable outcomes.
Total Revenue by Region: This chart compares revenue across regions. It helps identify the markets that are contributing strongest sales results.
Total Marketing Cost by Channel: This chart shows which channels are consuming the most budget. It supports spend control and channel-level ROI review.
Total Revenue by Month Name: This trend shows monthly revenue movement. It helps spot seasonality, campaign lift, and weak months that need investigation.
2 – Channel Mix
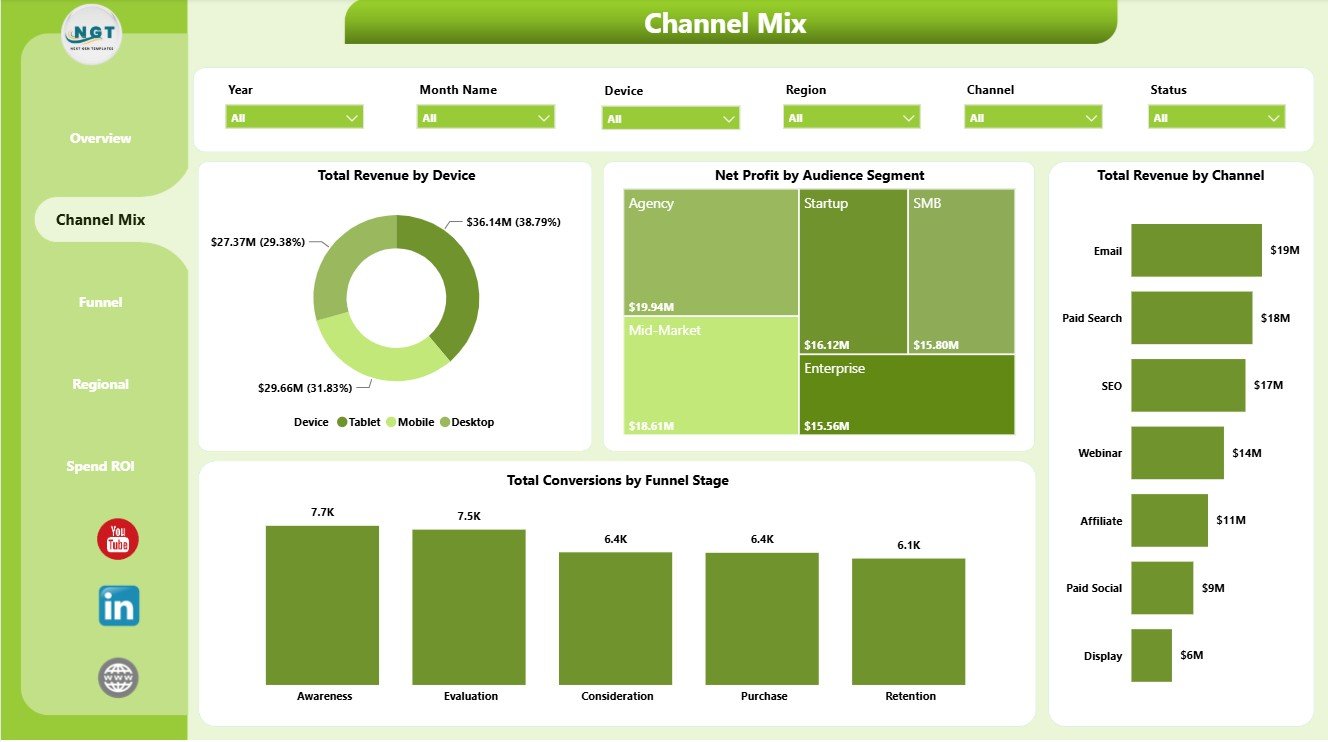
The Channel Mix page compares acquisition channels, devices, audience segments, and funnel stages. It helps marketing teams understand where revenue, profit, and conversions are coming from.
Total Revenue by Device: This chart shows revenue contribution across devices. It helps teams decide where landing page, creative, and mobile experience improvements matter most.
Net Profit by Audience Segment: This visual compares profitability across customer or audience groups. It prevents teams from judging segments only by activity volume.
Total Revenue by Channel: This chart connects each marketing channel to revenue output. It helps compare search, social, email, partner, referral, and other channels on commercial value.
Total Conversions by Funnel Stage: This view shows conversion volume by funnel stage. It helps identify where prospects are moving well and where follow-up may need improvement.
3 – Funnel
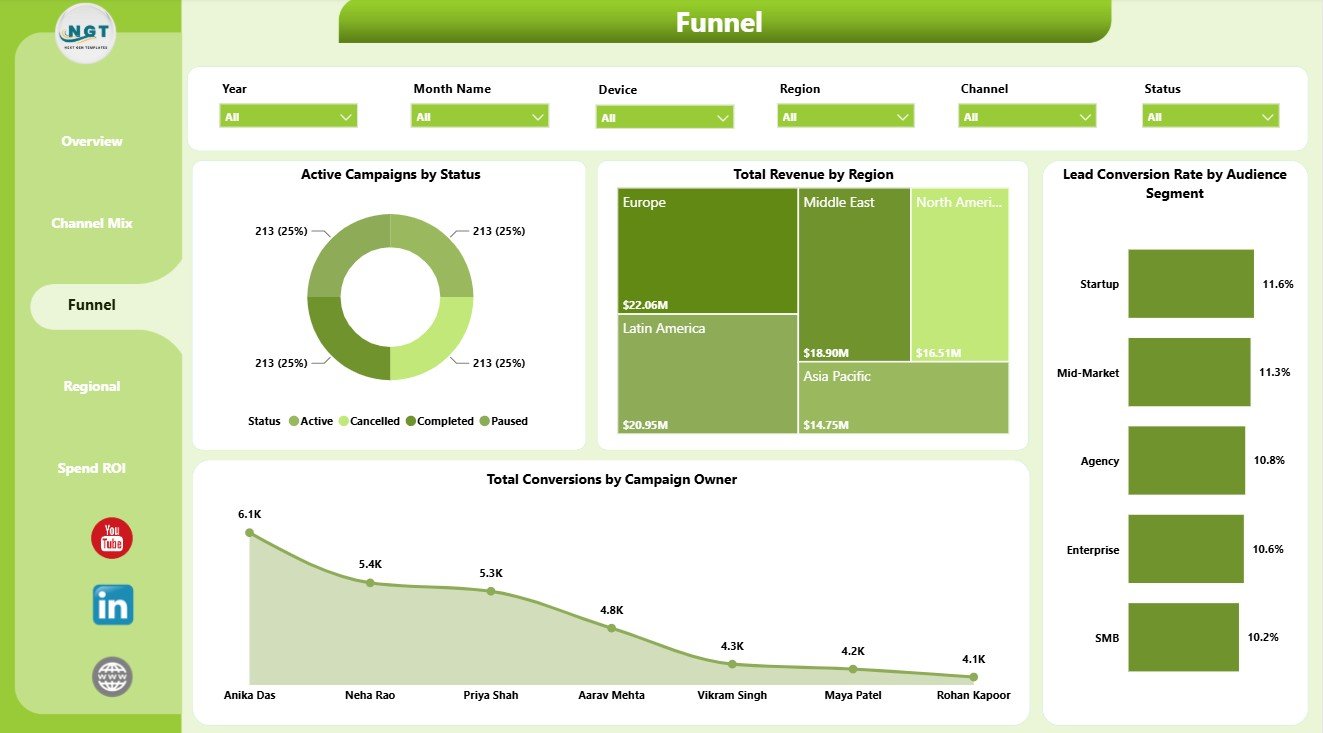
The Funnel page focuses on campaign status, conversion performance, ownership, and regional revenue. It is useful for marketing and sales teams that want to review whether campaigns are progressing toward outcomes.
Active Campaigns by Status: This chart shows campaign distribution by status. It helps teams see how much work is active, completed, paused, planned, or under review.
Total Revenue by Region: This chart compares revenue across markets. It supports regional planning and helps leaders see where funnel efforts are producing revenue.
Lead Conversion Rate by Audience Segment: This visual compares conversion efficiency by audience. It helps refine targeting, messaging, and nurture strategy.
Total Conversions by Campaign Owner: This chart compares conversion contribution by owner. It supports campaign accountability, coaching, and workload review.
4 – Regional
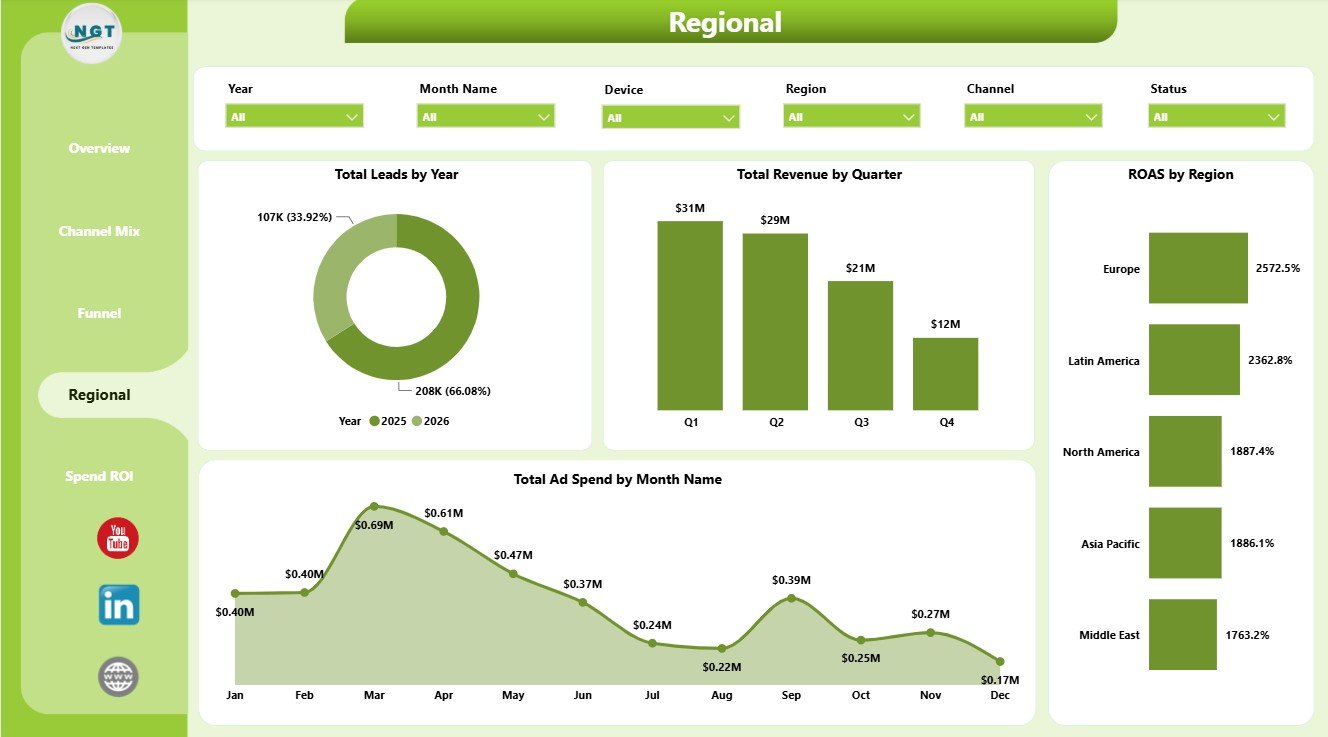
The Regional page focuses on geography and time-based marketing performance. It helps teams connect lead generation, quarterly revenue, ROAS, and monthly ad spend across regions.
Total Leads by Year: This chart shows yearly lead volume. It helps compare long-term demand generation performance.
Total Revenue by Quarter: This visual compares quarterly revenue. It supports QBR discussions and budget planning.
ROAS by Region: This chart compares return on ad spend by market. It helps identify regions where marketing investment is producing stronger returns.
Total Ad Spend by Month Name: This trend shows monthly ad spend. It helps teams spot planned campaign peaks, overspending, or underinvestment periods.
5 – Spend ROI
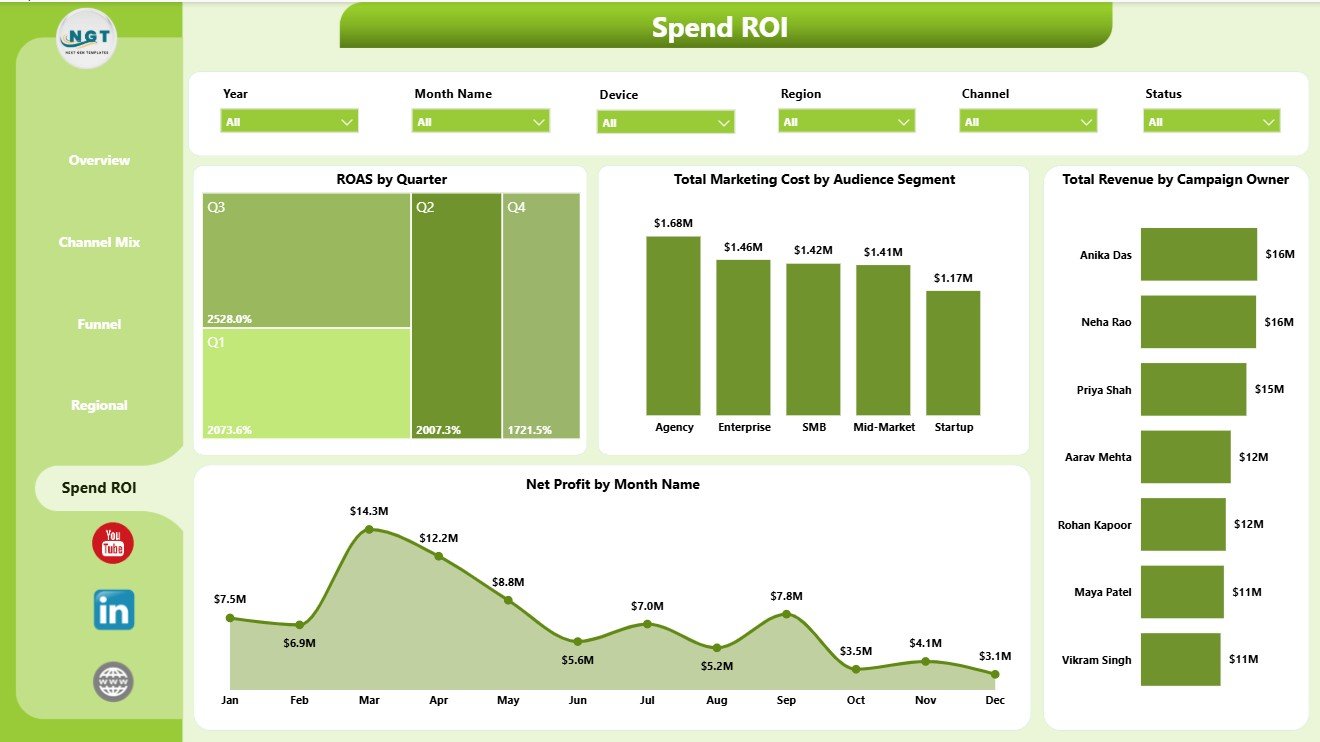
The Spend ROI page brings together ROAS, marketing cost, campaign ownership, and monthly profit. It is built for budget meetings and performance reviews where revenue alone is not enough.
ROAS by Quarter: This chart shows how ad efficiency changes across quarters. It helps teams compare spend quality over time.
Total Marketing Cost by Audience Segment: This chart shows how budget is distributed by segment. It helps identify costly segments that need deeper return analysis.
Total Revenue by Campaign Owner: This visual compares revenue contribution by owner. It helps leaders review which campaigns and managers are driving measurable outcomes.
Net Profit by Month Name: This trend tracks monthly profit after marketing costs. It gives a clearer view than revenue alone because it includes spend efficiency.
MarTech Dashboard in Power BI vs. Tableau vs. Paid CRM/SaaS – Where This Fits
| Feature | This Power BI dashboard | Tableau or Qlik alternative | Paid CRM/SaaS alternative |
|---|---|---|---|
| Cost | $17.99 sale price, one-time | License plus report build time | Monthly or annual subscription |
| Platform | Power BI Desktop / Power BI Service | Tableau, Qlik, or another BI tool | HubSpot, Salesforce, or marketing SaaS |
| Setup time | Open PBIX, replace or connect data, refresh | Build or adapt report pages | Implementation and onboarding |
| Real-time team collaboration | Available through Power BI Service when published | Available with cloud plans | Usually included by paid seats |
| Mobile access | Available through Power BI mobile after publishing | Plan dependent | Usually included |
| Customizable fields | Editable model, visuals, measures, and pages | Editable with BI skills | Depends on vendor permissions |
| Share with link | Available through Power BI Service | Available with cloud publishing | Login controlled |
| Year-1 cost at 5 users | $17.99 plus any Microsoft licensing | License and build cost dependent | Often hundreds or thousands |
| Marketing ROI pages | Overview, Channel Mix, Funnel, Regional, Spend ROI | Must be designed | Depends on plan and integrations |
Who This Template Is For – and Who It’s Not For
This template is for marketing managers, MarTech analysts, demand generation teams, paid media leads, agency reporting managers, startup founders, and consultants who need repeatable Power BI reporting for campaign performance.
It is not a live ad platform connector, attribution modeling engine, CRM, bidding tool, or automated marketing platform. Use it as a reporting dashboard after your marketing data is available in a structured source.
How to Use the MarTech Dashboard in Power BI
- Download and unzip the template package.
- Open the PBIX file in Power BI Desktop.
- Review the sample pages, cards, visuals, slicers, and model fields.
- Replace the sample data or connect your prepared marketing dataset.
- Refresh the report and validate revenue, cost, leads, conversions, profit, ROAS, campaign owners, regions, channels, and dates.
- Customize visuals, colors, model fields, or page names as needed.
Real-World Use Cases
Aisha, marketing operations manager: reviews revenue, marketing cost, leads, conversions, and net profit before the weekly leadership meeting.
Daniel, agency reporting lead: uses Channel Mix and Spend ROI pages to prepare monthly client reporting for campaign performance.
Priya, startup founder: compares ROAS by region and revenue by channel before deciding where next month’s budget should go.
Frequently Asked Questions
What does this dashboard track?
It tracks revenue, marketing cost, leads, conversions, net profit, ROAS, ad spend, campaign status, channel, region, device, audience segment, owner, funnel stage, month, quarter, and year.
What software do I need?
You need Power BI Desktop to open, edit, refresh, and customize the PBIX file.
How do I refresh the dashboard?
Open the PBIX file, replace or connect your prepared dataset, and refresh the report in Power BI Desktop.
Can I customize the report?
Yes. You can edit visuals, slicers, fields, measures, colors, and page names.
Is this suitable for agencies?
Yes. Agencies can duplicate the PBIX file for each client and use the same reporting structure across accounts.
Does it connect directly to Google Ads or Meta Ads?
No direct connector is included. Export, prepare, or connect your data source in Power BI, then refresh the report.
About the Author
Built by PK – Microsoft Certified Professional with 15+ years of Excel, Google Sheets, and Power BI experience. Founder of NextGenTemplates, reaching 300K+ subscribers across YouTube channels. Every template is hand-built and tested before release.
Explore Related Templates
- Read the MarTech Dashboard in Power BI blog post.
- MarTech Dashboard in Excel – Excel version for marketing campaign reporting.
- Machine Learning Labs Dashboard in Power BI – Power BI analytics template for AI lab operations.
- Loyalty Programs Management Dashboard in Power BI – Customer retention and rewards dashboard.
- Browse Power BI templates.
- Browse Power BI dashboard templates.
Download the MarTech Dashboard in Power BI and start reviewing marketing revenue, cost, leads, conversions, net profit, and ROAS in one editable PBIX report.
Last updated: July 7, 2026.











Reviews
There are no reviews yet.