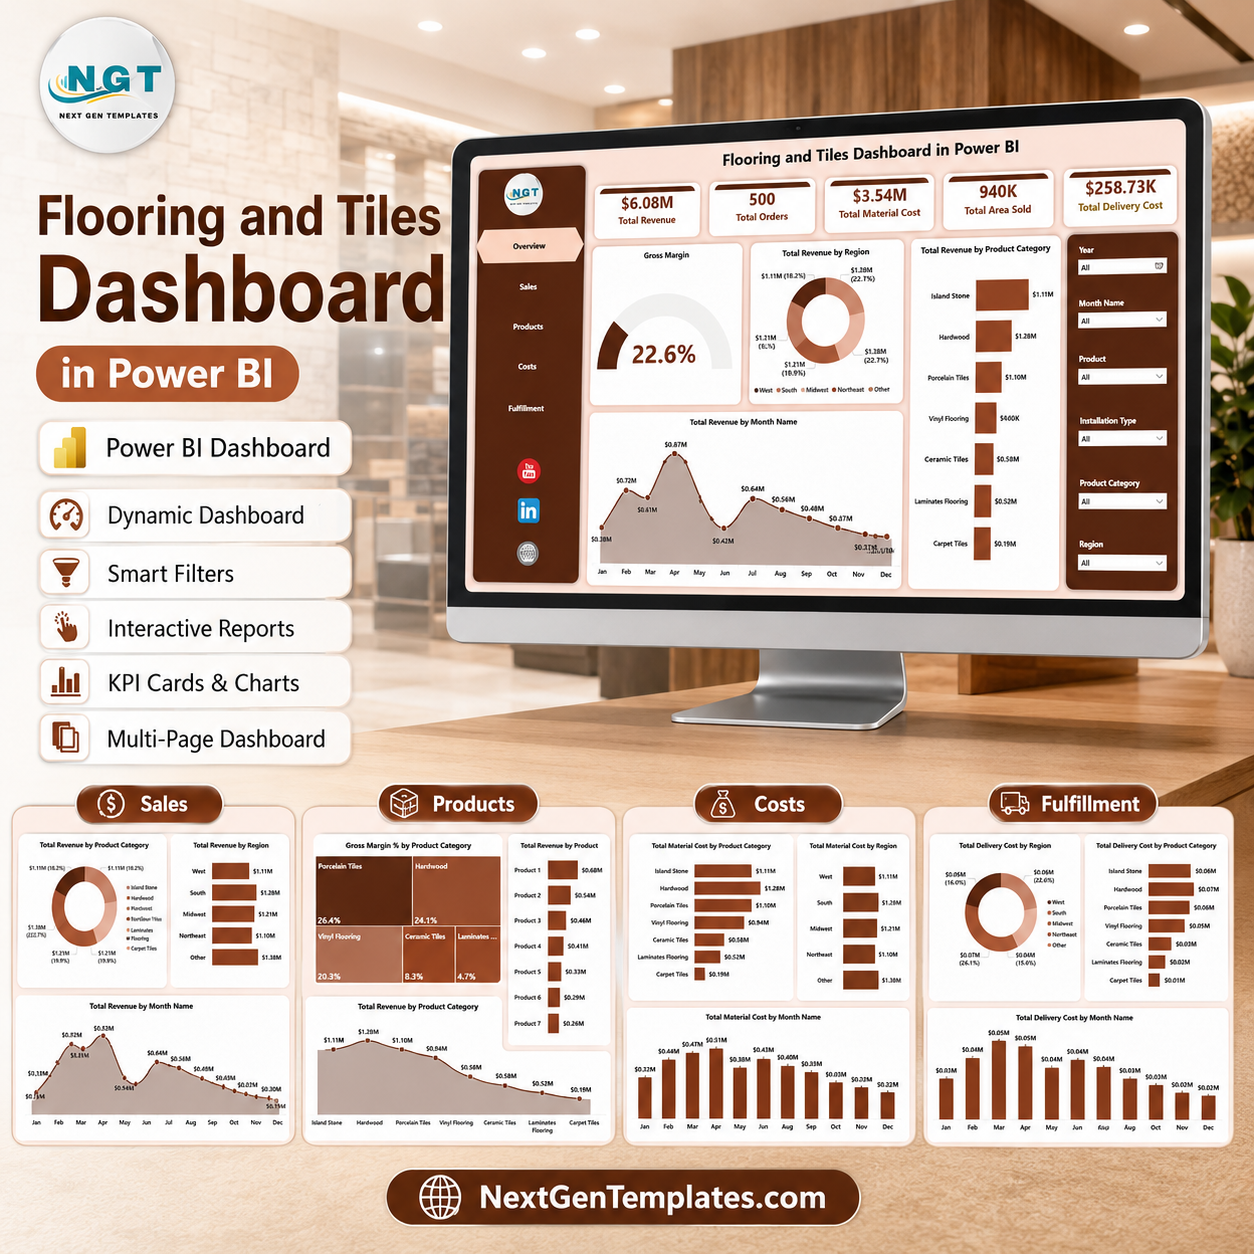
The Flooring and Tiles Dashboard in Power BI helps flooring retailers, tile distributors, installation teams, and construction material suppliers review revenue, orders, material cost, delivery cost, installation cost, area sold, and margin in one interactive report. Instead of building visuals from raw order data every month, your team can use 5 ready Power BI pages with executive cards, slicers, and focused analysis views. NextGenTemplates supports 8,400+ template buyers across 40+ countries, and this is a one-time download with no subscription, no per-user fee, and lifetime file access.
Key Features of Flooring and Tiles Dashboard in Power BI
- 5 Power BI report pages: Overview, Sales, Products, Costs, and Fulfillment.
- 6 executive KPI cards: Total Revenue, Total Orders, Total Material Cost, Total Area Sold, Total Delivery Cost, and Gross Margin.
- Interactive slicers: Filter the dashboard quickly by available business fields and review only the records that matter.
- Revenue and margin tracking: Compare regions, product categories, months, products, finishes, customer types, and sales channels.
- Cost visibility: Review material cost, delivery cost, installation cost, and gross profit in connected report pages.
- Power BI format: Open the PBIX file in Power BI Desktop and customize visuals, model fields, and report design as needed.
- One-time purchase: No subscription and no recurring SaaS charge for the template file.
What’s Inside the Flooring and Tiles Dashboard in Power BI
Overview Page
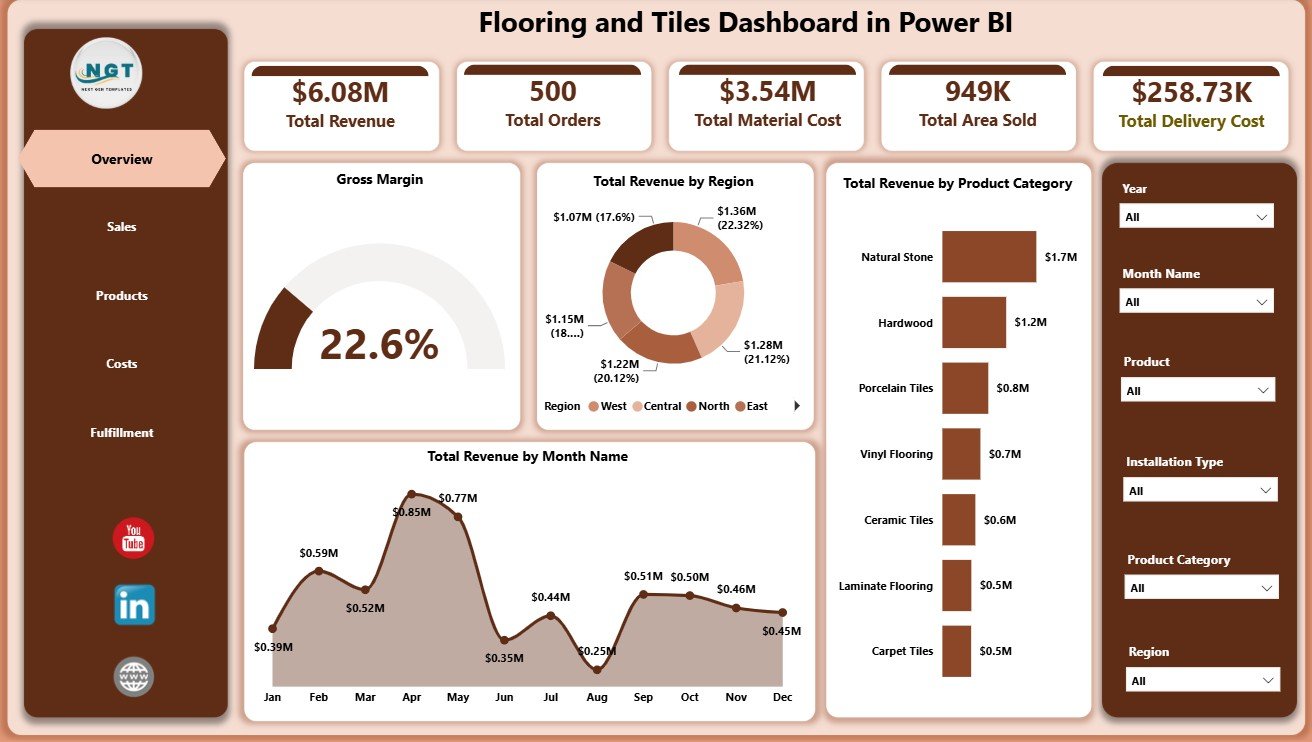
The Overview page gives a senior-level view of the flooring and tiles business. The top cards show Total Revenue, Total Orders, Total Material Cost, Total Area Sold, Total Delivery Cost, and Gross Margin so users can check financial and operational performance before drilling into detail.
Gross Margin by Overall Performance: This visual summarizes profitability across the selected data. It helps owners and managers see whether the business is keeping enough margin after material, delivery, and installation costs.
Total Revenue by Region: This chart compares revenue across regions. It supports territory planning, regional sales review, and market-level performance discussions.
Total Revenue by Product Category: This chart shows which flooring and tile categories generate the most revenue. It helps teams decide where to focus inventory, promotions, and supplier negotiations.
Total Revenue by Month Name: This chart displays revenue movement by month. It helps users track seasonality, campaign impact, and monthly demand changes.
Flooring and Tiles Dashboard in Power BI
Sales Page
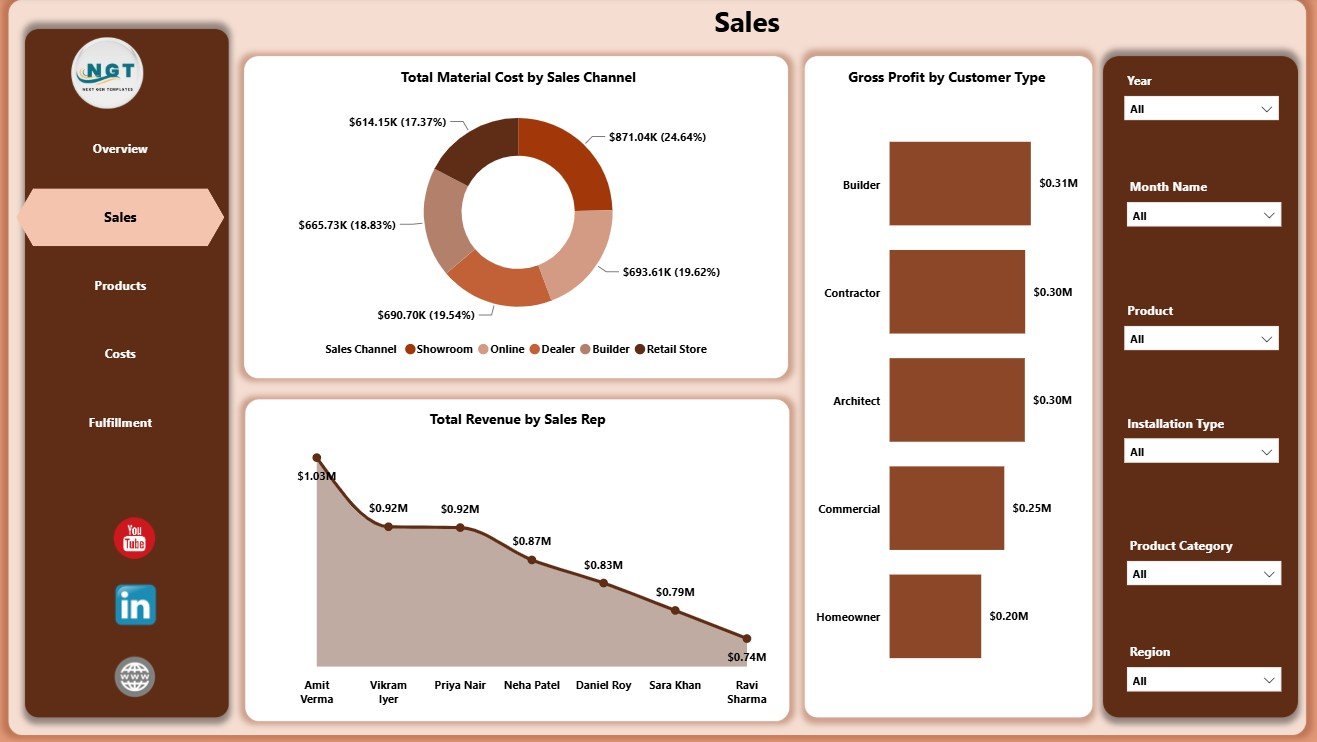
The Sales page focuses on customer, channel, and sales representative performance. It includes Total Material Cost by Sales Channel, Gross Profit by Customer Type, and Total Revenue by Sales Rep.
Sales Page
Products Page
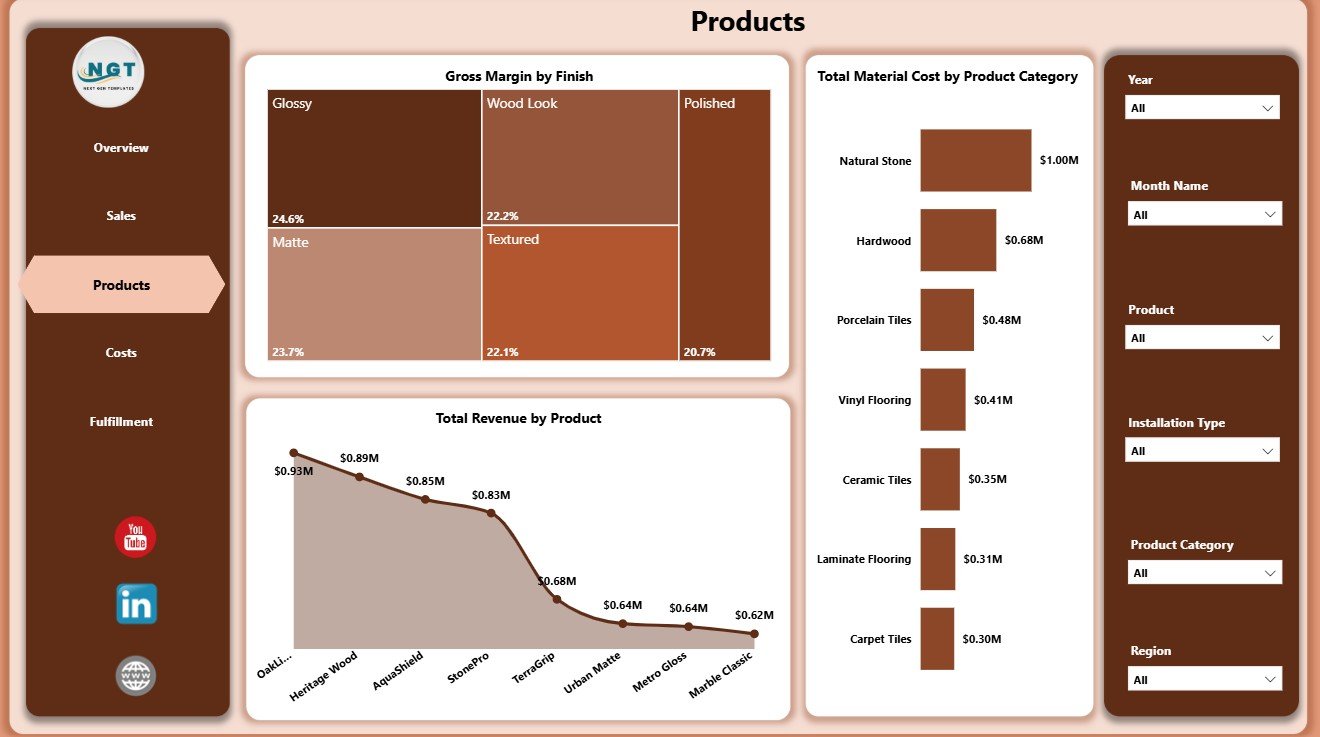
The Products page helps users compare product and finish-level performance. It includes Gross Margin by Finish, Total Material Cost by Product Category, and Total Revenue by Product.
Products Page
Costs Page
The Costs page is built for margin and cost control. It includes Gross Margin by Product, Total Revenue by Status, and Gross Profit by Sales Channel.
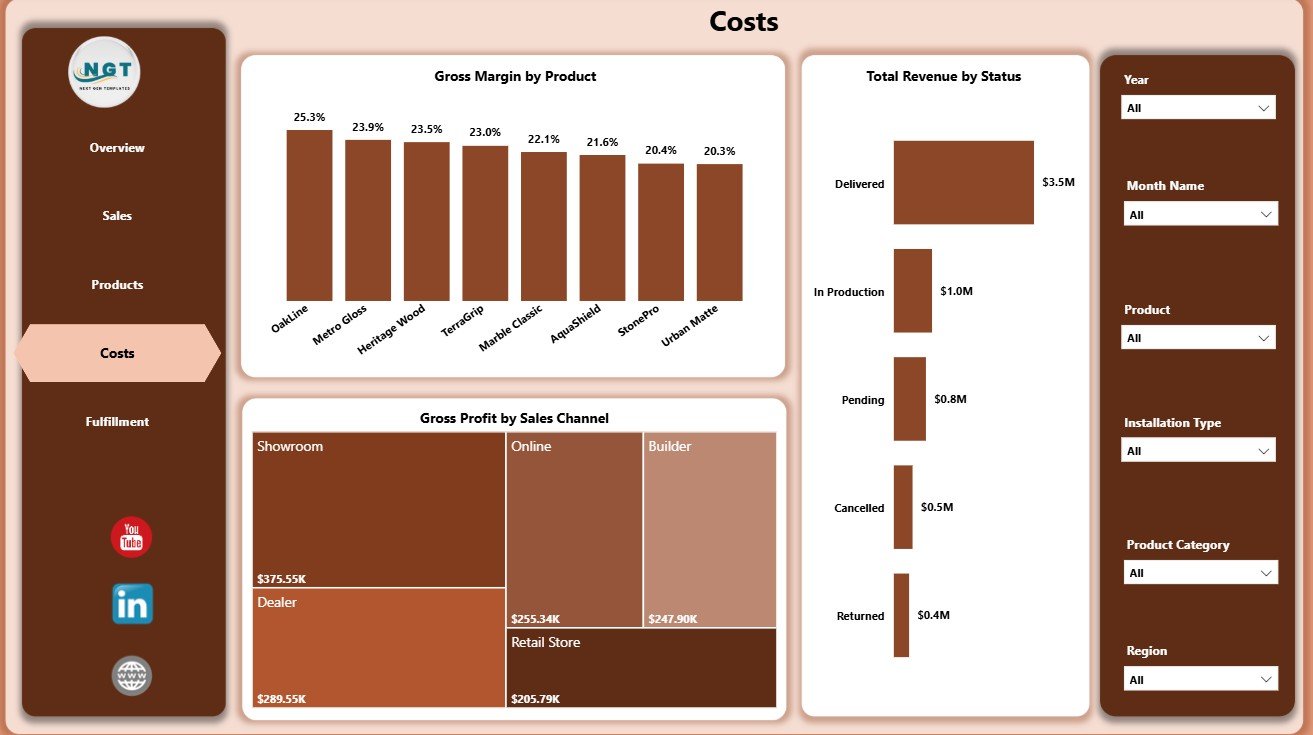
Costs Page
Fulfillment Page
The Fulfillment page connects delivery and installation costs with product category, region, and month. It includes Total Delivery Cost by Region, Total Delivery Cost by Product Category, and Total Installation Cost by Month Name.
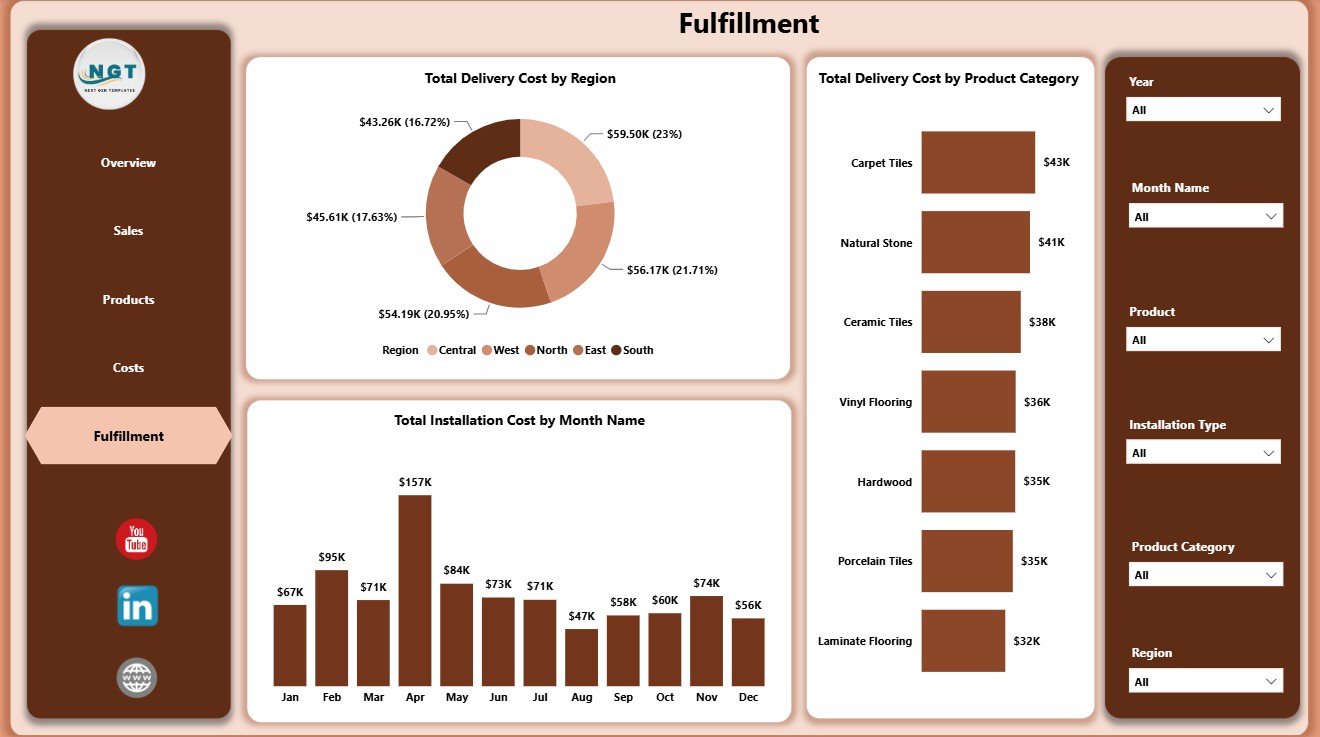
Fulfillment Page
Flooring and Tiles Dashboard in Power BI vs. Tableau vs. Paid CRM/SaaS – Where This Fits
| Feature | This Power BI Dashboard | Tableau Alternative | Paid CRM/SaaS |
|---|---|---|---|
| Cost | $17.99 one-time template purchase | Requires Tableau license and build time | Monthly or annual subscription |
| Platform | Power BI Desktop / Power BI Service | Tableau Desktop / Tableau Cloud | Vendor cloud platform |
| Setup time | Open PBIX and connect or replace data | Build or rebuild dashboards | Implementation and configuration |
| Customizable fields | High for Power BI users | High for Tableau users | Limited by plan and admin permissions |
| Share with link | Possible through Power BI Service | Possible through Tableau Cloud | Usually role-based |
| Year-1 cost at 5 users | Template cost plus any Microsoft licensing | License cost plus build time | Often hundreds or thousands of dollars |
| Best use case | Flooring sales, cost, margin, product, and fulfillment analysis | Advanced BI teams already using Tableau | Full CRM, inventory, billing, or ERP workflow |
Who This Template Is For – and Who It’s Not For
This template is for flooring showrooms, tile distributors, construction material suppliers, installation contractors, sales managers, finance analysts, and operations teams that want a ready Power BI reporting layer for sales, costs, products, and fulfillment.
It is not a full ERP, accounting system, live inventory system, barcode tool, route planning app, or automated CRM. If you need transaction entry, live stock sync, invoicing, or customer workflow automation, use this dashboard as an analysis layer alongside those systems.
How to Use the Flooring and Tiles Dashboard in Power BI
- Download and unzip the Power BI template package.
- Open the PBIX file in Power BI Desktop.
- Review the sample data structure and map your flooring and tiles data to the same fields.
- Refresh the report after replacing or connecting the source data.
- Use slicers to filter by region, category, channel, product, customer type, month, status, or other available fields.
- Customize visuals, colors, measures, and model relationships if your reporting process requires it.
Real-World Use Cases
Raj, a tile distributor, reviews Total Revenue by Region and Product Category before monthly dealer meetings.
Meena, a showroom manager, checks Gross Margin by Finish and Total Revenue by Product to decide which products need pricing review.
Arjun, an installation coordinator, uses the Fulfillment page to compare delivery cost by region and installation cost by month.
Frequently Asked Questions
Does this dashboard work in Power BI Desktop?
Yes. Open the PBIX file in Power BI Desktop, then review or replace the sample data source.
Can I use my own flooring and tiles data?
Yes. Map your data to the same field structure and refresh the report.
What pages are included?
The report includes Overview, Sales, Products, Costs, and Fulfillment pages.
Does it include slicers?
Yes. The report includes multiple slicers so users can filter the dashboard quickly.
Is this a full business management system?
No. It is an analytics dashboard, not a transaction entry, inventory, billing, or CRM system.
Can I customize the report?
Yes. Power BI users can edit visuals, measures, fields, formatting, and relationships as needed.
About the Author
Built by PK – Microsoft Certified Professional with 15+ years of Excel, Google Sheets, and Power BI experience. Founder of NextGenTemplates, reaching 300K+ subscribers across YouTube channels. Every template is hand-built and tested before release.
Explore Related Templates
You may also like the Flooring and Tiles Dashboard in Excel and Flooring and Tiles KPI Dashboard in Excel. Browse more Power BI Dashboard templates and Power BI templates.
Click here to read the detailed blog post.
Download the Flooring and Tiles Dashboard in Power BI today and turn sales, product, cost, and fulfillment data into clear business insight.
Last updated: June 14, 2026.


Reviews
There are no reviews yet.