


Renovating an office is more than just moving furniture—it’s a strategic project that requires precision, oversight, and timely execution. The Office Renovation Project Dashboard in Power BI is a comprehensive, Excel-powered project tracking solution designed to help project managers, facility teams, and contractors streamline every phase of renovation management.
Whether you’re handling a single floor redesign or a full office overhaul across multiple locations, this ready-to-use Power BI dashboard ensures you’re always in control—monitoring budget, tracking task progress, evaluating contractor performance, and identifying cost variances in real time.
🧰 Key Features of the Office Renovation Project Dashboard
This dashboard is structured into five interactive Power BI pages, each offering deep insight into a different aspect of your renovation:
📌 1. Overview Page – Executive Summary
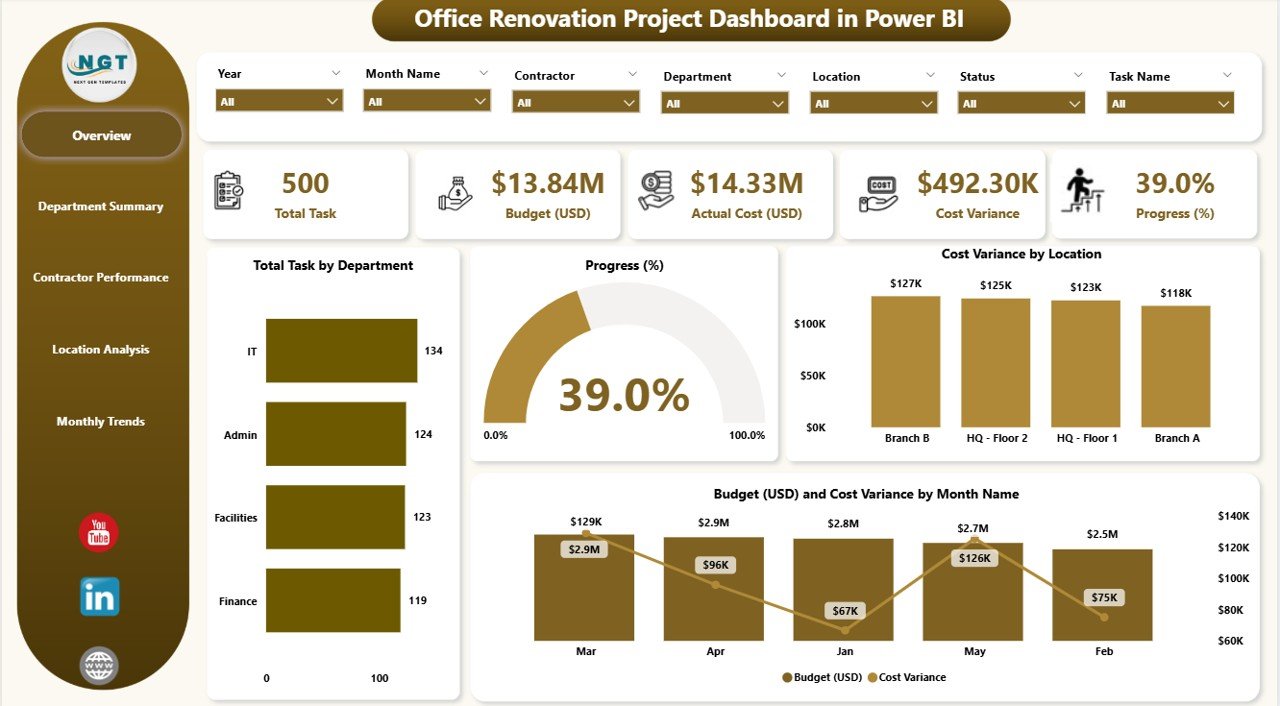
7 Slicers: Filter by department, contractor, task, location, etc.
5 KPI Cards:
Total Tasks by Department
Overall Progress (%)
Cost Variance by Location
Budget (USD)
Cost Variance by Month
📈 Provides a high-level snapshot of budget adherence and project execution status.
🏢 2. Department Summary – Track Department-Wise Execution
7 Slicers for department-specific analysis
4 Charts:
Cost Variance by Department
Progress (%) by Department
Status Breakdown of Department Tasks
Budget vs Cost Variance
🎯 Identify which departments are on schedule and which are lagging behind.
🧱 3. Contractor Performance – Analyze Vendor Outputs
7 Slicers for contractor, department, and location views
3 Charts:
Cost Variance by Contractor
Actual Cost (USD) by Contractor
Progress (%) by Contractor
🛠️ Great for holding vendors accountable and identifying inefficiencies.
📍 4. Location Analysis – Geographic Performance Insights
7 Slicers for filtering by location, contractor, etc.
4 Charts:
Budget vs Actual Cost (USD) by Location
Cost Variance
Progress (%)
🗺️ Ideal for multi-site renovation projects across different zones or cities.
📆 5. Monthly Trends – Time-Based Progress Monitoring
7 Slicers for filtering by month, location, department, and more
2 Charts:
Cost Variance by Month
Progress (%) by Month
📊 Quickly identify bottlenecks or delays on a monthly basis and take corrective action.
📂 What’s Included in the Package?
✅ Power BI (.PBIX) File
✅ Excel File (Data Source) with Sheets for:
Task Data
Budget and Actual Costs
Department & Contractor Info
🧠 Built-in visuals and slicers for real-time filtering
📤 Auto-refreshable with updated Excel files
🧩 Easy to customize and expand with your own project data
👤 Who Should Use This Dashboard?
🏢 Facility Managers
🛠️ Renovation Project Managers
🧑💼 Office Admin & Real Estate Teams
🧾 Financial Controllers
🧰 Contractors and Vendors
🚀 Benefits of Using This Dashboard
✅ Centralized project visibility in one dashboard
💡 Make informed decisions with real-time data
🎯 Identify over-budget departments or locations instantly
📊 Visually track progress month-over-month
🤝 Improve contractor accountability and performance
📌 Best Practices to Maximize Impact
✔ Update Excel source files weekly or bi-weekly
✔ Use slicers to drill down by contractor or department
✔ Regularly monitor cost variance and task progress
✔ Share dashboard with stakeholders for improved transparency
✔ Use the Monthly Trends page to foresee and address delays
🎓 Bonus
Watch our step-by-step tutorials on our YouTube Channel:
👉 youtube.com/@PKAnExcelExpert


























Reviews
There are no reviews yet.