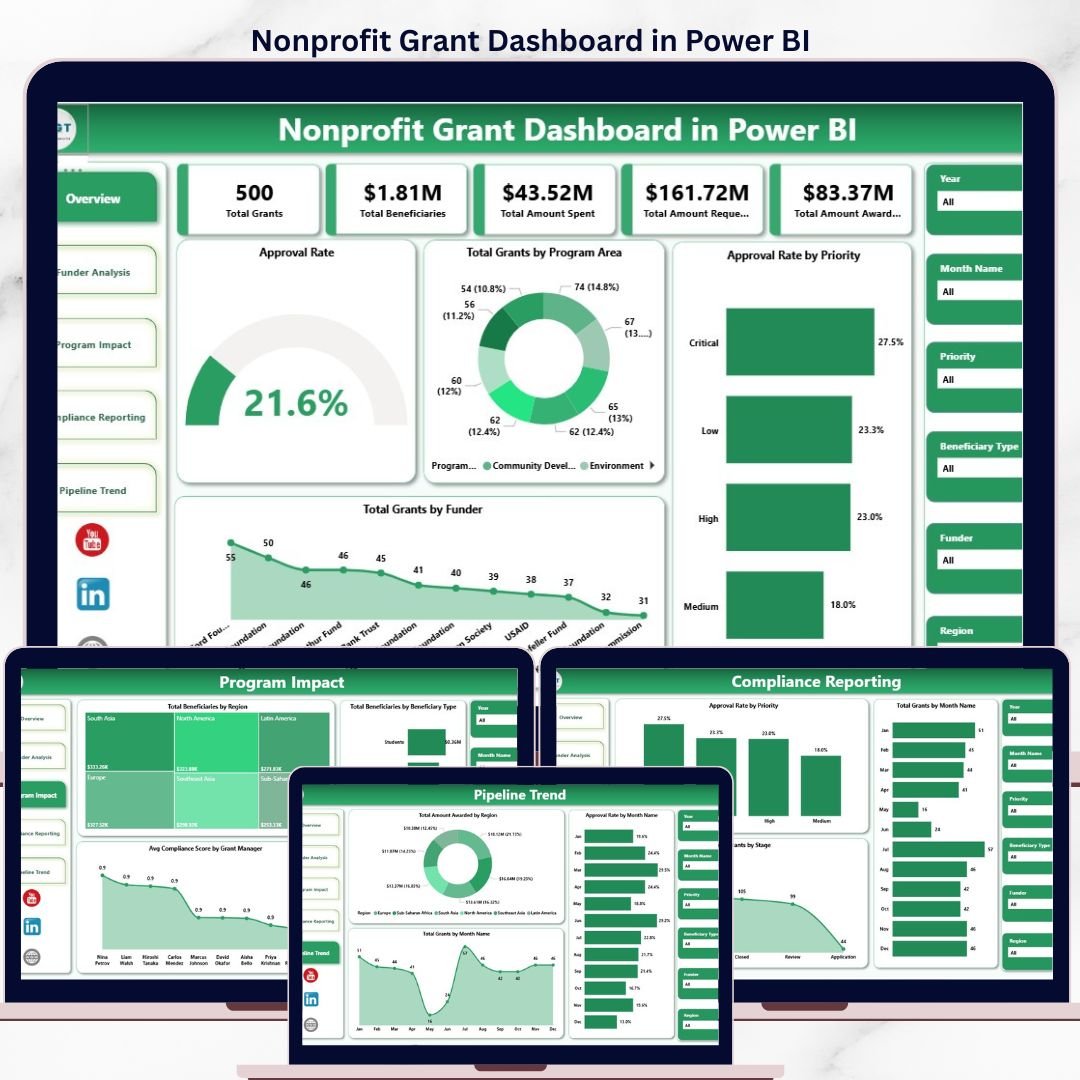
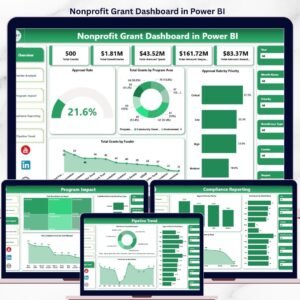
The Nonprofit Grant Dashboard in Power BI tracks 12+ grant management KPIs across 5 interactive dashboard pages, with 14+ pre-built charts covering funder analysis, program impact, compliance reporting, and pipeline trends. Setup takes under 10 minutes — open the .pbix file in the free Power BI Desktop app, connect your data, and every chart updates automatically.
🌍 Join 8,400+ teams in 40+ countries using NextGenTemplates to replace expensive grant management SaaS tools with one-time-purchase Power BI, Excel, Google Sheets, and HTML templates.
✅ Instant download · One-time payment · No subscription · No per-user fees · Lifetime access
🔑 Key Features of Nonprofit Grant Dashboard in Power BI
🔹 5 Purpose-Built Dashboard Pages – Overview, Funder Analysis, Program Impact, Compliance Reporting, and Pipeline Trend pages are included in a single .pbix file. Each page is designed for a specific grant management audience — from executive summary to field compliance officer.
🔹 5 Grant KPI Summary Cards – The Overview page displays Total Grants, Total Beneficiaries, Total Amount Spent, Total Amount Requested, and Total Amount Awarded as high-level headline cards. These 5 metrics give grant managers an immediate status snapshot before drilling into any chart.
🔹 Approval Rate Intelligence – The dashboard calculates and visualizes Approval Rate by Priority and by Funder, enabling your team to identify which funding streams have the highest success rates and prioritize grant applications accordingly.
🔹 Funder-Level Breakdown – The Funder Analysis page breaks down Total Amount Spent and Approval Rate by Funder Type, and Total Beneficiaries by Program Area. Grant managers can immediately see which funders deliver the most value per dollar awarded.
🔹 Program Impact Measurement – Track Total Beneficiaries by Region and Beneficiary Type, plus Average Compliance Score by Grant Manager — a critical metric for accountability reporting to donors and board members.
🔹 Compliance & Pipeline Visibility – The Compliance Reporting page tracks grant stages, monthly counts, and priority-based approval rates. The Pipeline Trend page layers on monthly award amounts by region and approval rate trends over time for forward-looking forecasting.
🔹 Free Power BI Desktop Compatible – Works with Microsoft’s free Power BI Desktop application. No Power BI Pro or Premium license required to build and view the dashboard locally.
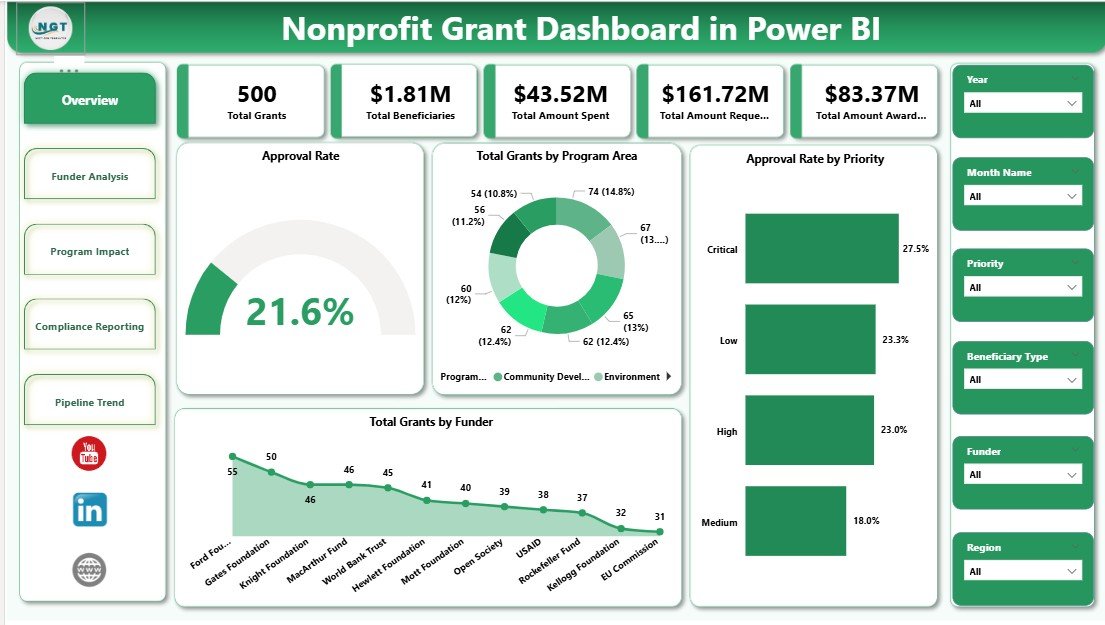
Nonprofit Grant Dashboard in Power BI – Overview Page
📦 What’s Inside the Nonprofit Grant Dashboard in Power BI
🔹 Page 1 — Overview Page: Five KPI cards (Total Grants, Total Beneficiaries, Total Amount Spent, Total Amount Requested, Total Amount Awarded) plus four charts: Approval Rate, Total Grants by Program Area, Approval Rate by Priority, and Total Grants by Funder. Slicers allow instant filtering of all visuals.
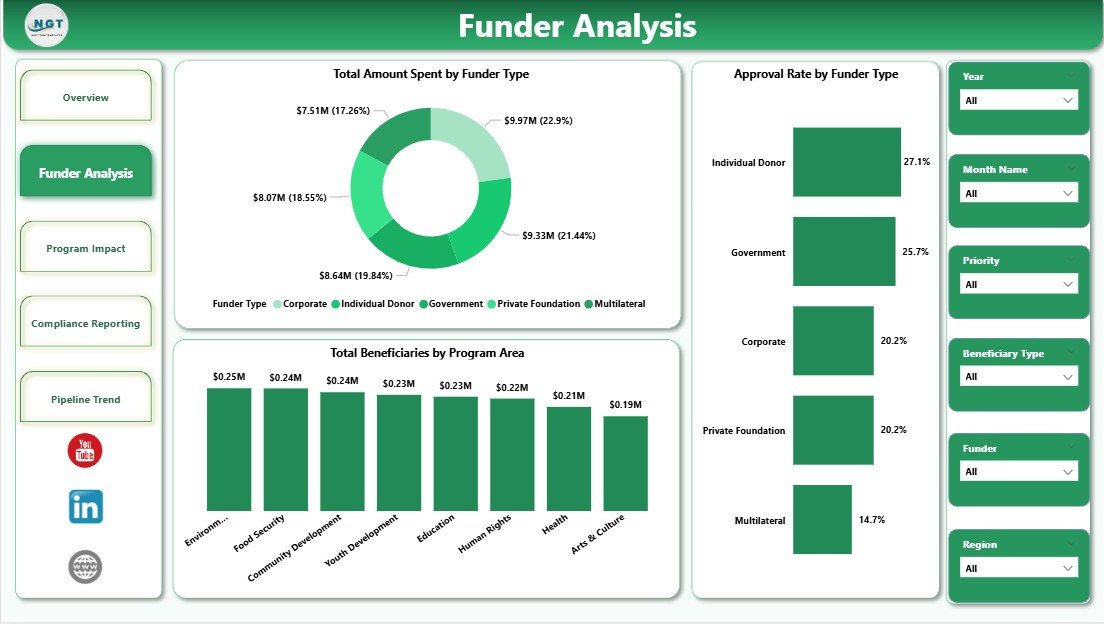
Nonprofit Grant Dashboard in Power BI – Funder Analysis Page
🔹 Page 2 — Funder Analysis: Three dedicated funder visuals — Total Amount Spent by Funder Type, Approval Rate by Funder Type, and Total Beneficiaries by Program Area. Helps development teams make evidence-based decisions on which funders to prioritize.
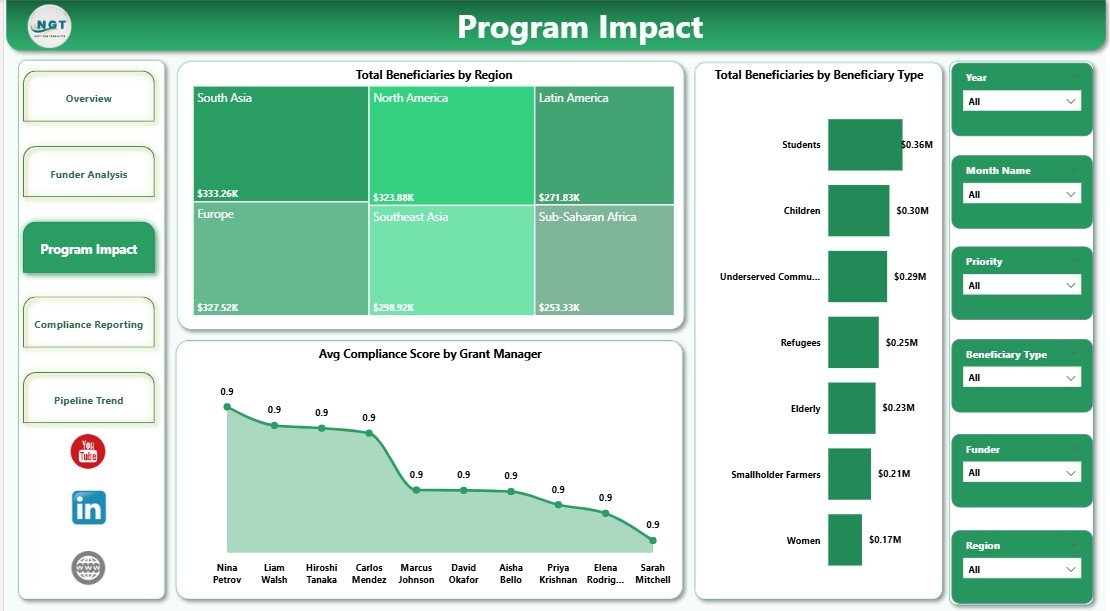
Nonprofit Grant Dashboard in Power BI – Program Impact Page
🔹 Page 3 — Program Impact: Three impact-focused visuals — Total Beneficiaries by Region, Total Beneficiaries by Beneficiary Type, and Avg Compliance Score by Grant Manager. Essential for reporting program reach and accountability to donors.
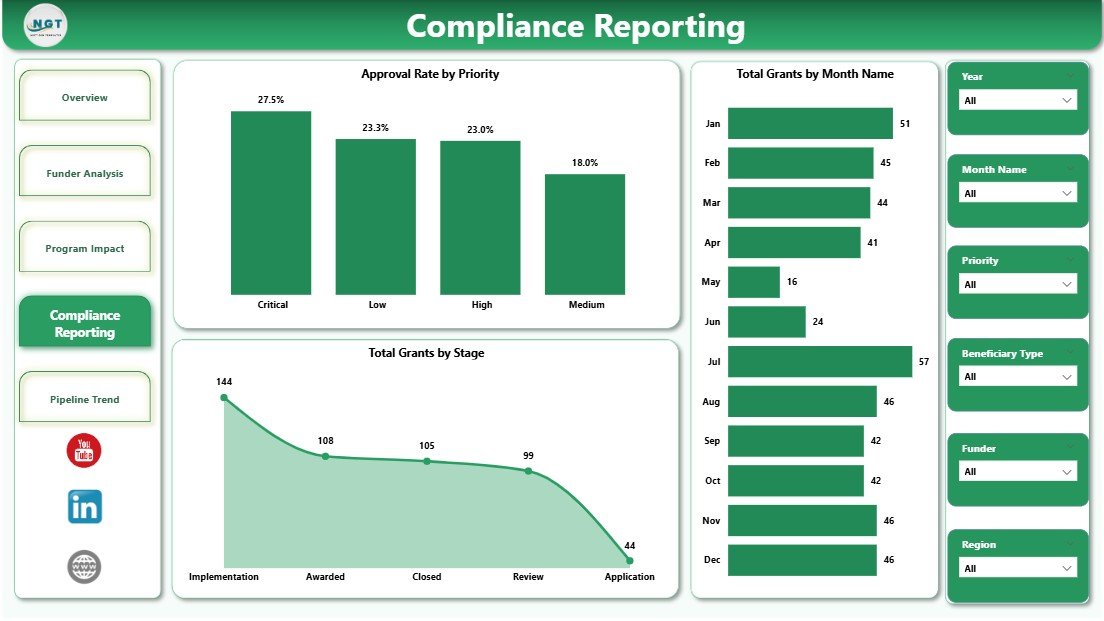
Nonprofit Grant Dashboard in Power BI – Compliance Reporting Page
🔹 Page 4 — Compliance Reporting: Three compliance visuals — Approval Rate by Priority, Total Grants by Month Name, and Total Grants by Stage. Provides the audit trail data nonprofits need for board reporting and grant renewals.
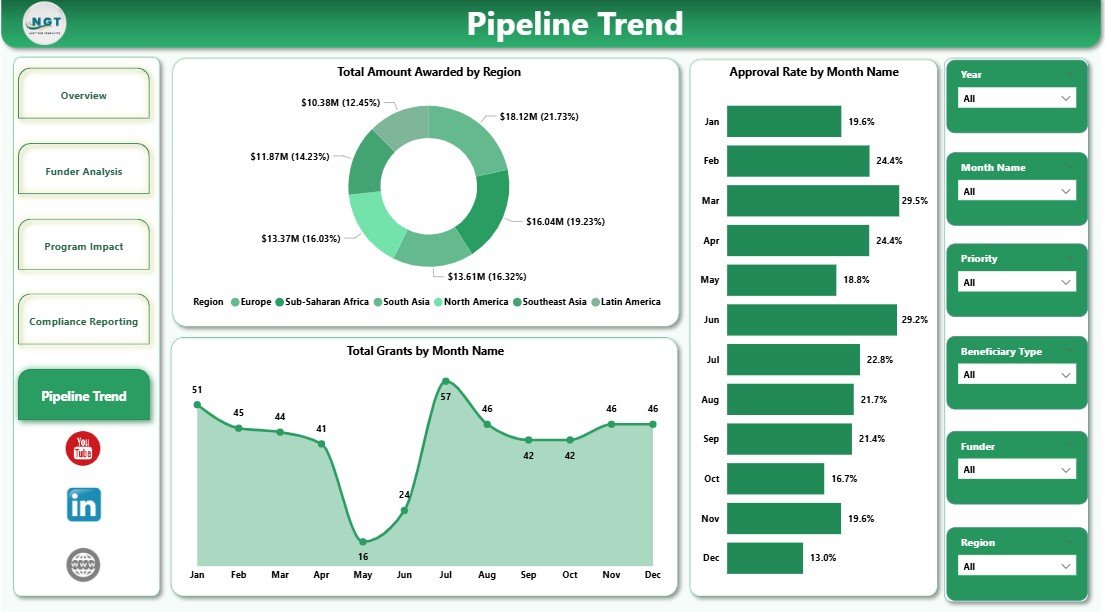
Nonprofit Grant Dashboard in Power BI – Pipeline Trend Page
🔹 Page 5 — Pipeline Trend: Three trend visuals — Total Amount Awarded by Region, Approval Rate by Month Name, and Total Grants by Month Name. Helps leadership spot seasonal funding patterns and plan application timelines strategically.
📊 Nonprofit Grant Dashboard in Power BI vs. Tableau / Qlik vs. Fluxx Grants Management
| Feature | Nonprofit Grant Dashboard in Power BI | Tableau / Qlik Sense | Fluxx / Salesforce Grants Mgmt |
|---|---|---|---|
| Cost | $17.99 one-time | $70–$115/user/month | $500–$2,000+/month |
| Platform | Power BI Desktop (free) | Requires paid license | Cloud-only SaaS |
| Setup Time | Under 10 minutes | Days to weeks | Weeks to months |
| Grant-Specific KPIs | ✅ 12+ pre-built | Build from scratch | ✅ Included |
| No Subscription | ✅ One-time purchase | ❌ Monthly required | ❌ Annual contract |
| Customizable Fields | ✅ Full Power BI access | ✅ Yes | Limited without dev work |
| Compliance Reporting | ✅ Built-in page | Manual build required | ✅ Included |
| Year-1 Cost (5 users) | $17.99 total | $4,200–$6,900 | $6,000–$24,000 |
For nonprofits that need grant tracking and compliance reporting without a five-figure annual SaaS contract, the Nonprofit Grant Dashboard in Power BI sits in the sweet spot.
👥 Who This Template Is For — and Who It’s Not For
✅ This template is built for:
- Nonprofit grant managers tracking 5–200 active grants across multiple funders
- Development directors who need board-ready funder analysis reports monthly
- Program officers responsible for documenting beneficiary reach and compliance scores
- Small-to-midsize nonprofits that cannot justify $500+/month for dedicated grants management software
- Organizations already using Power BI Desktop for other reporting
❌ This template is NOT for:
- Enterprise nonprofits needing real-time cloud collaboration for 50+ simultaneous users
- Organizations requiring native grant application submission workflows
- Teams with no Power BI experience and no willingness to learn the basics of data connection
⚙️ How to Use the Nonprofit Grant Dashboard in Power BI
- Download the .pbix file immediately after purchase — instant delivery to your account.
- Open in Power BI Desktop — download the free app from Microsoft if you haven’t already.
- Connect your data — replace the sample grant dataset with your own Excel, CSV, or database source.
- Refresh the model — all 5 dashboard pages and 14+ charts update automatically.
- Apply slicers — filter by funder, program area, region, grant stage, or time period.
- Share reports — publish to Power BI Service or export as PDF for board presentations.
💼 Real-World Use Cases
Maria manages grants at a 20-person human services nonprofit. Every quarter, she presents a funding report to her board showing which program areas received the most money, which funders had the highest approval rates, and whether compliance scores by grant manager are trending up or down. Before this dashboard, she built these charts manually in Excel for 4 hours every quarter. Now she refreshes one .pbix file and her board report is ready in 20 minutes.
James leads development at an international NGO with 40 active grants. He uses the Pipeline Trend page to spot which months historically deliver the highest approval rates, allowing his team to front-load grant applications in strong windows. The Funder Analysis page helps him rank funders by ROI — total beneficiaries per dollar awarded.
A regional community foundation grants officer uses the Compliance Reporting page to track every grant from application to close. The Total Grants by Stage chart instantly flags grants stuck in review, and the Approval Rate by Priority visual confirms whether high-priority grants are converting at higher rates.
❓ Frequently Asked Questions
What KPIs does the Nonprofit Grant Dashboard in Power BI track?
The Nonprofit Grant Dashboard in Power BI tracks 12+ KPIs including Total Grants, Total Beneficiaries, Total Amount Spent, Total Amount Requested, Total Amount Awarded, Approval Rate, grant stage distribution, and beneficiary breakdowns by region and type. All metrics update automatically when you replace sample data.
Do I need a paid Power BI license to use this dashboard?
No paid license is required. The Nonprofit Grant Dashboard in Power BI runs on Power BI Desktop, which Microsoft offers as a free download. You only need a Power BI Pro or Premium license if you want to publish and share reports via the Power BI Service cloud platform.
How long does setup take?
Setup takes under 10 minutes. Download the .pbix file, open it in Power BI Desktop, connect your grant data source (Excel, CSV, or database), and all 5 pages and 14+ charts refresh automatically. No DAX formula writing or visual building needed.
How does this compare to Fluxx or Salesforce Grants Management?
The Nonprofit Grant Dashboard in Power BI costs $17.99 one-time versus $500–$2,000+ per month for Fluxx or Salesforce Grants Management. It covers grant analytics and compliance reporting but does not include grant application intake workflows. For analytics-focused nonprofits on a budget, this delivers 80% of the insight at under 1% of the cost.
Can I customize the charts or add new KPIs?
Yes. As a standard .pbix file, you have full access to Power BI’s report canvas to add, remove, or modify any visual, create new DAX measures, rename fields, or adjust filters to match your organization’s exact grant taxonomy.
Does this work with Excel data?
Yes. The Nonprofit Grant Dashboard in Power BI connects to Excel (.xlsx) data files as its primary source. You can also connect to CSV files, SharePoint lists, SQL databases, or any other source supported by Power BI’s data connectors.
Is the dashboard suitable for foundation reporting to donors?
Yes. The Program Impact page tracks Total Beneficiaries by Region and Beneficiary Type, plus Average Compliance Score by Grant Manager — the three data points most commonly requested by foundations in grant progress reports. Export the pages as PDF for a polished donor-ready report.
👤 About the Author
Built by PK — Microsoft Certified Professional with 15+ years of Excel, Google Sheets, and Power BI experience. Founder of NextGenTemplates, reaching 300K+ subscribers across YouTube channels (@PK-AnExcelExpert, @NextGenTemplates, @NeoTechNavigators). Every template is hand-built and tested before release.
🔗 Explore Related Templates
Also available as the Nonprofit Grant Dashboard in Excel — same grant analytics in a spreadsheet format. Explore all Power BI Dashboards from NextGenTemplates:
- Grant Management KPI Dashboard in Google Sheets
- Fundraising Campaign KPI Dashboard in Google Sheets
- Educational NGOs KPI Dashboard in Excel
📖 Click here to read the Detailed Blog Post
🎥 Visit our YouTube channel for step-by-step video tutorials
👉 YouTube.com/@NextGenTemplates


Reviews
There are no reviews yet.