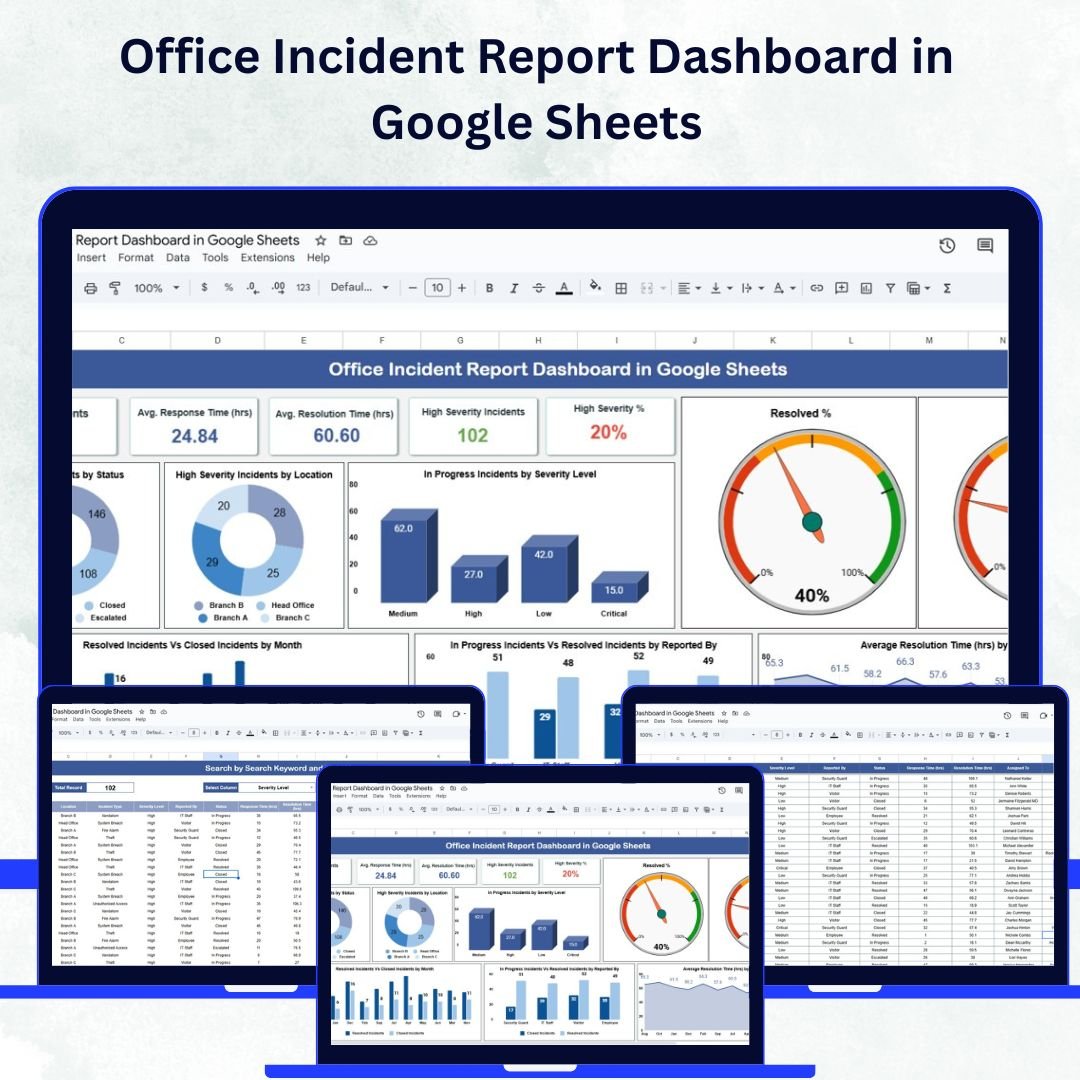
Every organization faces incidents — from workplace safety concerns to operational issues — that require structured tracking and timely response. The Office Incident Report Dashboard in Google Sheets is a ready-to-use, interactive solution designed to help businesses record, analyze, and manage workplace incidents efficiently. Built with simplicity and automation in mind, this dashboard provides real-time visibility into incident trends, severity levels, and resolution times — all within the collaborative environment of Google Sheets. 💼✅
This dashboard enables operations, security, and HR teams to make data-driven decisions, prioritize high-severity cases, and ensure a safer, more compliant workplace.
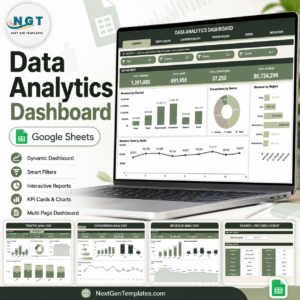
🔑 Key Features of the Office Incident Report Dashboard
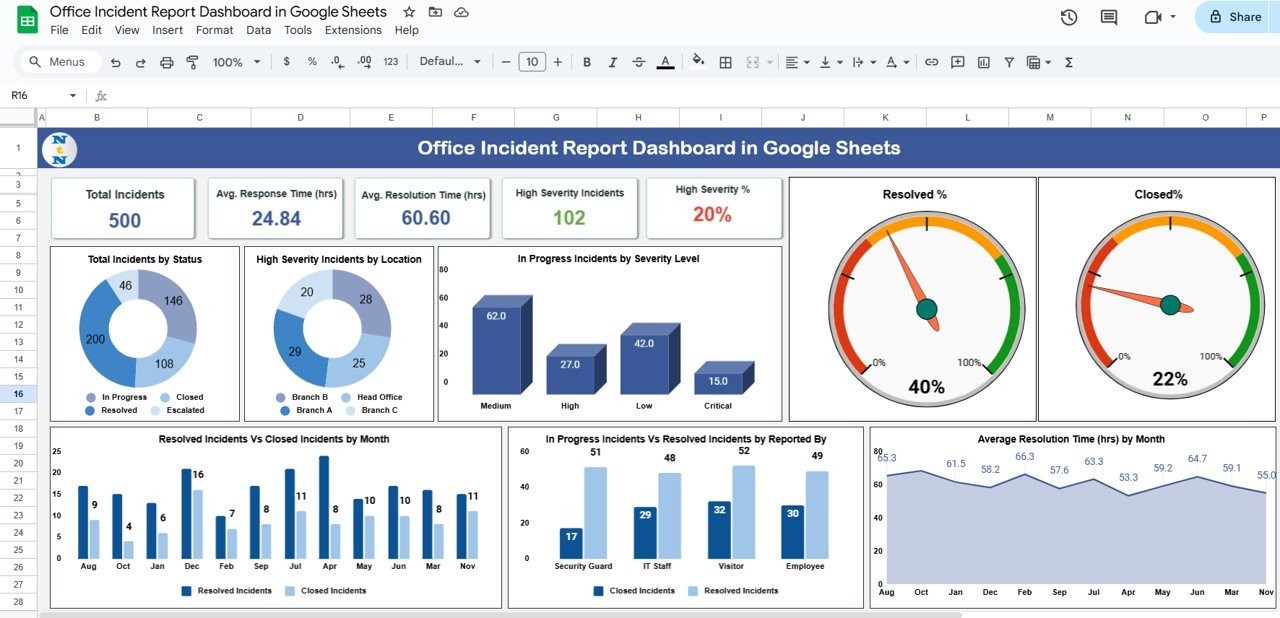
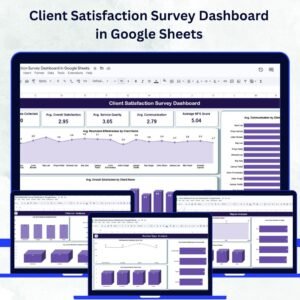
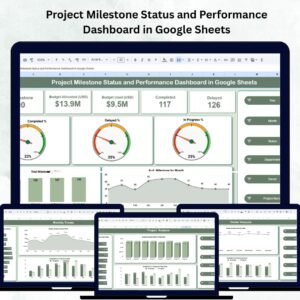
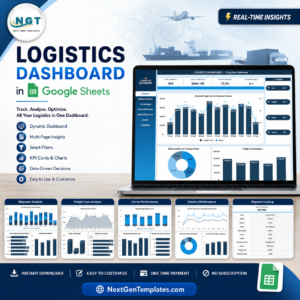
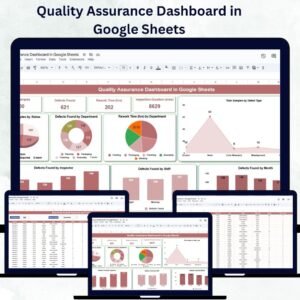
📊 Dashboard Sheet Tab
Get a visual, high-level snapshot of all reported incidents with smart metrics and charts:
-
Cards:
-
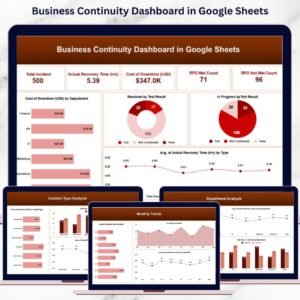
Total Incidents – Count of all reported incidents
-
Avg. Response Time (hrs) – Measure responsiveness
-
Avg. Resolution Time (hrs) – Evaluate efficiency in resolving cases
-
High Severity Incidents – Track critical issues
-
High Severity % – Identify what percentage of total incidents are high risk
-
-
Charts:
-
Total Incidents by Status – Open, In Progress, Resolved, Closed
-
High Severity Incidents by Location – Monitor where critical incidents occur most
-
In Progress Incidents by Severity Level – Spot unresolved high-risk areas
-
Resolved % and Closed % – Measure overall performance
-
Average Resolution Time by Month – Identify long-term improvement
-
Resolved vs. Closed Incidents by Month – Track closure rate trends
-
This sheet provides real-time monitoring, enabling managers to take quick action on open or escalated incidents.
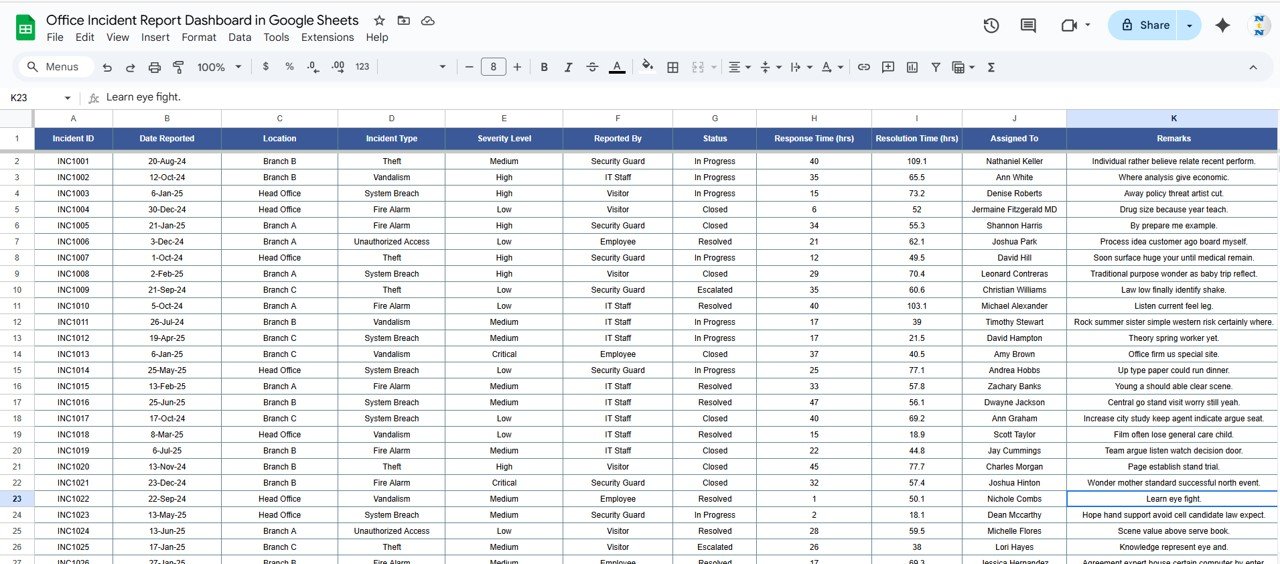
📑 Data Sheet Tab
The foundation of the dashboard — a structured and easy-to-update database that powers all reports.
-
Record essential details: Date, Location, Department, Reporter, Severity, Response Time, Resolution Time, and Status
-
Each update automatically refreshes all dashboard metrics and visuals
-
Keeps data accurate, organized, and audit-ready
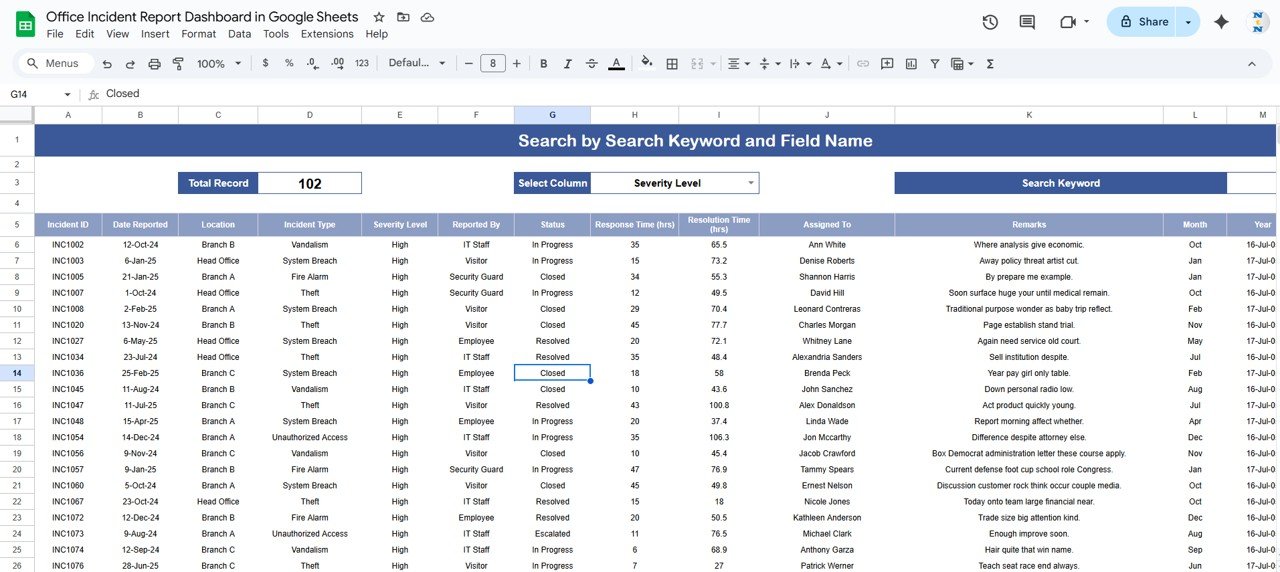
🔍 Search Sheet Tab
Instantly locate incidents without scrolling or filtering manually.
-
Search by Keyword or Field Name (e.g., Department, Reporter, Severity)
-
Retrieve incident details in seconds for quick action
-
Ideal for compliance checks, investigations, or team reviews
📦 What’s Inside the Dashboard?
✅ Pre-built Dashboard Sheet with visual metrics and charts
✅ Data Sheet for incident input and automation
✅ Search Sheet for easy record lookup
✅ Auto-updating visuals linked to your data
✅ Sample data to help you understand the structure instantly
✅ Customizable fields for department, severity, and status
🧑💼 Who Can Benefit from This Dashboard?
🎯 HR Teams – Track safety, harassment, or HR-related incidents confidentially
🎯 Operations Managers – Analyze response and resolution times to improve processes
🎯 Security Officers – Monitor critical incidents and high-severity cases
🎯 Executives & Compliance Officers – Get a consolidated, visual report of incident trends
🎯 Large & Small Organizations – Scalable and simple to adapt to any workplace
🧪 How to Use the Office Incident Report Dashboard
-
Record Incidents: Enter details in the Data Sheet — all visuals update automatically.
-
Review Dashboards: Analyze key metrics like response and resolution times.
-
Search Quickly: Use the Search Tab to find any incident instantly.
-
Monitor Trends: Identify recurring issues by month, department, or severity.
-
Improve Processes: Use data insights to refine your safety and reporting protocols.
This dashboard is 100% plug-and-play — no coding, no macros, no complex setup required. ⚙️
🌟 Why Choose This Dashboard?
-
🧾 Centralized Incident Management: One unified system for tracking and analysis
-
📈 Real-Time Updates: Dashboards refresh instantly with each new record
-
🚨 Prioritize Critical Cases: Focus on high-severity incidents first
-
⏱️ Performance Metrics: Measure efficiency through response and resolution times
-
🧠 Data-Driven Decision Making: Identify trends and areas for improvement
-
💡 Fully Customizable: Adapt KPIs, visuals, and data fields to your needs
-
🌐 Collaborative Access: Built on Google Sheets for real-time team updates
The Office Incident Report Dashboard in Google Sheets empowers organizations to enhance workplace safety, improve accountability, and streamline reporting — all with zero technical hassle. 🌟
🔗 Click here to read the Detailed blog post
Watch the step-by-step video Demo:


Reviews
There are no reviews yet.