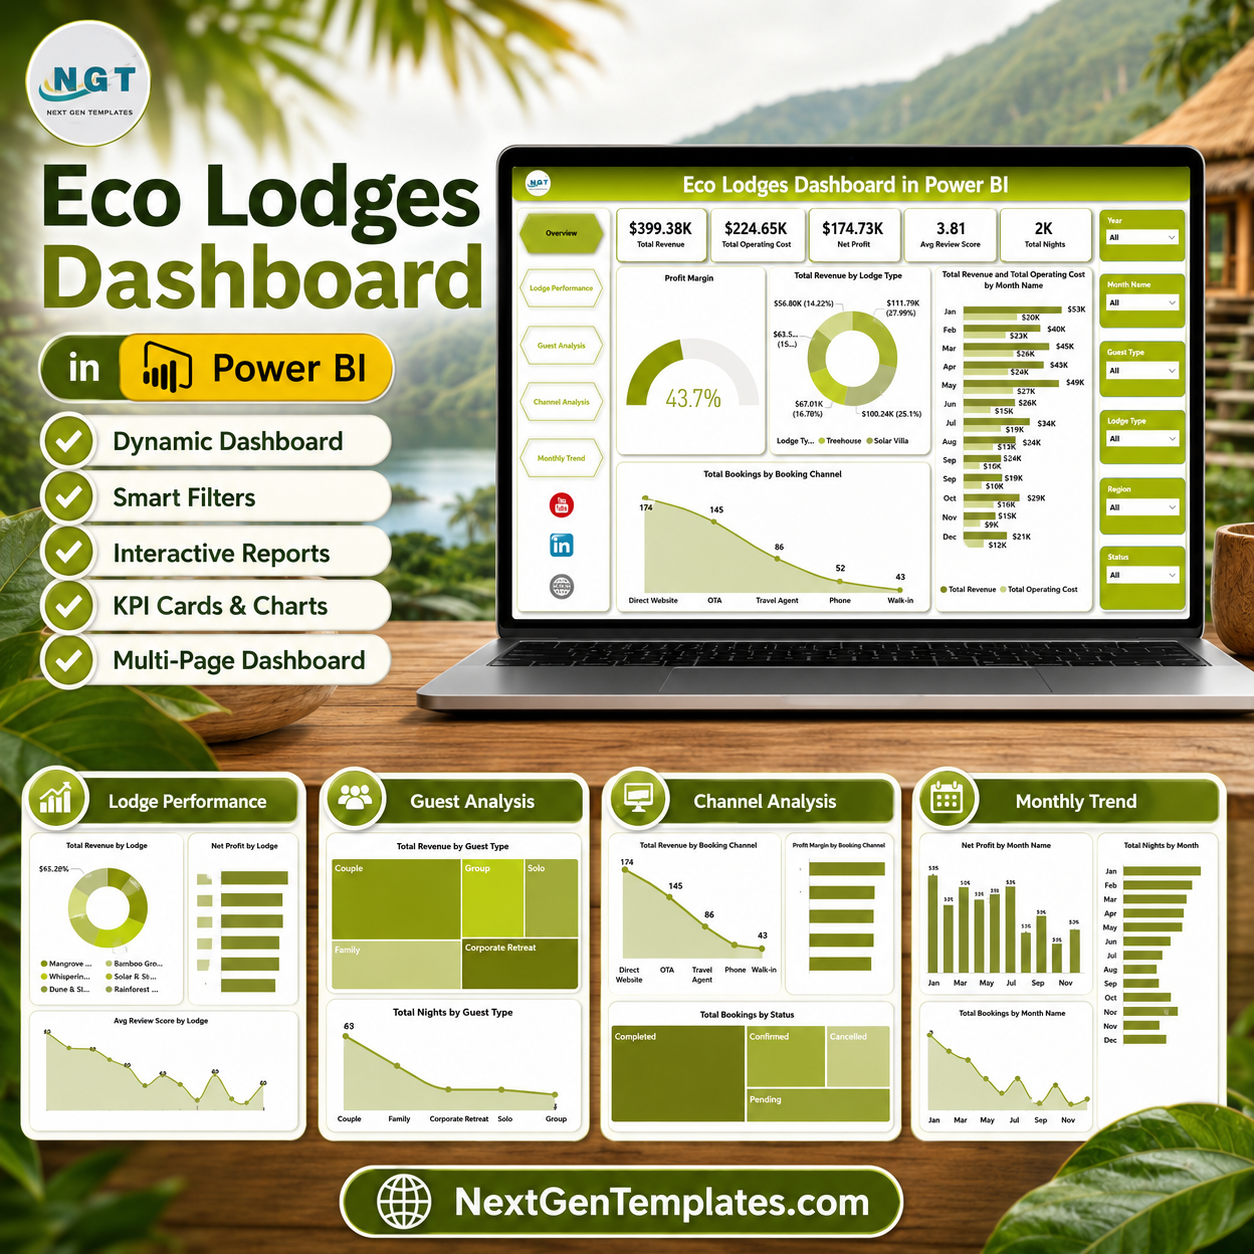

Eco Lodges Dashboard in Power BI helps eco-lodge owners, hospitality managers, sustainable tourism operators, finance teams, and guest-experience analysts review revenue, operating cost, net profit, bookings, nights, guest types, lodge performance, booking channels, and monthly trends in one editable PBIX report. Instead of building a Power BI model and report pages from scratch or paying for a recurring hotel analytics system, this template gives you a one-time purchase dashboard with instant download, a clean 5-page reporting structure, interactive slicers, and visuals designed for eco-lodge decision making.
The report is built for practical business reviews. Use it to see which lodge types generate the most revenue, which booking channels bring profitable guests, how operating cost moves month by month, and where review scores are strongest. Open the PBIX file in Power BI Desktop, replace the sample data with your own approved source, refresh the report, and use slicers to explore the dashboard quickly.
Key Features of Eco Lodges Dashboard in Power BI
- 5 Power BI pages: Overview, Lodge Performance, Guest Analysis, Channel Analysis, and Monthly Trend.
- Executive KPI cards: Total Revenue, Total Operating Cost, Net Profit, Avg Review Score, and Total Nights.
- Revenue and cost tracking: Review lodge revenue, operating cost, profit margin, and monthly financial movement.
- Lodge performance views: Compare total revenue, net profit, and average review score by lodge.
- Guest segment reporting: Analyze revenue, total nights, and review scores by guest type.
- Channel analytics: Monitor revenue by booking channel, booking status, and profit margin by channel.
- Monthly trend analysis: Track net profit, total bookings, and total nights by month name.
- Interactive slicers: Filter the report during owner, finance, operations, and marketing reviews.
- Editable PBIX file: Customize visuals, colors, fields, measures, and pages in Power BI Desktop.
What’s Inside the Eco Lodges Dashboard in Power BI
1. Overview Page
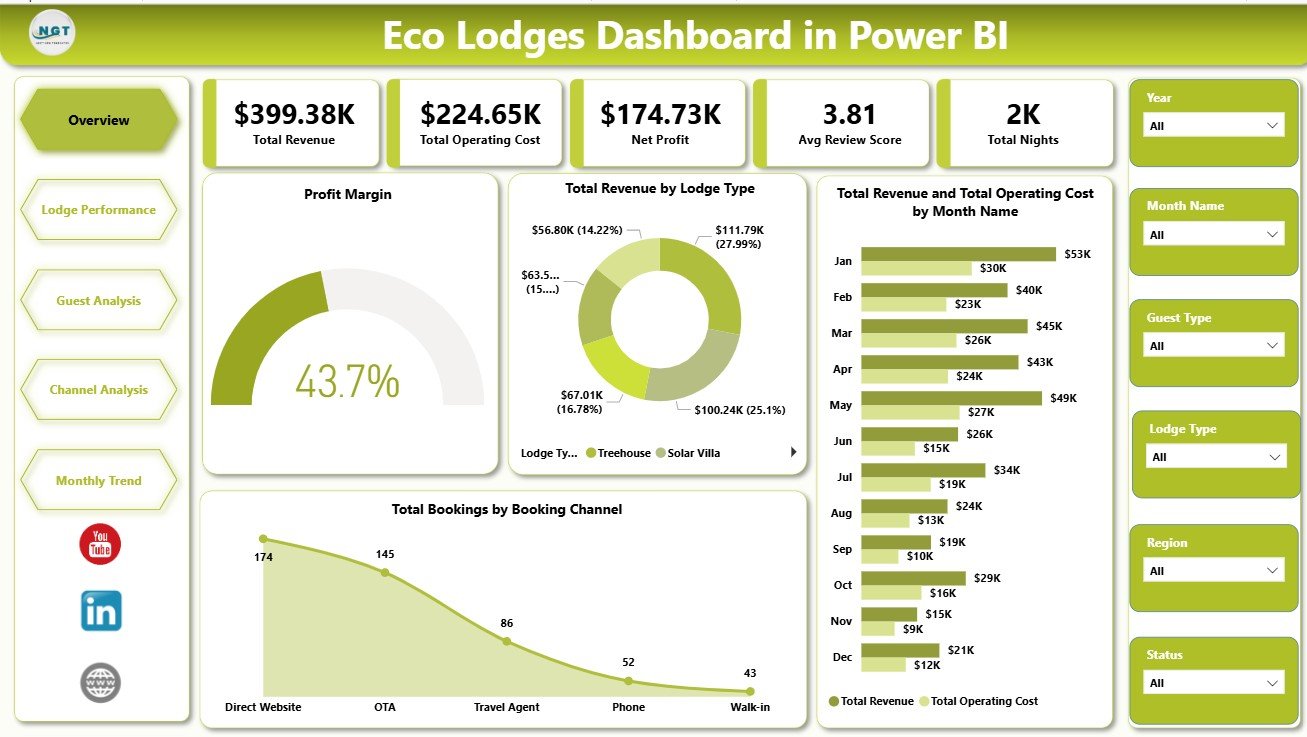
The Overview page gives management a high-level view of eco-lodge performance. The KPI cards show Total Revenue, Total Operating Cost, Net Profit, Avg Review Score, and Total Nights, so users can understand financial results, guest experience, and stay volume before moving into detailed analysis.
Profit Margin by Overall Bookings: This chart helps users understand how efficiently bookings are converting into profit. It is useful for checking whether booking growth is producing healthy margins.
Total Revenue by Lodge Type: This chart compares revenue across accommodation types. It helps identify which lodge types are driving the strongest sales contribution.
Total Revenue and Total Operating Cost by Month Name: This chart compares revenue and cost movement across months. It helps managers spot months where cost pressure is reducing profit.
Total Bookings by Booking Channel: This chart shows booking volume by channel. It helps teams understand where reservations are coming from and which channels deserve attention.
Eco Lodges Dashboard in Power BI
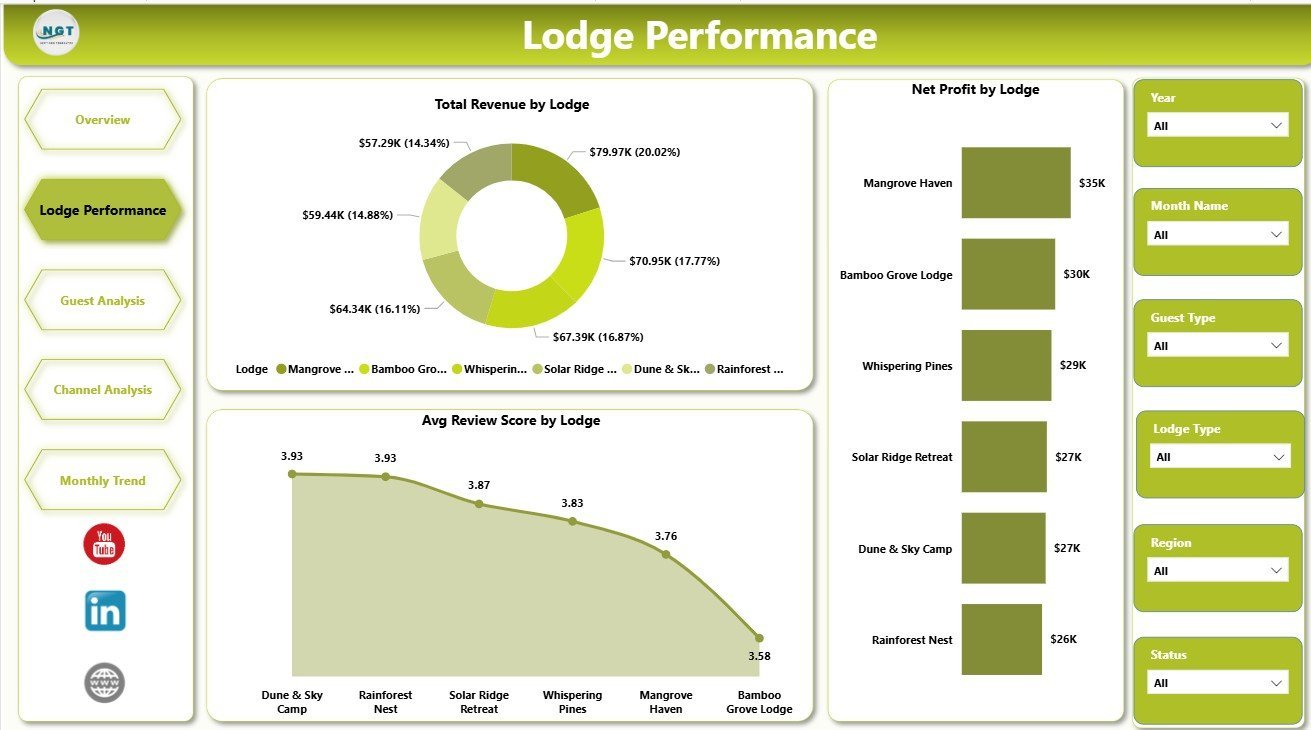
2. Lodge Performance
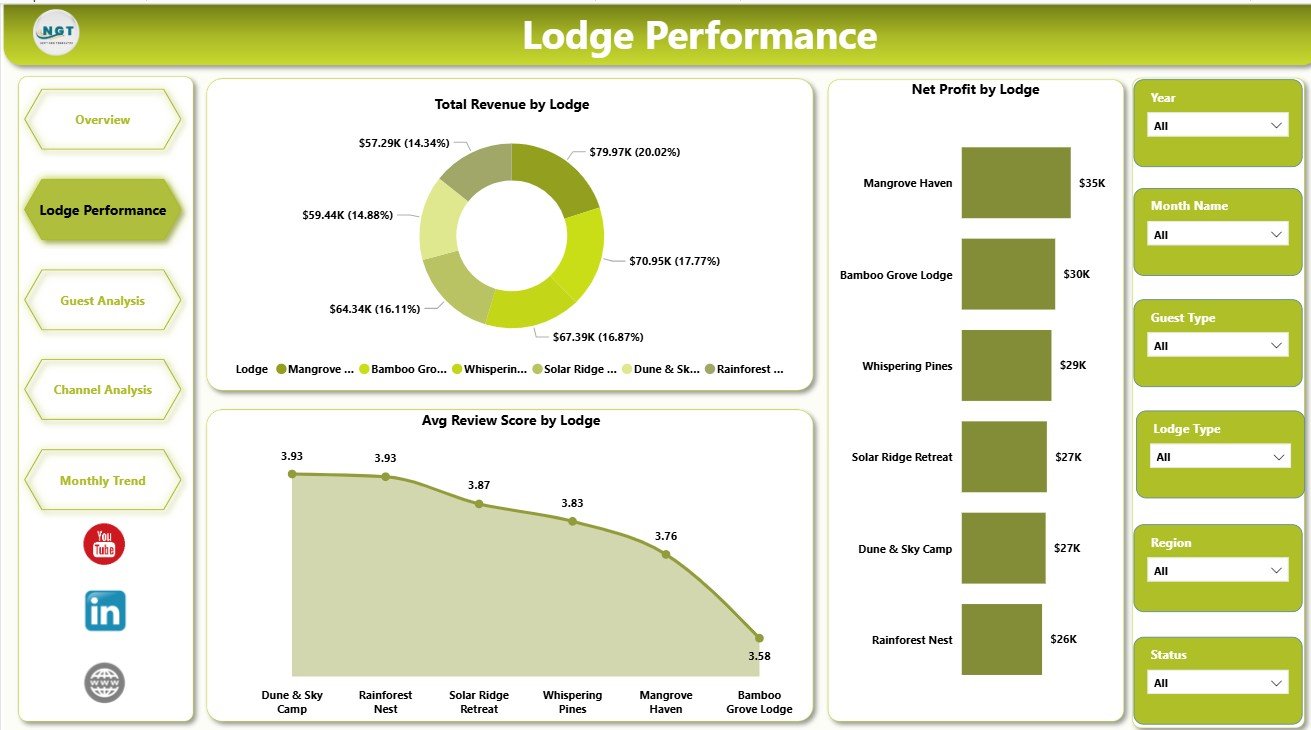
The Lodge Performance page compares each lodge location or property. It includes Total Revenue by Lodge, Net Profit by Lodge, and Avg Review Score by Lodge, helping managers see which lodges are financially strong and which locations may need pricing, service, or cost attention.
Lodge Performance
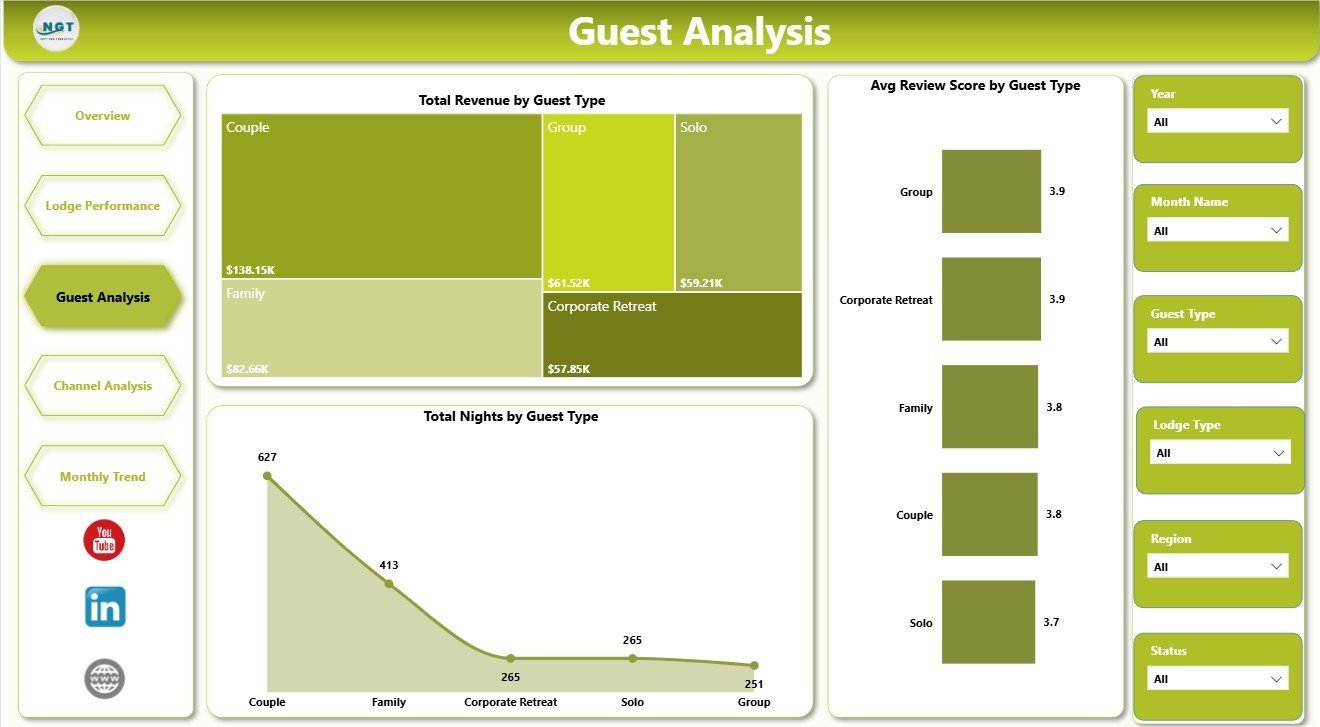
3. Guest Analysis
The Guest Analysis page focuses on guest segments. It includes Total Revenue by Guest Type, Total Nights by Guest Type, and Avg Review Score by Guest Type, so teams can understand which guests stay longer, spend more, and rate the experience higher.

Guest Analysis
4. Channel Analysis
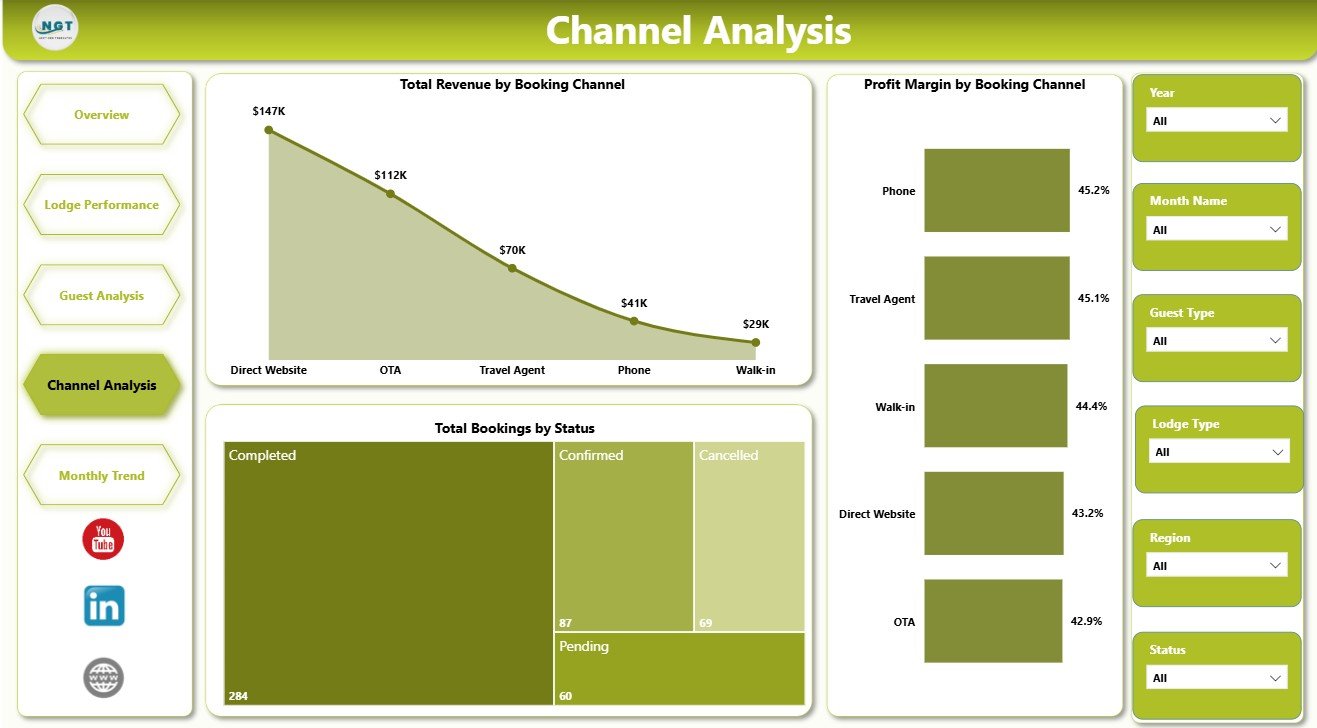
The Channel Analysis page reviews booking-source performance. It includes Total Revenue by Booking Channel, Total Bookings by Status, and Profit Margin by Booking Channel, helping users compare channel value, booking status mix, and profitability quality.
Channel Analysis
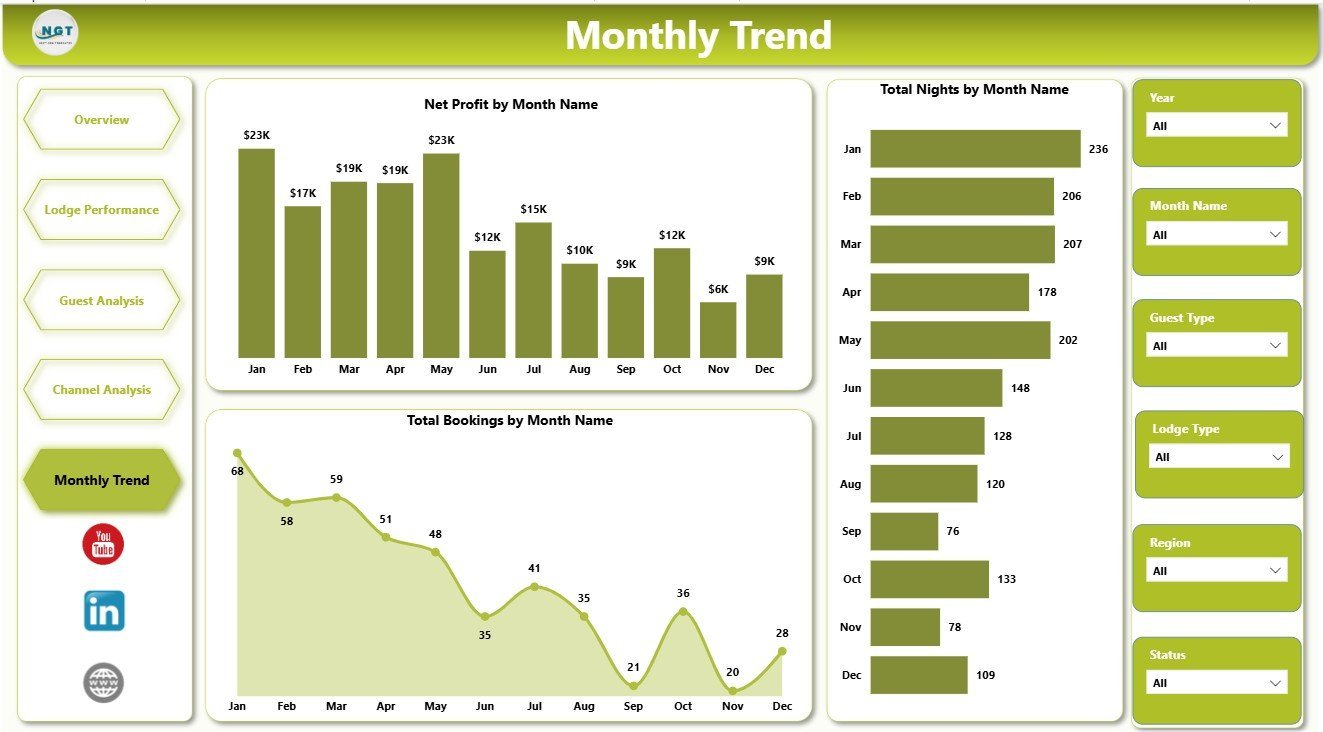
5. Monthly Trend
The Monthly Trend page shows time-based movement. It includes Net Profit by Month Name, Total Bookings by Month Name, and Total Nights by Month Name, helping teams identify seasonality, growth periods, and months that need deeper review.

Monthly Trend
Eco Lodges Dashboard in Power BI vs. Tableau vs. Paid Hotel SaaS – Where This Fits
| Feature | This Power BI Dashboard | Tableau or Qlik Alternative | Paid Hotel SaaS |
|---|---|---|---|
| Cost | $17.99 one-time | BI license or build cost | Monthly or annual subscription |
| Platform | Power BI Desktop / Service | BI platform setup required | Vendor cloud system |
| Setup time | Open PBIX, replace data, refresh | Build model and dashboard | Implementation and onboarding |
| Customizable fields | Editable report and model | Editable with BI skills | Limited by vendor settings |
| Share with link | Possible through Power BI Service | Possible with cloud setup | Usually login controlled |
| Year-1 cost at 5 users | $17.99 plus Microsoft licensing | Usually much higher | Often hundreds or thousands |
| Eco-lodge reporting | Built in across 5 pages | Must be designed | Depends on vendor module |
Who This Template Is For – and Who It’s Not For
This template is for eco-lodge owners, resort operators, sustainable tourism teams, hospitality analysts, finance teams, and Power BI users who need structured reporting for revenue, cost, profit, nights, bookings, guest types, lodge performance, channels, and monthly movement.
It is not a reservation system, PMS, channel manager, accounting system, payment platform, or live guest CRM. Use it as a reporting layer after your booking or lodge data has been exported, connected, or prepared for Power BI.
How to Use the Eco Lodges Dashboard in Power BI
- Download and unzip the file.
- Open the PBIX file in Power BI Desktop.
- Replace the sample data or connect your approved eco-lodge data source.
- Refresh the report to update cards, charts, slicers, and pages.
- Use slicers to filter by month, lodge, lodge type, guest type, booking channel, or status.
- Customize visuals, fields, labels, colors, and measures as needed.
- Publish to Power BI Service only if it matches your Microsoft licensing and data governance rules.
Real-World Use Cases
Anita, Eco-Lodge Owner: Anita reviews Overview and Monthly Trend before monthly owner meetings to understand revenue, cost, profit, nights, and booking movement.
Rahul, Hospitality Operations Manager: Rahul uses Lodge Performance to find properties with strong review scores but weaker profit, then works with local teams on service and cost improvements.
Maria, Sustainable Tourism Consultant: Maria uses Guest Analysis and Channel Analysis to advise eco-tourism clients on which guest segments and booking channels deserve more focus.
Frequently Asked Questions
What KPI cards are included?
The Overview page includes Total Revenue, Total Operating Cost, Net Profit, Avg Review Score, and Total Nights.
Do I need Power BI Desktop?
Yes. Open the PBIX file in Power BI Desktop, which is available from Microsoft as the main authoring tool for Power BI reports.
Can I use my own eco-lodge data?
Yes. Replace the sample data or connect your approved data source, then refresh the report.
Can I customize the report pages?
Yes. The PBIX file is editable, so you can adjust visuals, fields, DAX measures, colors, slicers, and report pages.
Is this a booking management system?
No. It is a Power BI reporting dashboard. It does not manage reservations, payments, accounting entries, or guest CRM workflows.
Can I share it with my team?
Yes. You can share the PBIX internally or publish through Power BI Service according to your Microsoft licensing and data security policies.
About the Author
Built by PK – Microsoft Certified Professional with 15+ years of Excel, Google Sheets, and Power BI experience. Founder of NextGenTemplates, reaching 300K+ subscribers across YouTube channels. Every template is hand-built and tested before release.
Explore Related Templates
Browse more Power BI templates and Power BI Dashboard templates. Related templates include Eco Lodges Dashboard in Excel, Destination Management Companies Dashboard in Power BI, Adventure Tourism Dashboard in Power BI, and Hotel and Hospitality Revenue Dashboard in Power BI.
Ready to analyze eco-lodge performance in Power BI? Download the Eco Lodges Dashboard in Power BI, connect your data, refresh the report, and start reviewing revenue, cost, profit, nights, guests, channels, and monthly trends today.
Last updated: June 6, 2026.


Reviews
There are no reviews yet.