



In a fast-paced and cost-sensitive business environment, procurement efficiency is critical for profitability, compliance, and supply chain stability. The Procurement KPI Scorecard in Google Sheets is a ready-to-use, interactive tool that helps procurement teams measure and analyze key performance indicators (KPIs) — all within one centralized and visual dashboard.
This scorecard empowers managers to track purchase order efficiency, supplier reliability, cost savings, and compliance metrics effortlessly. Built in Google Sheets, it combines the simplicity of spreadsheets with the power of automated dashboards, offering real-time insights, collaborative access, and color-coded performance alerts for smart decision-making.
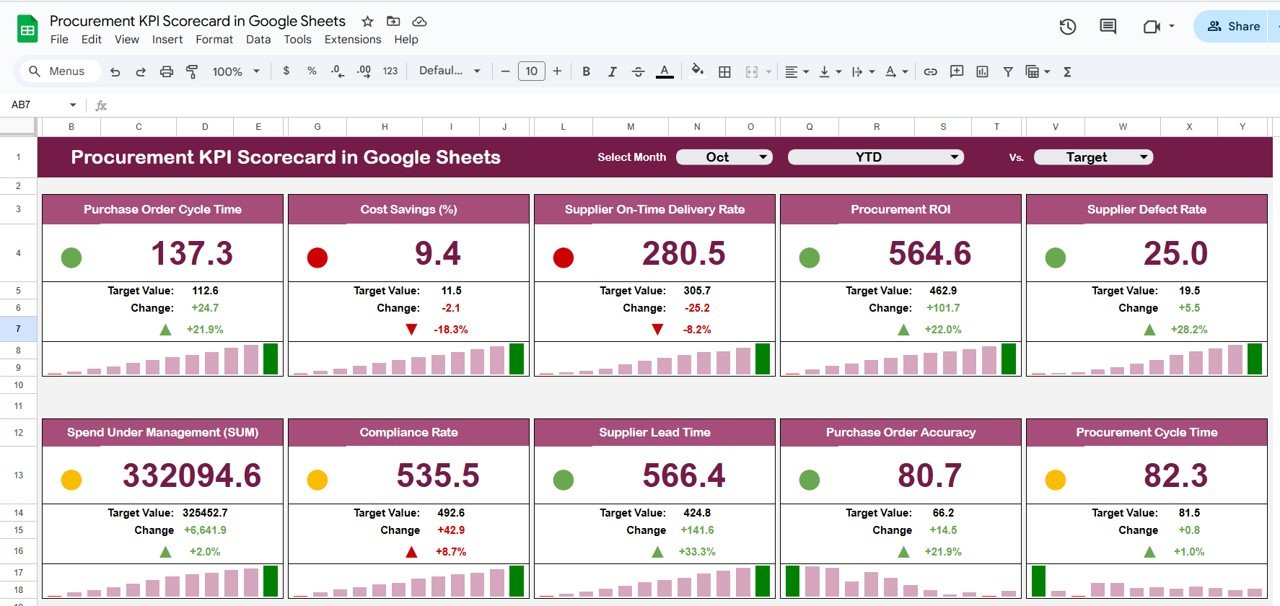
🎯 What Is a Procurement KPI Scorecard?
A Procurement KPI Scorecard is a structured analytics tool designed to evaluate procurement performance through measurable indicators. It consolidates cost, efficiency, and supplier data into one visual interface, making it easier to identify trends, monitor targets, and drive improvements.
With this Google Sheets-based scorecard, you can:
Track MTD (Month-to-Date) and YTD (Year-to-Date) procurement KPIs
Compare performance against targets and previous year data
Use traffic-light indicators and arrows for instant visualization
Analyze supplier performance and cost optimization
This scorecard eliminates manual reporting work, ensures consistency, and supports data-driven procurement management.
🔑 Key Features of the Procurement KPI Scorecard
🧭 1. Dashboard Sheet Tab
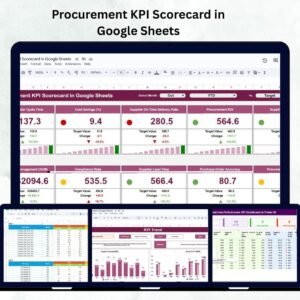
The Dashboard Sheet is the primary control center for procurement insights.
Highlights:
📅 Month Dropdown (Cell D3): Select a month to view MTD data dynamically.
🔄 Auto-Updates: All KPIs, charts, and icons refresh automatically.
🔼 Visual Indicators:
Green Arrow – KPI above target
Red Arrow – KPI below target
🚦 Traffic-Light Color Codes: Red (Needs Improvement), Yellow (Moderate), Green (Good)
📈 MTD/YTD Toggle: Switch between monthly and yearly performance views
This tab provides an instant snapshot of procurement efficiency, cost control, and supplier performance.
📊 2. KPI Trend Sheet Tab
Analyze how your procurement KPIs have evolved over time.
Features Include:
KPI Selection (Cell C3) – Choose any KPI to view trends
Displays KPI Group, Unit, Formula, and Type (UTB/LTB)
Interactive line or combo charts for visual comparison
Track cost savings, lead times, or supplier compliance monthly or quarterly
This sheet helps identify seasonal fluctuations, efficiency improvements, and performance gaps.
📘 3. KPI Definition Sheet Tab
Maintain KPI consistency and transparency with clear definitions.
Columns Include:
KPI Name
KPI Group (e.g., Cost, Quality, Efficiency, Compliance)
Unit of Measurement
Formula
Definition
Type – LTB (Lower-the-Better) or UTB (Upper-the-Better)
This ensures uniform understanding and accountability across the procurement and finance teams.
🧾 4. Data Input Sheet Tab
This is where the real data entry happens.
Functions:
Enter MTD and YTD actual values for each KPI
Record target and previous year figures
Dashboard charts auto-refresh once data is updated
The Data Input Sheet forms the analytical foundation for the entire scorecard.
⚙️ 5. Color Settings Sheet Tab
Customize your performance color thresholds with ease.
Capabilities:
Define Green, Yellow, and Red performance zones
Adjust KPI target ranges without altering formulas
Align scorecard visuals with your company’s performance policies
🌟 Advantages of Using the Procurement KPI Scorecard
📊 Real-Time Monitoring: Live KPI updates through Google Sheets automation.
📉 Cost Optimization: Identify potential savings and budget deviations.
🤝 Supplier Performance Tracking: Evaluate supplier reliability, quality, and delivery.
📈 Data-Driven Decision-Making: Base strategic choices on visual insights.
🧮 Customizable: Add or modify KPIs as per your organization’s needs.
🌍 Collaborative Access: Share and edit simultaneously with team members.
🚦 Visual Clarity: Traffic-light colors and arrows simplify interpretation.
💡 Best Practices
✅ Update Data Monthly: Keep entries consistent for accurate MTD/YTD tracking.
✅ Set Clear Thresholds: Define realistic performance zones for each KPI.
✅ Review Trends Regularly: Use the KPI Trend tab to identify recurring issues.
✅ Compare Departments: Extend the scorecard to track procurement by region or category.
✅ Engage Teams: Share visual dashboards to promote performance awareness.
🧠 How This Scorecard Supports Decision-Making
Detects inefficiencies such as delayed POs or high lead times
Tracks supplier reliability and contract compliance
Measures cost savings and purchase variance
Guides supplier negotiations and risk management
Improves procurement policy adherence and overall efficiency
🔗 Learn More
📘 Read our full guide and product documentation.
Watch the step-by-step video Demo:
🎥 Visit our YouTube channel for step-by-step video tutorials.
Compatibility and Requirements
- Works in Google Sheets with a free Google account and a web browser. Nothing to install.
- The trend charts are standard Google Sheets charts. Google explains them in Add & edit a chart or graph.
Frequently Asked Questions
What tabs are in the scorecard?
Five: Dashboard, KPI Trend, KPI Definition, Data Input and Color Settings.
How do I pick the month and view?
Choose a month from the drop-down in cell D3 on the Dashboard tab and switch between MTD and YTD. All KPIs, charts and icons refresh.
Can I change the traffic-light thresholds?
Yes. Set the green, yellow and red performance zones on the Color Settings tab without changing any formulas.
What do UTB and LTB mean?
Each KPI has a type on the KPI Definition tab. UTB means upper the better and LTB means lower the better.
Can I see how one KPI changes over time?
Yes. Select a KPI in cell C3 on the KPI Trend tab to see its trend chart with its group, unit and formula.
Who Uses This Scorecard
Procurement managers and procurement and finance teams use it to watch purchase order efficiency, supplier reliability, cost savings and compliance in one place.
Related Procurement Templates
- Procurement KPI Dashboard In Excel: the Excel KPI dashboard for procurement
- Procurement Tracker and Dashboard in Google Sheets: log purchases and report on them
- Procurement Management Dashboard in Google Sheets: a full procurement dashboard
- Supplier Performance KPI Dashboard in Excel: focus on supplier KPIs
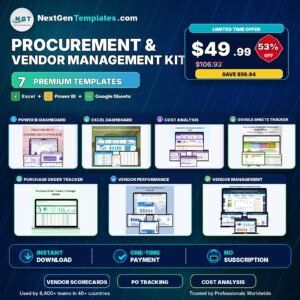
- Procurement and Vendor Management Kit: a bundle of procurement templates for Excel, Power BI and Google Sheets
Browse all Google Sheets KPI dashboards.











Reviews
There are no reviews yet.