

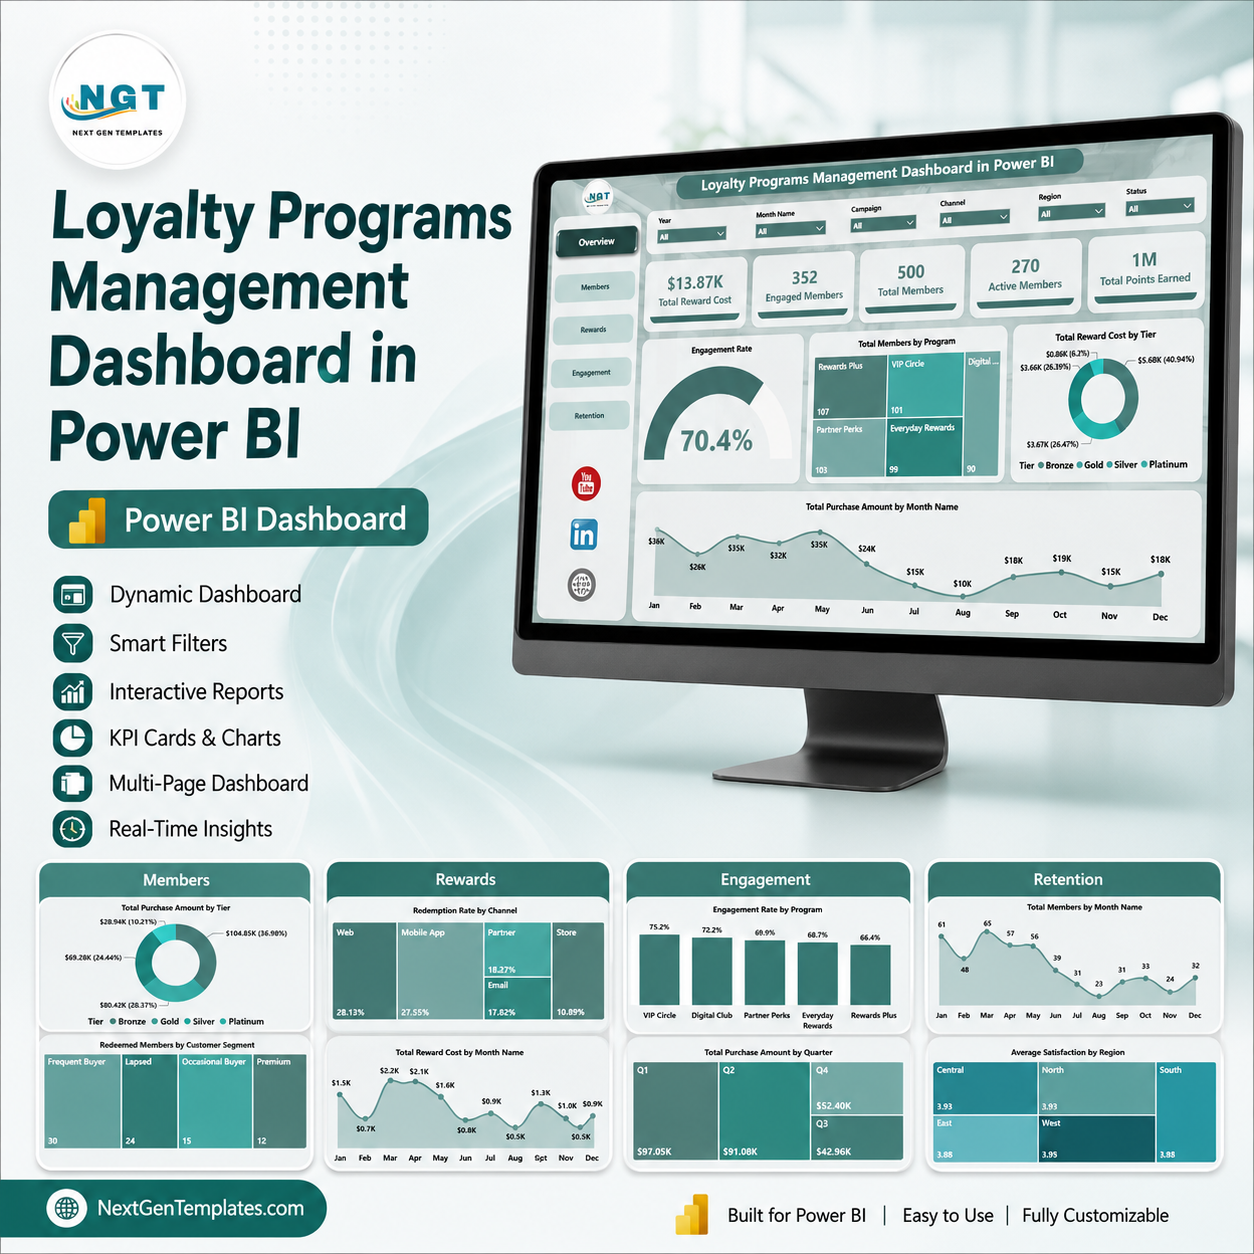
Loyalty Programs Management Dashboard in Power BI helps marketing, CRM, retail, e-commerce, and customer success teams monitor loyalty performance across 5 Power BI report pages, 5 executive KPI cards, and 16 focused analysis visuals. Loyalty programs can quickly hide cost leakage, inactive members, poor redemption patterns, and weak engagement by segment. This ready PBIX dashboard gives you a reporting layer for reward cost, members, points, purchase value, engagement, retention, tiers, channels, campaigns, and regions without building a report from a blank Power BI file.
Built by PK, Microsoft Certified Professional with 15+ years of Excel, Google Sheets, and Power BI experience and 300K+ subscribers across training channels. One-time purchase, instant ZIP download, editable PBIX file, and no monthly subscription.
Key Features of Loyalty Programs Management Dashboard in Power BI
- 5 report pages: Overview, Members, Rewards, Engagement, and Retention.
- 5 KPI cards: Total Reward Cost, Engaged Members, Total Members, Active Members, and Total Points Earned.
- 16 analysis charts: Review member growth, purchase amount, reward cost, redemptions, engagement, retention risk, satisfaction, channels, campaigns, tiers, programs, regions, and time periods.
- Interactive slicers: Filter the report by available loyalty dimensions and review focused results quickly.
- Editable Power BI file: Customize visuals, measures, page names, slicers, colors, and model logic in Power BI Desktop.
- Business-ready loyalty views: Designed for loyalty managers, CRM analysts, retail marketers, and customer retention teams.
What’s Inside the Loyalty Programs Management Dashboard in Power BI
1 – Overview Page
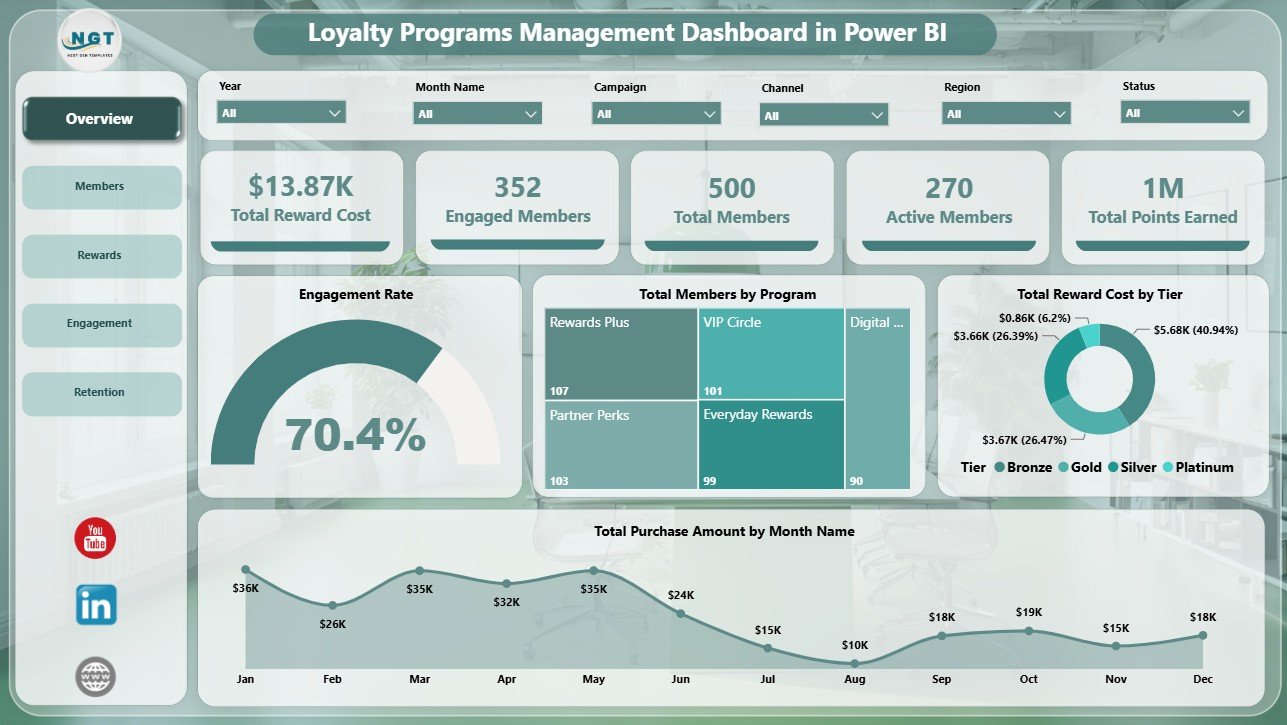
The Overview page gives leadership a quick reading of loyalty program health through Total Reward Cost, Engaged Members, Total Members, Active Members, and Total Points Earned. Slicers make it easy to filter the dashboard and review the selected program, tier, customer segment, channel, region, or time period.
Engagement Rate by Selected Filters: This visual shows how engagement changes after slicers are applied. It helps you quickly compare loyalty response across the exact member group you are reviewing.
Total Members by Program: This chart compares member count across loyalty programs. It helps identify the programs with the largest audience and those that may need stronger acquisition support.
Total Reward Cost by Tier: This visual breaks down reward cost by membership tier. It helps teams see whether premium tiers are consuming a reasonable share of reward spend.
Total Purchase Amount by Month Name: This monthly view shows how loyalty-linked purchase value moves across the year. It supports seasonality review, campaign planning, and month-to-month performance tracking.
Loyalty Programs Management Dashboard in Power BI
2 – Members
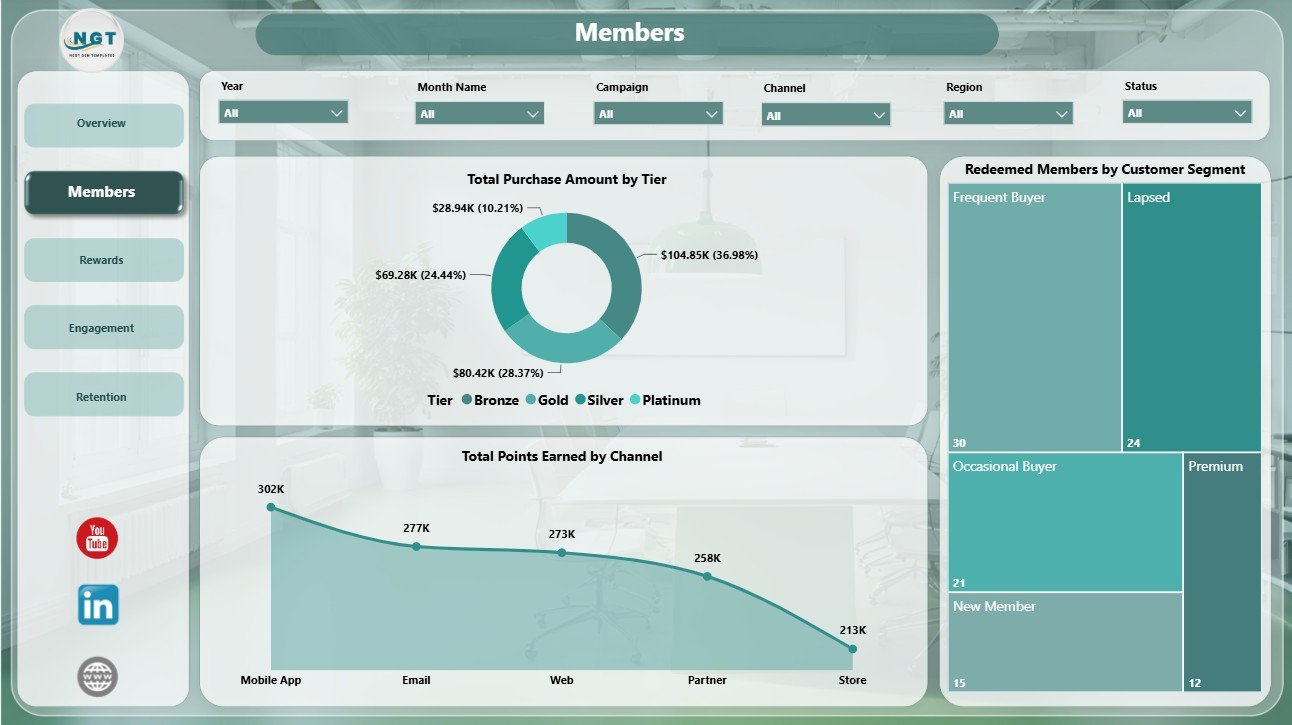
The Members page explains who is creating value in the loyalty base and where purchase activity is concentrated.
Total Purchase Amount by Tier: This chart compares purchase value across member tiers. It helps you see whether higher tiers are producing stronger spending or simply receiving more benefits.
Redeemed Members by Customer Segment: This visual shows which segments are actively redeeming rewards. It helps loyalty teams understand whether offers are reaching the intended customer groups.
Total Points Earned by Channel: This chart compares points earned across channels. It helps identify where members are collecting the most value and which channels are driving participation.
Members
3 – Rewards
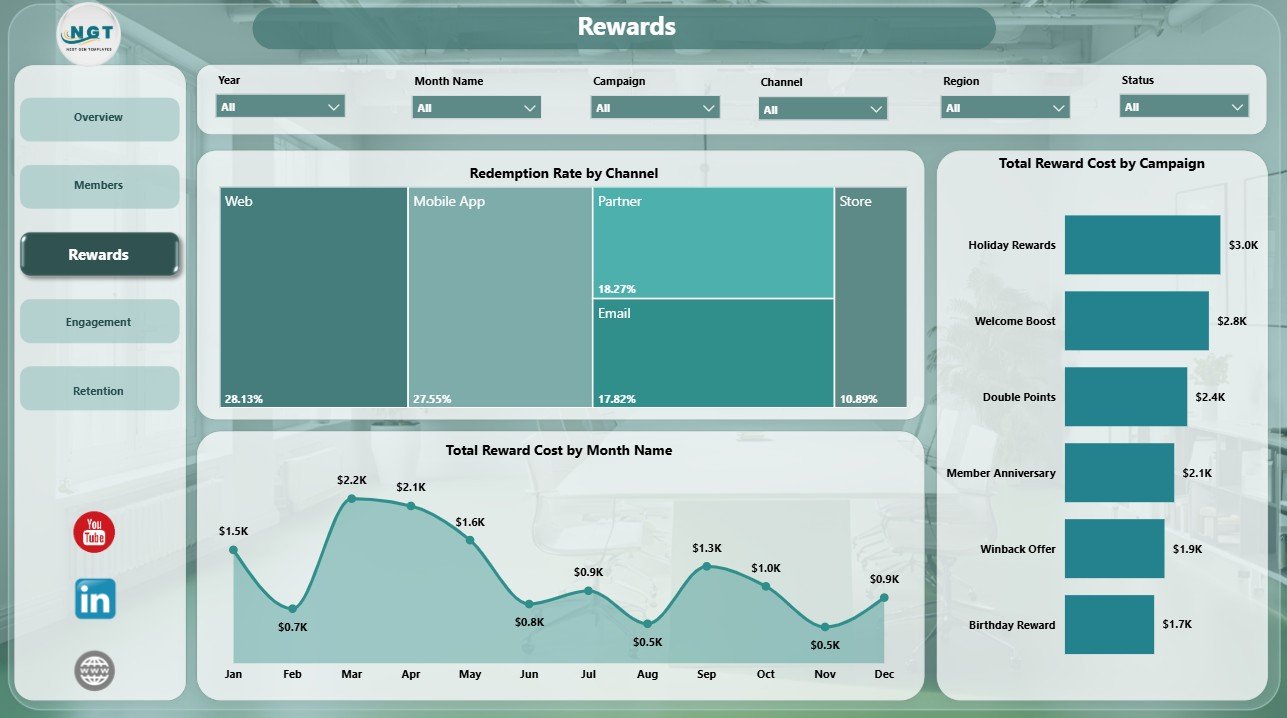
The Rewards page focuses on redemption behavior and the cost of loyalty incentives.
Redemption Rate by Channel: This chart compares redemption performance by channel. It helps identify where members are most likely to convert points or rewards into action.
Total Reward Cost by Campaign: This visual compares reward cost by campaign. It helps marketers review which campaigns are using the most incentive budget.
Total Reward Cost by Month Name: This monthly view tracks reward cost over time. It helps teams spot seasonal spikes and compare reward expense against campaign calendars.
Rewards
4 – Engagement
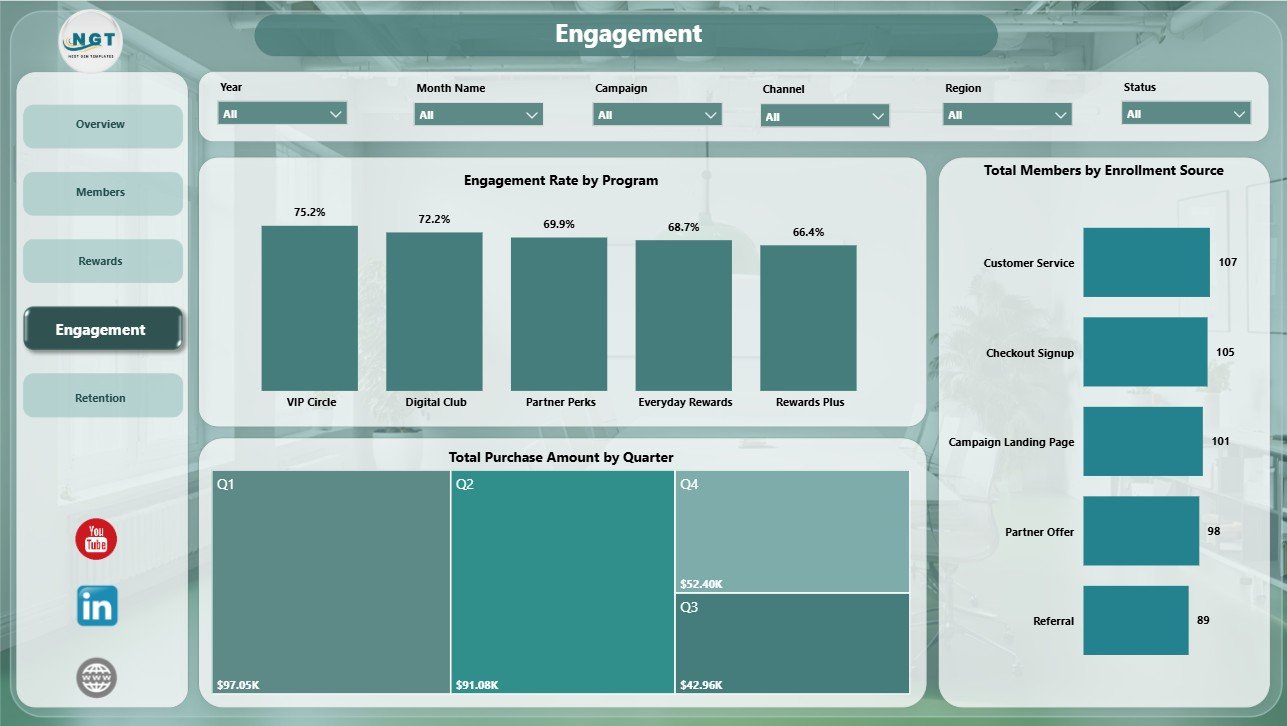
The Engagement page shows how members join, interact, and contribute purchase value over time.
Engagement Rate by Program: This chart compares engagement across loyalty programs. It helps identify programs with strong participation and programs that need better offers or communication.
Total Members by Enrollment Source: This visual shows where members are coming from. It helps teams understand whether online, in-store, referral, campaign, or partner sources are driving acquisition.
Total Purchase Amount by Quarter: This quarterly trend shows purchase value across the year. It supports planning and performance comparison across campaign cycles.
Engagement
5 – Retention
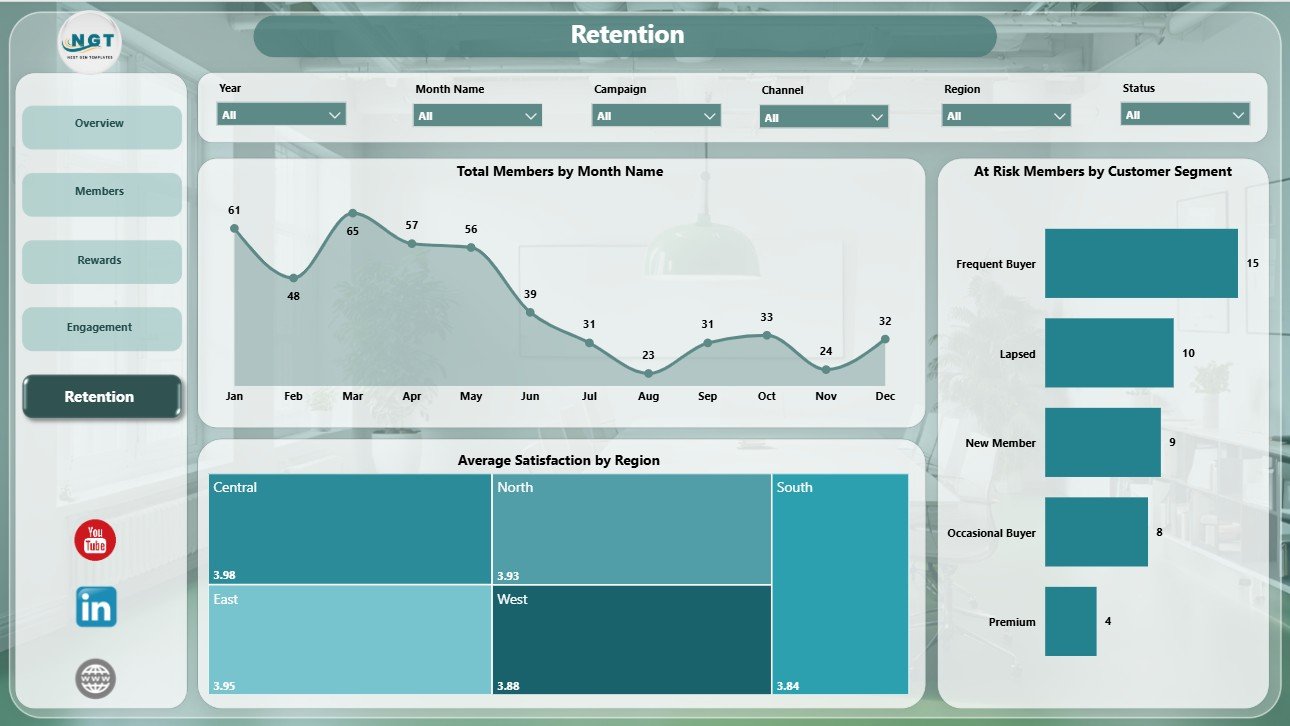
The Retention page helps teams monitor member risk, satisfaction, and member movement over time.
Total Members by Month Name: This chart tracks member count by month. It helps teams understand growth patterns and identify periods where member volume changes sharply.
At Risk Members by Customer Segment: This visual highlights at-risk members by segment. It supports targeted retention, win-back, and personalized campaign planning.
Average Satisfaction by Region: This chart compares satisfaction levels by region. It helps leaders identify markets where loyalty experience may need attention.
Retention
Loyalty Programs Management Dashboard in Power BI vs. Tableau vs. Paid CRM/SaaS – Where This Fits
| Feature | This Power BI dashboard | Tableau or Qlik alternative | Paid CRM/SaaS |
|---|---|---|---|
| Cost | $17.99 one-time | License plus build time | Monthly or annual subscription |
| Platform | Power BI Desktop / Power BI Service | Tableau, Qlik, or another BI platform | Vendor-hosted CRM or loyalty suite |
| Setup time | Open PBIX, replace or connect data, refresh | Build or adapt visuals | Implementation and onboarding |
| Real-time team collaboration | Available through Power BI Service when published | Available with cloud plans | Usually included |
| Mobile access | Available through Power BI mobile after publishing | Plan dependent | Usually included |
| Customizable fields | Editable model, visuals, slicers, and pages | Editable with BI skills | Depends on vendor permissions |
| Share with link | Available through Power BI Service | Available with cloud publishing | Login controlled |
| Year-1 cost at 5 users | $17.99 plus any Microsoft licensing | License and build cost dependent | Often hundreds or thousands |
| Loyalty analytics | Built around rewards, engagement, members, retention, and satisfaction | Must be designed or purchased | Depends on module and plan |
Who This Template Is For – and Who It’s Not For
This template is for loyalty managers, CRM analysts, retail marketers, e-commerce operators, customer success leaders, business analysts, and consultants who need a ready Power BI dashboard for loyalty reporting.
It is not a live CRM, coupon engine, rewards automation platform, customer database, POS system, or email campaign tool. Use it as a reporting layer after your loyalty data is available in a structured format.
How to Use the Loyalty Programs Management Dashboard in Power BI
- Download and unzip the template package.
- Open the PBIX file in Power BI Desktop.
- Review the sample fields, pages, cards, charts, and slicers.
- Replace the sample data or connect your own loyalty data source.
- Refresh the report and validate totals, rates, and charts.
- Use slicers to filter by loyalty program, tier, segment, channel, region, campaign, month, or quarter.
Real-World Use Cases
Anika, loyalty marketing manager: reviews reward cost, engaged members, redemption rate, and monthly purchase movement before campaign meetings.
Rahul, CRM analyst: uses the Members and Retention pages to identify at-risk customer segments and prepare win-back recommendations.
Maria, retail operations leader: compares engagement by program, enrollment source, satisfaction by region, and purchase amount by quarter before planning the next loyalty budget.
Frequently Asked Questions
What software do I need?
You need Power BI Desktop to open and edit the PBIX file. You can publish it to Power BI Service if your Microsoft account and licensing allow it.
How many pages are included?
The report includes 5 pages: Overview, Members, Rewards, Engagement, and Retention.
Can I connect my own loyalty data?
Yes. You can replace the sample data or connect the report to your own structured loyalty dataset, then refresh the visuals.
Can I customize the dashboard?
Yes. You can edit visuals, slicers, measures, fields, labels, colors, pages, and model logic in Power BI Desktop.
Does this replace a CRM?
No. This is a Power BI reporting dashboard, not a CRM, rewards engine, or campaign automation platform.
Can I use it for monthly loyalty reviews?
Yes. The Overview, Rewards, Engagement, and Retention pages are designed for monthly review meetings and campaign performance discussions.
About the Author
Built by PK – Microsoft Certified Professional with 15+ years of Excel, Google Sheets, and Power BI experience. Founder of NextGenTemplates, reaching 300K+ subscribers across YouTube channels. Every template is hand-built and tested before release.
Explore Related Templates
Explore more Power BI dashboard templates. Related options include General Store POS Web App and other customer, retail, and marketing templates on NextGenTemplates.
Download the Loyalty Programs Management Dashboard in Power BI today and start reviewing loyalty rewards, member engagement, and retention in an editable PBIX report.
Last updated: July 5, 2026





























Reviews
There are no reviews yet.