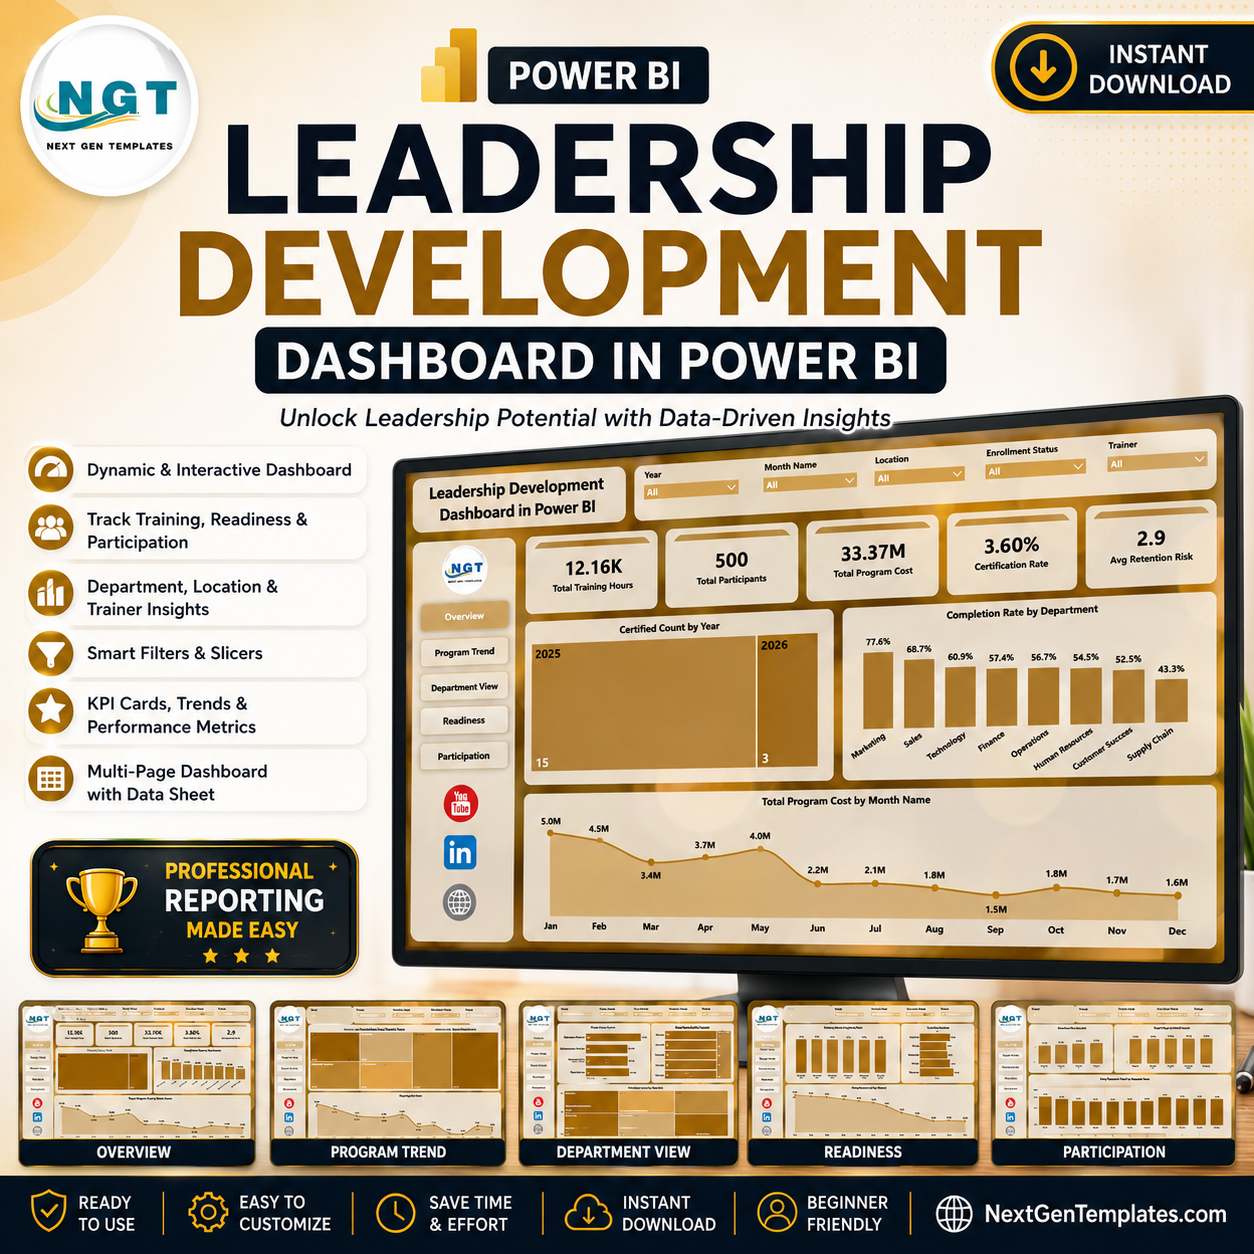
Leadership Development Dashboard in Power BI gives HR, learning, and talent teams a ready PBIX report with 5 Power BI pages, 5 executive KPI cards, 15 focused visuals, and slicers for fast filtered review. Built by PK, backed by 300K+ YouTube subscribers, this one-time download helps teams review training hours, participation, program cost, certification rate, retention risk, completion, assessment scores, trainers, departments, locations, delivery modes, and leadership levels without building a Power BI report from scratch. It is an instant download, has no subscription, and can be edited in Power BI Desktop.
Key Features of Leadership Development Dashboard in Power BI
- 5 Power BI pages: Overview Page, Program Trend, Department View, Readiness, and Participation.
- 5 high-level KPI cards: Total Training Hours, Total Participants, Total Program Cost, Certification Rate, and Avg Retention Risk.
- Interactive slicers: Filter leadership development data quickly by available program, department, time, trainer, level, location, and delivery fields.
- Certification and completion tracking: Review certified counts, completion rate, and participation patterns across years, departments, and months.
- Cost analysis: Compare total program cost by month, department, trainer, and location.
- Readiness and assessment insights: Analyze post assessment score, pre assessment score, assessment lift, and retention risk by key HR dimensions.
- Editable PBIX: Open in Power BI Desktop, inspect the model, adjust visuals, and connect your prepared data source.
What’s Inside the Leadership Development Dashboard in Power BI
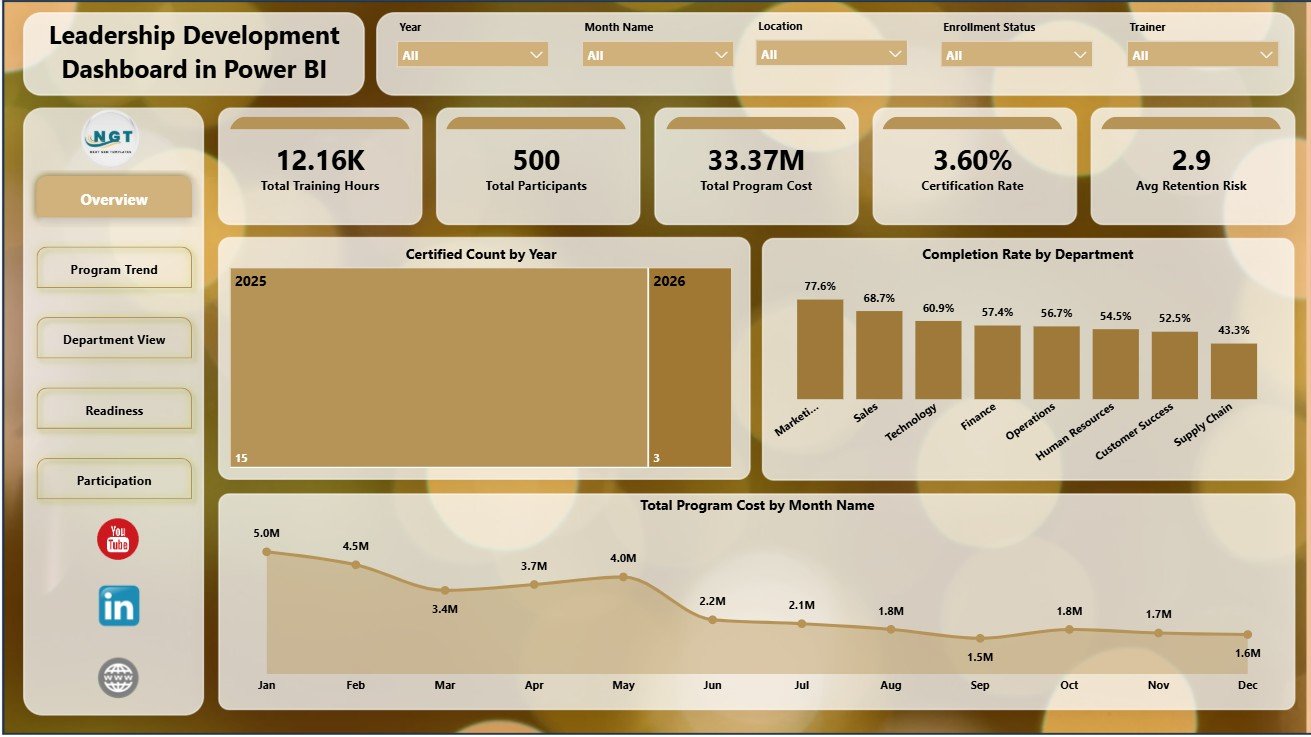
1 – Overview Page
The Overview Page gives leaders a fast summary of program scale, participation, cost, certification, and risk. The KPI cards show Total Training Hours, Total Participants, Total Program Cost, Certification Rate, and Avg Retention Risk, so HR leaders can understand the health of leadership development activity before moving into details.
Certified Count by Year: This chart shows how certification volume changes across years. It helps teams see whether leadership credential completion is increasing, flat, or declining.
Completion Rate by Department: This chart compares completion performance across departments. It highlights teams that may need better scheduling, manager follow-up, or participant support.
Total Program Cost by Month Name: This visual shows monthly investment in leadership development. It helps budget owners review whether spend is concentrated in specific months.
Overview Page
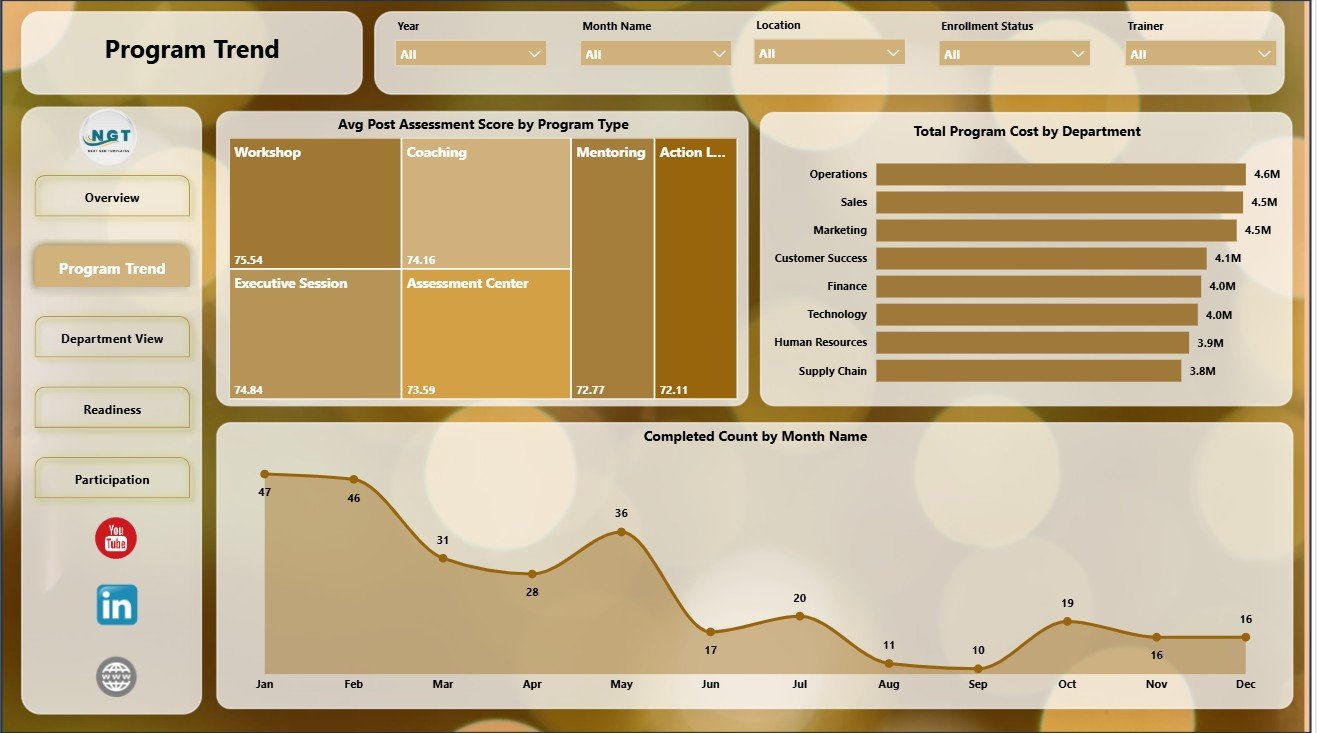
2 – Program Trend
The Program Trend page focuses on program-level movement across assessment, cost, and completion. It is useful for monthly L&D reviews where teams need to understand which development programs are improving outcomes and which need attention.
Avg Post Assessment Score by Program Type: This chart compares final assessment results across program categories. It helps identify program types where participants finish with stronger knowledge or readiness.
Total Program Cost by Department: This visual compares leadership development spend by department. It supports budget review and helps explain where the largest investment is going.
Completed Count by Month Name: This chart shows completed program volume by month. It helps teams identify seasonal completion patterns and periods where participation may need follow-up.
Program Trend
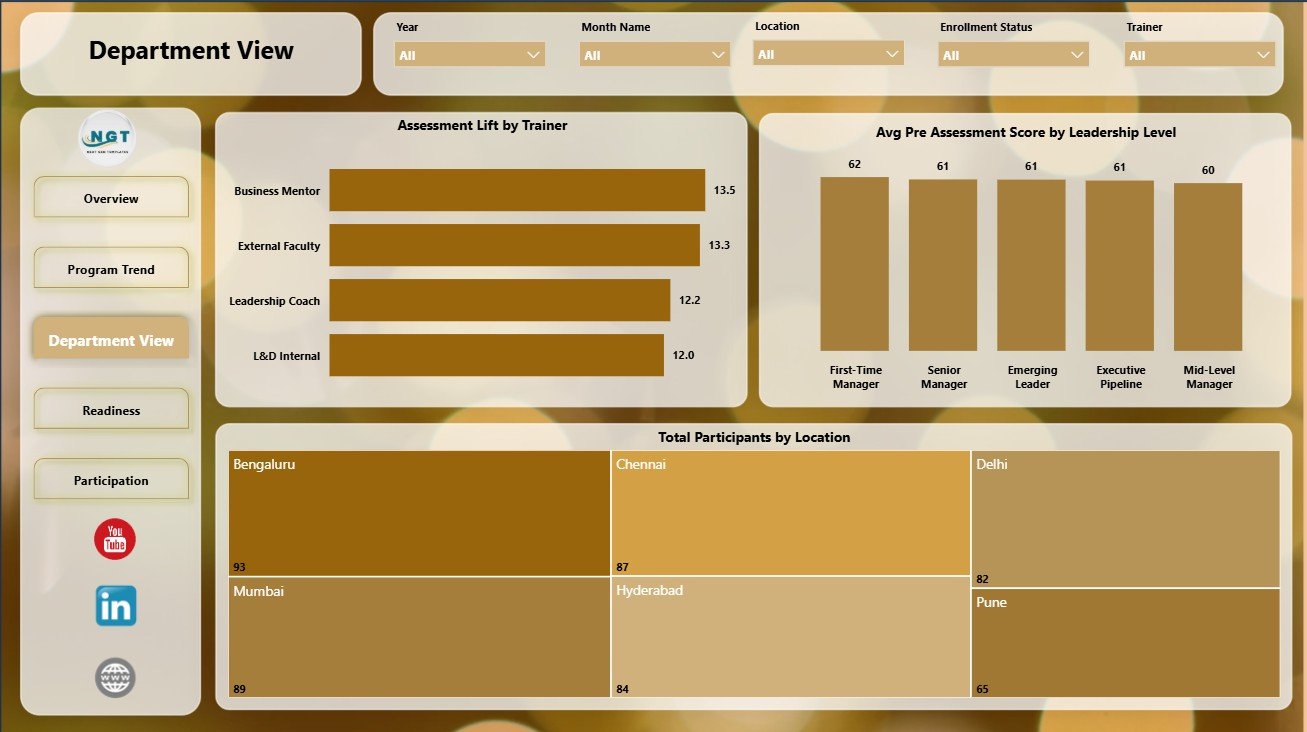
3 – Department View
The Department View page compares leadership development results by trainer, leadership level, and location. It is built for HR business partners and department heads who need team-level visibility.
Assessment Lift by Trainer: This chart compares learning improvement by trainer. It helps identify trainers whose sessions are associated with stronger pre-to-post score improvement.
Avg Pre Assessment Score by Leadership Level: This visual shows starting knowledge levels across leadership groups. It helps teams tailor program design for emerging leaders, managers, and senior leaders.
Total Participants by Location: This chart shows where leadership development participation is concentrated. It helps compare program reach across regions, branches, or training locations.
Department View
4 – Readiness
The Readiness page focuses on post-program quality, trainer cost, and retention risk. It is useful before succession planning, leadership pipeline review, and quarterly talent meetings.
Avg Post Assessment Score by Program Type: This chart compares final assessment strength across program categories. It helps leadership teams see which program designs are producing stronger outcomes.
Total Program Cost by Trainer: This visual compares program investment by trainer. It helps balance cost visibility with trainer performance and delivery mix.
Avg Retention Risk by Department: This chart compares retention risk across departments. It helps HR teams spot departments where leadership development support may need to be paired with retention actions.
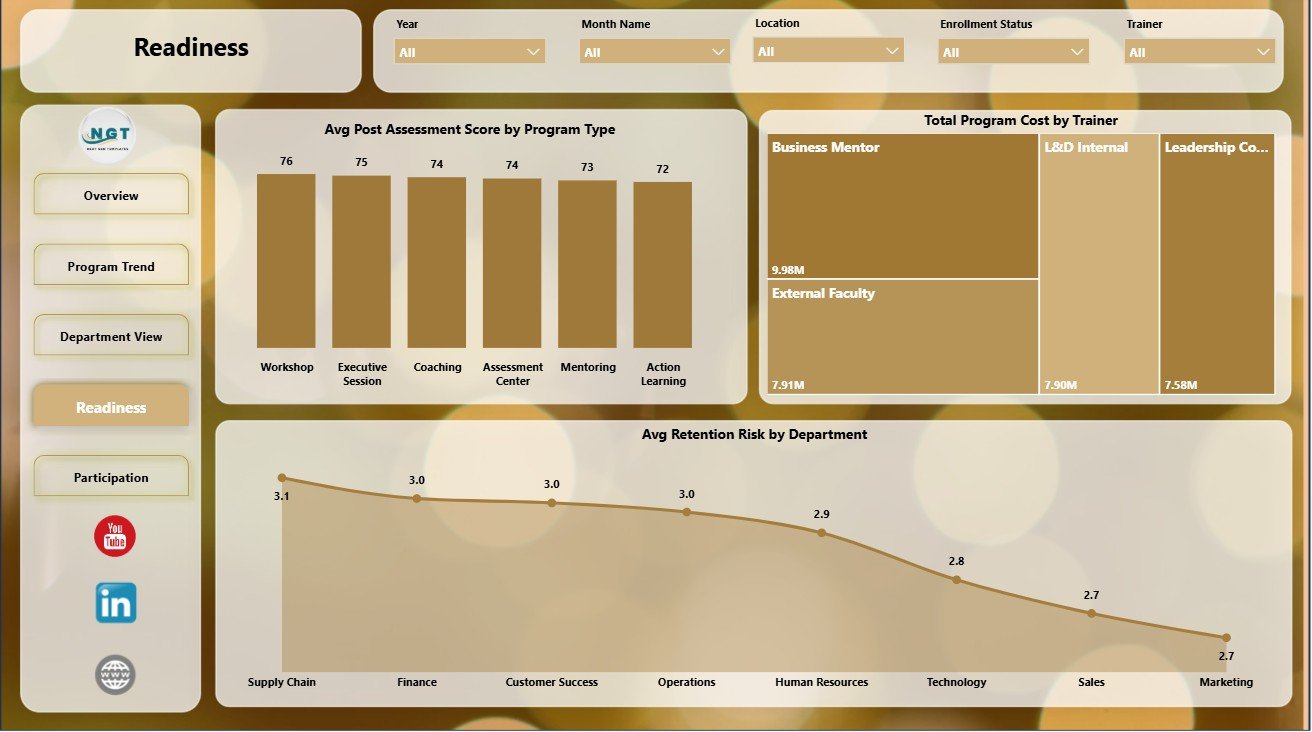
Readiness
5 – Participation
The Participation page reviews where training time, program cost, and risk are concentrated. It helps L&D teams understand how people are engaging with different delivery modes and locations.
Total Training Hours by Delivery Mode: This chart shows how training time is distributed across classroom, online, blended, or other delivery modes. It helps teams check whether the delivery mix matches program strategy.
Total Program Cost by Location: This visual compares leadership development spend by location. It helps identify regions or offices with higher investment needs.
Avg Retention Risk by Department: This chart gives a department-level risk view. It supports follow-up conversations where development investment and retention exposure need to be reviewed together.
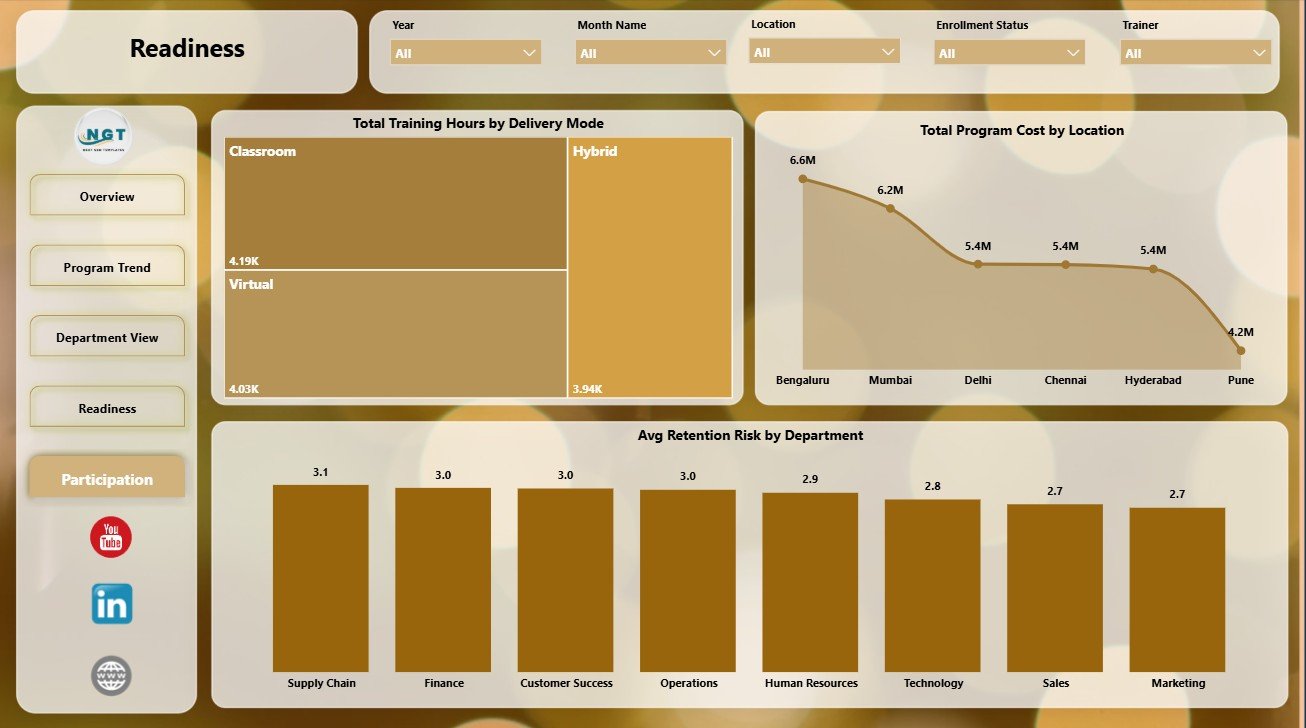
Participation
Leadership Development Dashboard in Power BI vs. Tableau vs. Paid CRM/SaaS – Where This Fits
| Feature | This Power BI dashboard | Tableau or Qlik alternative | Paid HR SaaS |
|---|---|---|---|
| Cost | $17.99 one-time | License and build cost | Monthly or annual subscription |
| Platform | Power BI Desktop | Tableau/Qlik desktop or cloud | Vendor-hosted HR platform |
| Setup time | Open PBIX and replace/connect data | Build or adapt the report | Implementation and onboarding |
| Real-time team collaboration | Possible through Power BI Service | Possible with cloud plans | Usually included |
| Mobile access | Power BI mobile after publishing | Cloud/mobile plan dependent | Usually included |
| Customizable fields | Editable model and visuals | Editable with BI skills | Limited by vendor settings |
| Share with link | Available after publishing to Power BI Service | Plan dependent | Login controlled |
| Year-1 cost at 5 users | $17.99 plus any Microsoft licensing | License-dependent | Often hundreds or thousands |
| Leadership analytics pages | 5 ready-made report pages | Must be built or purchased | Depends on selected module |
Who This Template Is For – and Who It’s Not For
This template is for HR managers, learning and development teams, talent management leaders, HR analysts, leadership coaches, department heads, and consultants who need a Power BI reporting layer for leadership training, certification, readiness, completion, program cost, assessment scores, and retention risk. It is not a full LMS, HRIS, performance review workflow, survey platform, or automated certification system.
How to Use the Leadership Development Dashboard in Power BI
- Download and unzip the product file.
- Open the PBIX file in Power BI Desktop.
- Review the sample data and existing report pages.
- Replace the sample data or connect your prepared leadership development dataset.
- Refresh the report and verify cards, charts, and slicers.
- Customize pages, visuals, fields, and colors as needed.
Real-World Use Cases
Anita, HR development manager: Anita uses the Overview and Program Trend pages before quarterly talent meetings to compare training hours, program cost, certification rate, and completion.
Rahul, leadership coach: Rahul reviews assessment lift by trainer and assessment scores by program type to understand which interventions are producing better learning outcomes.
Melissa, L&D consultant: Melissa adapts the PBIX file for clients and uses the Readiness and Department View pages to prepare leadership pipeline summaries.
Frequently Asked Questions
What software do I need?
You need Power BI Desktop to open, edit, refresh, and customize the PBIX file.
How many report pages are included?
The dashboard includes 5 Power BI pages: Overview Page, Program Trend, Department View, Readiness, and Participation.
Can I connect my own data?
Yes. You can replace the sample data or modify the data source connection in Power BI Desktop.
Can I customize the visuals?
Yes. You can edit visuals, measures, fields, slicers, colors, page titles, and report layout.
Is this a full HR software system?
No. It is a reporting dashboard template, not a full LMS, HRIS, certification workflow, survey system, or employee self-service portal.
Can I publish it online?
Yes. If your organization uses Power BI Service, you can publish and share according to your Microsoft licensing and security settings.
About the Author
Built by PK – Microsoft Certified Professional with 15+ years of Excel, Google Sheets, and Power BI experience. Founder of NextGenTemplates, reaching 300K+ subscribers across YouTube channels. Every template is hand-built and tested before release.
Explore Related Templates
Explore more Power BI dashboard templates and related HR and payroll templates. You may also like the Leadership Development Dashboard in Excel, HR Analytics Dashboard in Power BI, and Leadership Development KPI Dashboard in Excel.
Ready to review leadership development performance in Power BI? Download the Leadership Development Dashboard in Power BI, connect your data, refresh the report, and start reporting today.
Last updated: July 2, 2026


Reviews
There are no reviews yet.