

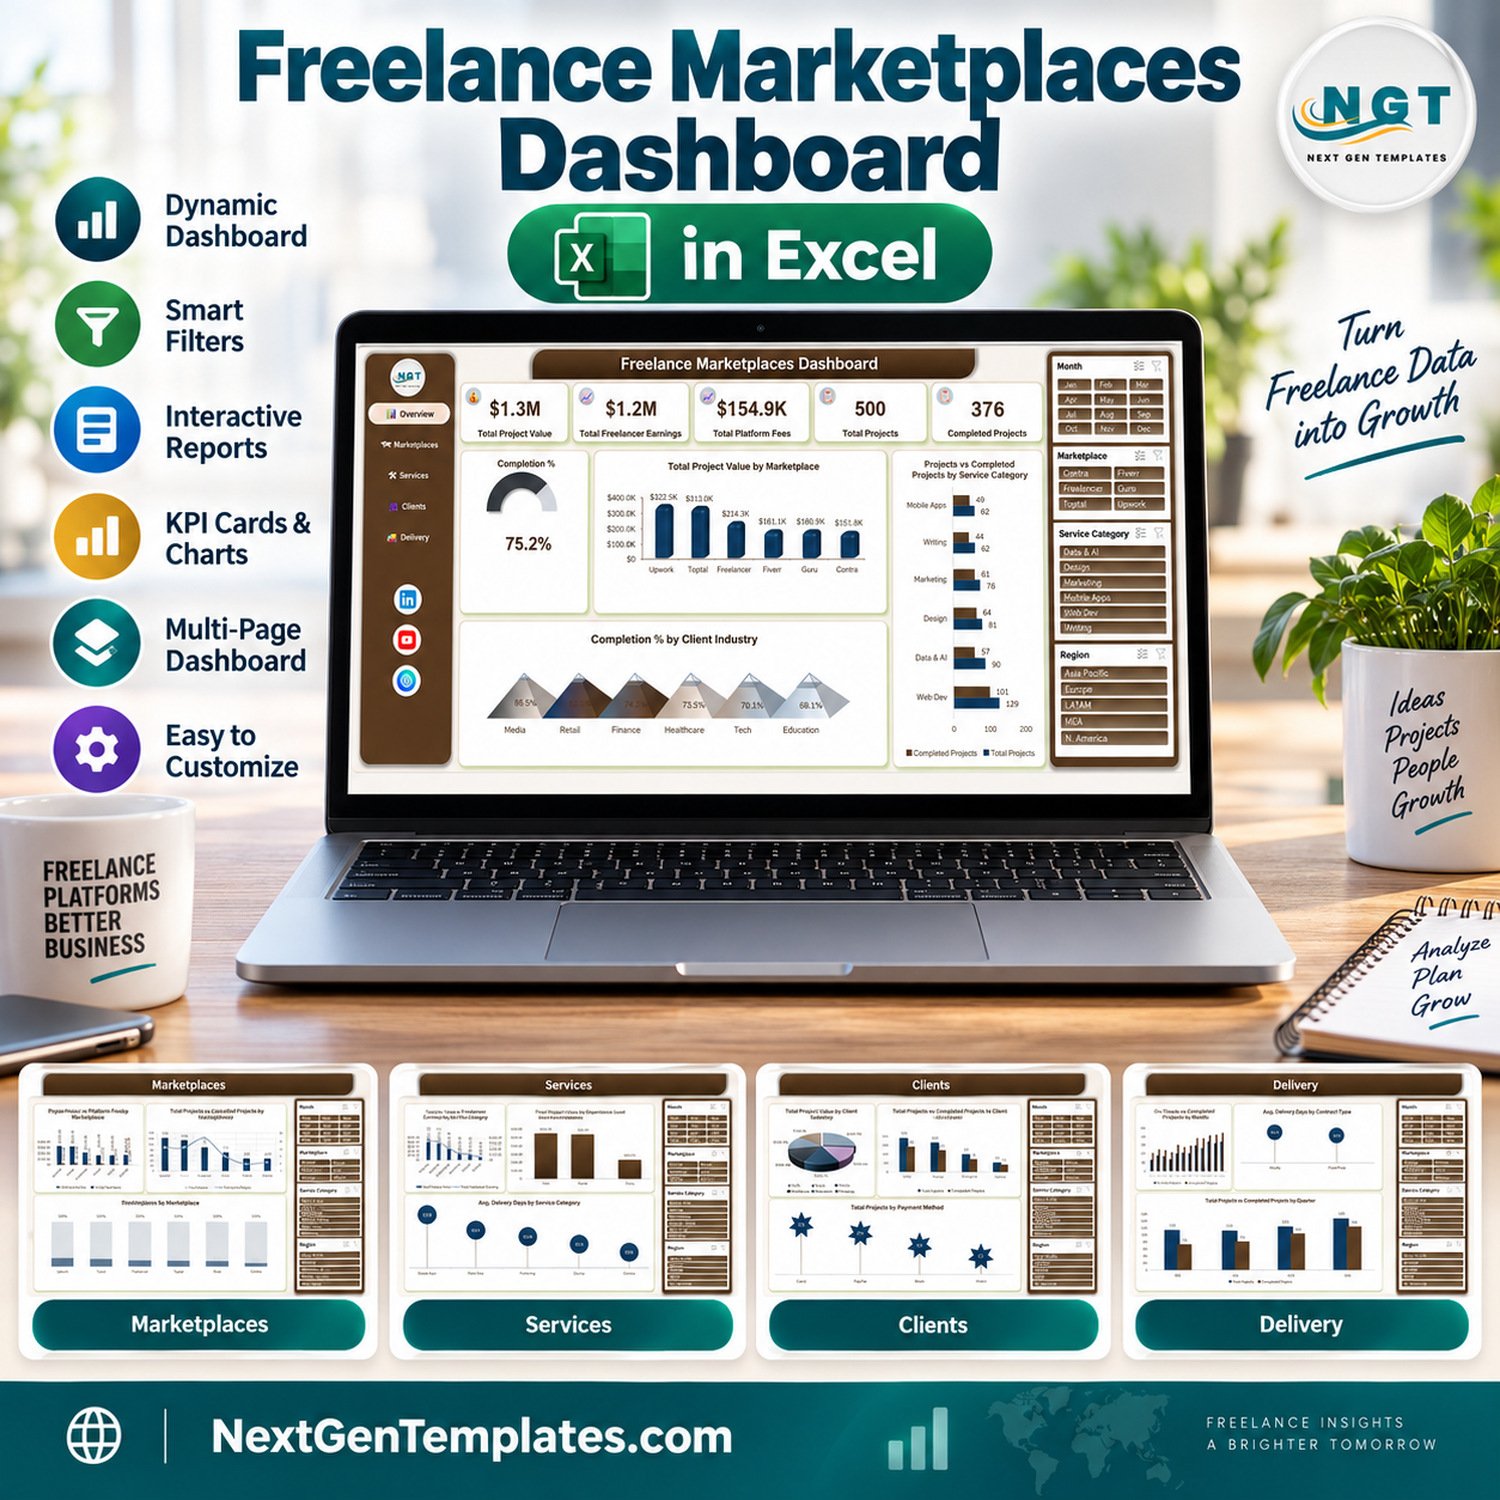
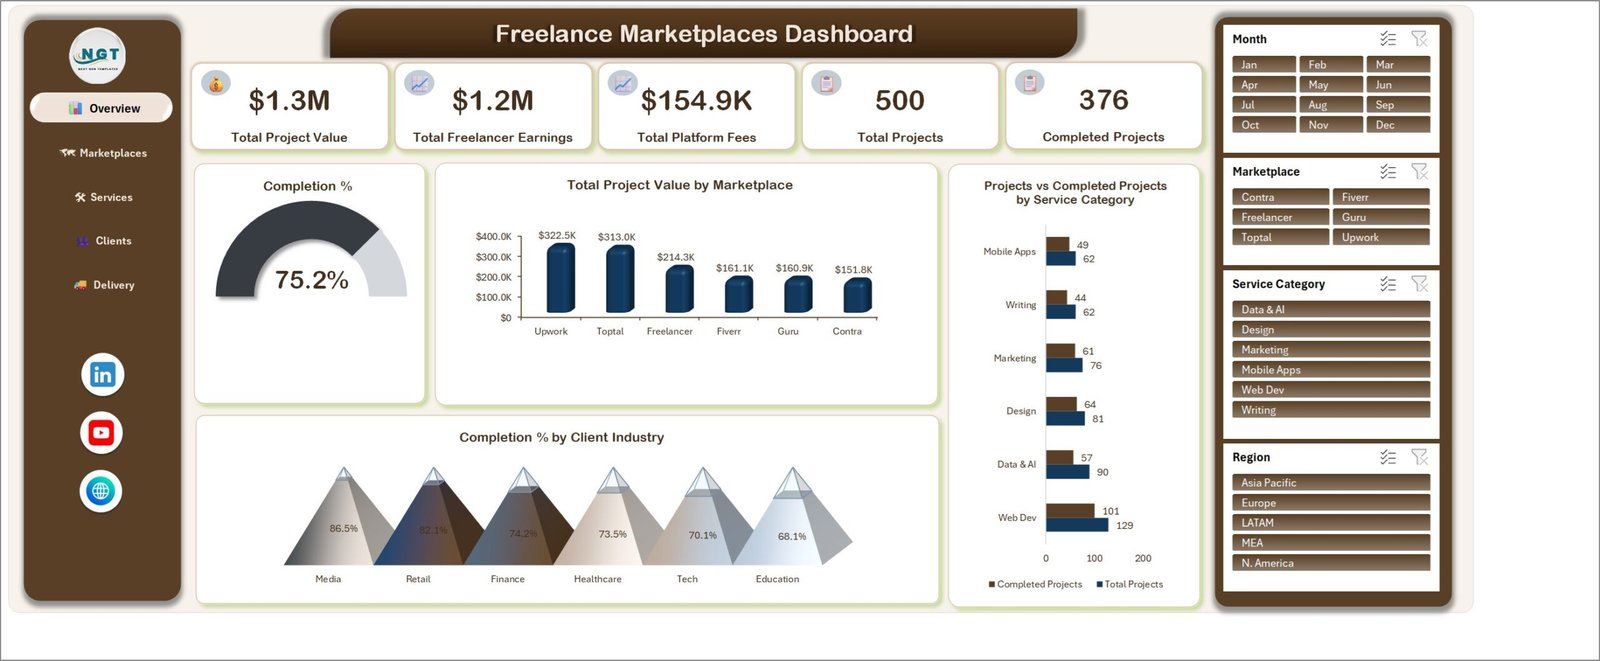
Five hundred projects across six freelance platforms, and the fee you actually pay swings from 5% on Contra to 20% on Fiverr. The Freelance Marketplaces Dashboard in Excel puts that spread on one screen: $1.3M in total project value, $1.2M kept by freelancers, $154.9K lost to platform fees, and a 75.2% completion rate you can slice by month, marketplace, service category and region. It ships as a five-page workbook with 500 sample project records already loaded, so you can see every chart working before you paste in a single row of your own. Built and tested by a Microsoft Certified Professional, delivered as a standard .xlsx with a 1-year free-update promise and a user manual in the box.
Key Features of the Freelance Marketplaces Dashboard in Excel
- Five linked report pages – Overview, Marketplaces, Services, Clients and Delivery, reached from a sidebar menu that stays in the same place on every sheet.
- Four slicers on every page – Month, Marketplace, Service Category and Region. Click Fiverr and all five pages redraw for Fiverr only.
- Six marketplaces compared side by side – Upwork, Fiverr, Freelancer, Toptal, Guru and Contra, each with its own project value, fee percentage, cancellation count and completion rate.
- Platform fee analysis – a dedicated chart showing the fee percentage each marketplace charges, from Contra at 5.0% to Fiverr at 20.0%, next to the dollar value those percentages remove.
- Five KPI cards – Total Project Value, Total Freelancer Earnings, Total Platform Fees, Total Projects and Completed Projects, all recalculating with the slicers.
- Delivery tracking by month and quarter – on-time versus completed projects across Jan-Dec and Q1-Q4, plus average delivery days split by contract type.
- Six service categories and three experience levels – Web Dev, Data & AI, Mobile Apps, Marketing, Design and Writing, cross-cut by Entry, Mid and Expert.
- 500 sample records included – realistic project data so every chart renders on first open; clear it and paste your own export when you are ready.
What’s Inside the Freelance Marketplaces Dashboard in Excel
The download is a single ZIP containing the .xlsx workbook and a PDF user manual. No add-ins, no macros, no sign-in.
Page 1 – Overview. Five KPI cards across the top: $1.3M Total Project Value, $1.2M Total Freelancer Earnings, $154.9K Total Platform Fees, 500 Total Projects and 376 Completed Projects. Below them a Completion % gauge reading 75.2%, a Total Project Value by Marketplace column chart (Upwork $322.5K, Toptal $313.0K, Freelancer $214.3K, Fiverr $161.1K, Guru $160.9K, Contra $151.8K), a Projects vs Completed Projects by Service Category bar chart, and a Completion % by Client Industry chart running from Media at 86.5% down to Education at 68.1%.
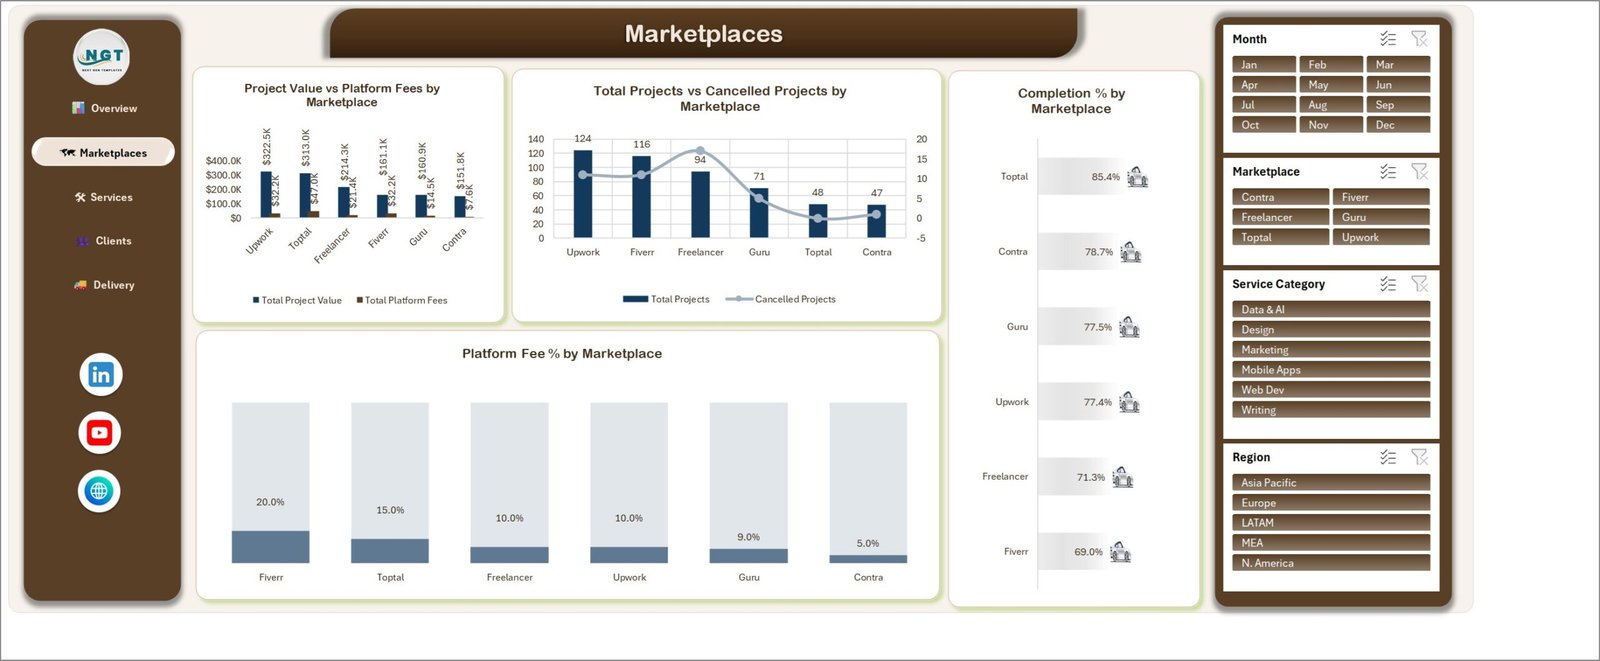
Page 2 – Marketplaces. Project Value vs Platform Fees by Marketplace as a paired column chart, Total Projects vs Cancelled Projects by Marketplace as a column-and-line combo (Upwork 124 projects, Fiverr 116, Freelancer 94, Guru 71, Toptal 48, Contra 47), Completion % by Marketplace ranked from Toptal at 85.4% to Fiverr at 69.0%, and Platform Fee % by Marketplace.
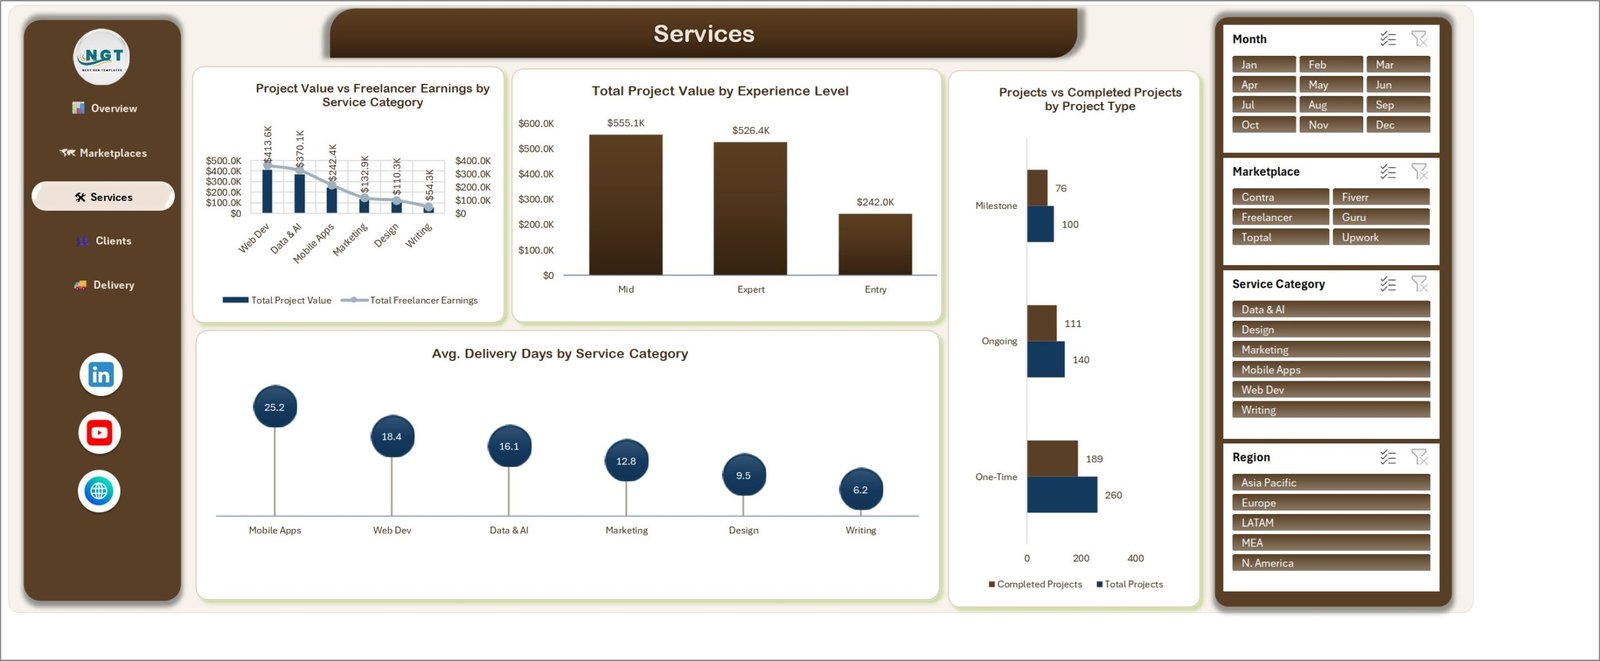
Page 3 – Services. Project Value vs Freelancer Earnings by Service Category (Web Dev leads at $413.6K, Writing trails at $54.3K), Total Project Value by Experience Level (Mid $555.1K, Expert $526.4K, Entry $242.0K), Projects vs Completed Projects by Project Type across Milestone, Ongoing and One-Time contracts, and Avg. Delivery Days by Service Category running from Mobile Apps at 25.2 days to Writing at 6.2 days.
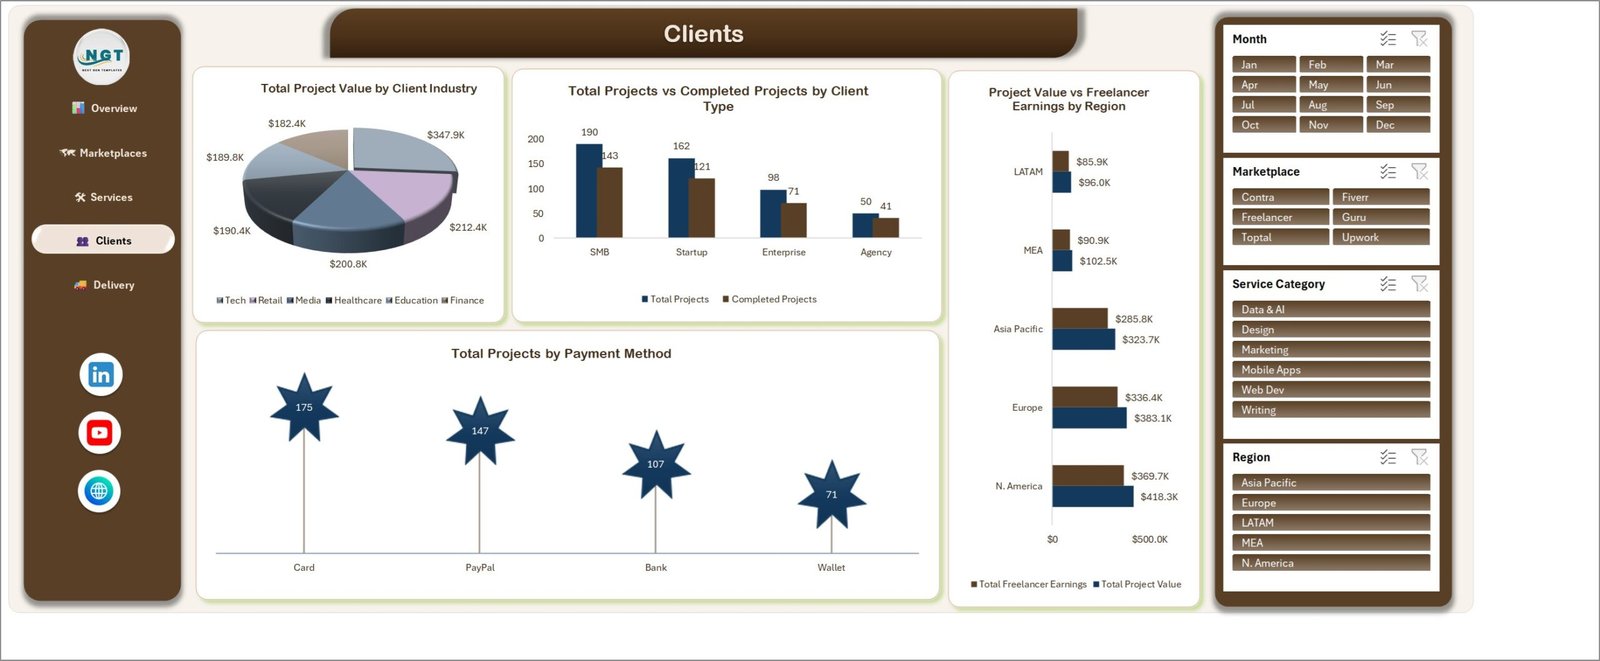
Page 4 – Clients. Total Project Value by Client Industry as a pie chart, Total Projects vs Completed Projects by Client Type (SMB 190, Startup 162, Enterprise 98, Agency 50), Project Value vs Freelancer Earnings by Region across N. America, Europe, Asia Pacific, MEA and LATAM, and Total Projects by Payment Method (Card 175, PayPal 147, Bank 107, Wallet 71).
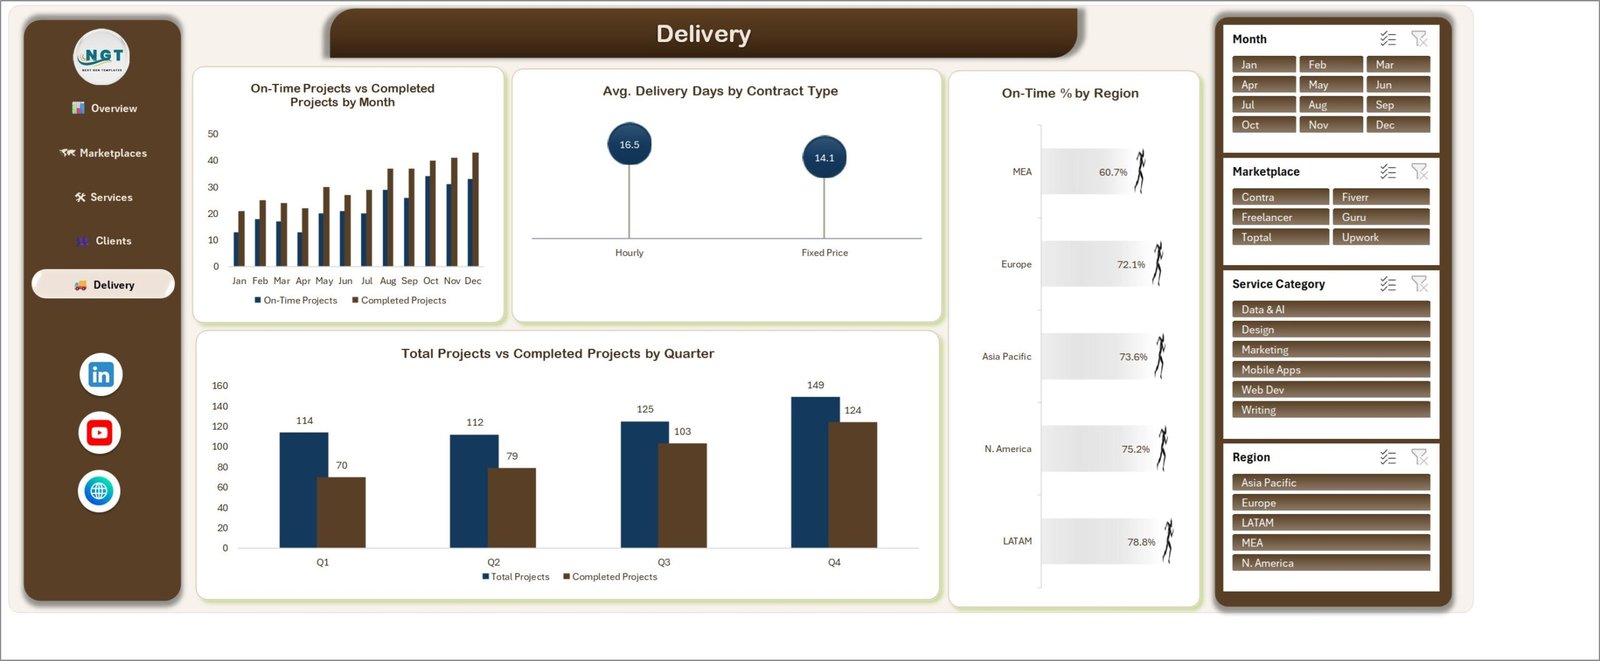
Page 5 – Delivery. On-Time Projects vs Completed Projects by Month for all twelve months, Avg. Delivery Days by Contract Type (Hourly 16.5, Fixed Price 14.1), On-Time % by Region from LATAM at 78.8% to MEA at 60.7%, and Total Projects vs Completed Projects by Quarter showing Q4 at 149 projects against Q1 at 114.
Freelance Marketplaces Dashboard vs. Google Sheets vs. Paid Freelance SaaS – Where This Fits
| This Excel dashboard | Google Sheets build | Bonsai / Hubstaff Tasks | |
|---|---|---|---|
| Cost | One payment, under $30 | Free, but you build it | $21-$39 per user / month |
| Platform | Excel 2016+ / Microsoft 365, Windows or Mac | Browser | Browser and mobile app |
| Setup time | Open it, paste your export, refresh | Several days of chart work | Hours, plus data migration |
| Real-time team collaboration | Via OneDrive or SharePoint co-authoring | Yes, built in | Yes, built in |
| Mobile access | Excel mobile app, read-only in practice | Yes | Yes |
| Customizable fields | Full – it is your workbook | Full | Limited to their schema |
| Share with link | Yes, through OneDrive | Yes | Yes |
| Year-1 cost at 5 users | Under $30 total | $0 plus your build time | $1,260-$2,340 |
| Multi-marketplace fee comparison | Built in for six platforms | Build it yourself | Usually single-workspace |
| Works offline | Yes | No | No |
If you already live inside one marketplace’s own analytics tab, you do not need this. The case for it is that Upwork cannot show you what Fiverr is costing you, and no marketplace will ever put its fee percentage next to a competitor’s.
Who This Template Is For – and Who It’s Not For
It fits freelancers billing across two or more platforms who want one fee-and-margin view; small agencies routing work through marketplace accounts and tracking delivery against client type; and operations leads who need a monthly project-value and on-time-delivery report without buying a SaaS seat for every person who reads it.
It does not fit if you need live API sync – this workbook does not connect to Upwork, Fiverr or any other platform, and you paste or import your own export. It is not an invoicing or contract tool, it does not process payments, and it does not track time. If you want target-versus-actual traffic lights rather than trend analysis, a KPI scorecard is the better shape. And if your whole business runs on one platform, a simpler single-marketplace tracker will serve you better.
How to Use the Freelance Marketplaces Dashboard in Excel
- Download the ZIP, extract it, and open the .xlsx in Excel 2016 or later. Nothing to install.
- Click through all five pages with the sample data still in place so you can see what each chart is meant to show.
- Open the data sheet and replace the 500 sample rows with your own project export – keep the column headers exactly as they are.
- Refresh (Data > Refresh All, or Ctrl+Alt+F5). Every KPI card and chart repoints at your rows.
- Use the four slicers to filter. Microsoft’s slicer documentation covers multi-select and clearing filters if you have not used them before.
- Read the included PDF manual for the column definitions and how the fee and completion formulas are calculated.
Real-World Use Cases
Sana, a full-stack developer on three platforms. She bills through Upwork, Toptal and Contra. Pasting a year of projects in, she sees Toptal returning $313.0K at a 15.0% fee while Contra returns $151.8K at 5.0%. The Services page tells her Web Dev carries an 18.4-day average delivery, so she stops quoting two-week turnarounds on Toptal milestone work and reprices instead.
Imran, who runs a six-person design and writing studio. He routes everything through marketplace accounts. The Clients page shows SMB clients bringing 190 projects with 143 completed, while Agency clients bring 50 and complete 41 – a far better ratio. The Delivery page shows Q4 running 149 projects against Q1’s 114, so he plans contractor capacity around the fourth quarter instead of hiring flat across the year.
Rhea, operations lead at a marketing agency. She reports monthly to a partner who will not open a SaaS dashboard. She filters to one region, exports the Delivery page to PDF, and sends it. On-Time % by Region shows MEA at 60.7% against LATAM’s 78.8%, which becomes the agenda item for the next delivery review.
Frequently Asked Questions
Does the Freelance Marketplaces Dashboard connect to Upwork or Fiverr automatically?
No. There is no API connection. You export your projects from each platform and paste them into the data sheet, then refresh. That is deliberate – it means the workbook keeps working regardless of platform API changes, and your data never leaves your machine.
Which versions of Excel does it work in?
Excel 2016 or later and Microsoft 365, on Windows or Mac. It is a standard .xlsx with no macros, so it opens in a protected view without any security prompt about enabling content.
Can I add a marketplace that is not one of the six?
Yes. Add your rows with the new marketplace name in the marketplace column and refresh – the charts and the Marketplace slicer pick it up. The six on screen are what the sample data uses, not a hard limit.
What happens to the 500 sample rows?
Delete them once you have looked around. They exist so the dashboard renders fully on first open rather than showing empty charts. Keep a copy of the untouched file if you want a reference.
Does it handle currencies other than USD?
The sample data is in USD and the cards are formatted for it. Change the number format on the data sheet and the KPI cards to your currency; the formulas are currency-agnostic. It does not convert between currencies, so convert before pasting if you bill in several.
Is there a Google Sheets version?
Not of this exact dashboard. The closest Google Sheets products are the Freelance Marketplace Gig Tracker and the Freelance Developer Dashboard, both of which cover similar ground with a different page structure.
Do I get updates?
Yes – one year of free updates. If a chart is corrected or a page is added, you get the new file at no cost.
About the Author
Built by PK – Microsoft Certified Professional with 15+ years of Excel, Google Sheets, and Power BI experience. Founder of NextGenTemplates, reaching 300K+ subscribers across YouTube channels. Every template is hand-built and tested before release.
Explore Related Templates
- Freelance Marketplace Gig Tracker in Google Sheets – row-level gig tracking if you want the log rather than the analysis.
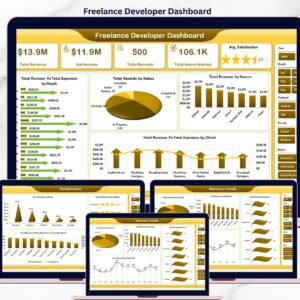
- Freelance Developer Dashboard in Google Sheets – the single-freelancer view, in Sheets.
- Amazon FBA Seller Dashboard in Excel – the same fee-versus-revenue question for marketplace sellers.
- Etsy Seller Analytics Dashboard in Excel – platform analytics for handmade and print-on-demand sellers.
- Browse every Excel dashboard template in the catalogue.
Full walkthrough of all five pages, with the charts explained one by one, is on the blog: Freelance Marketplaces Dashboard in Excel.
Download the Freelance Marketplaces Dashboard in Excel and stop guessing which platform actually pays. Instant download, 500 sample records included, 1 year of free updates.
Last updated: September 2026






















Reviews
There are no reviews yet.