

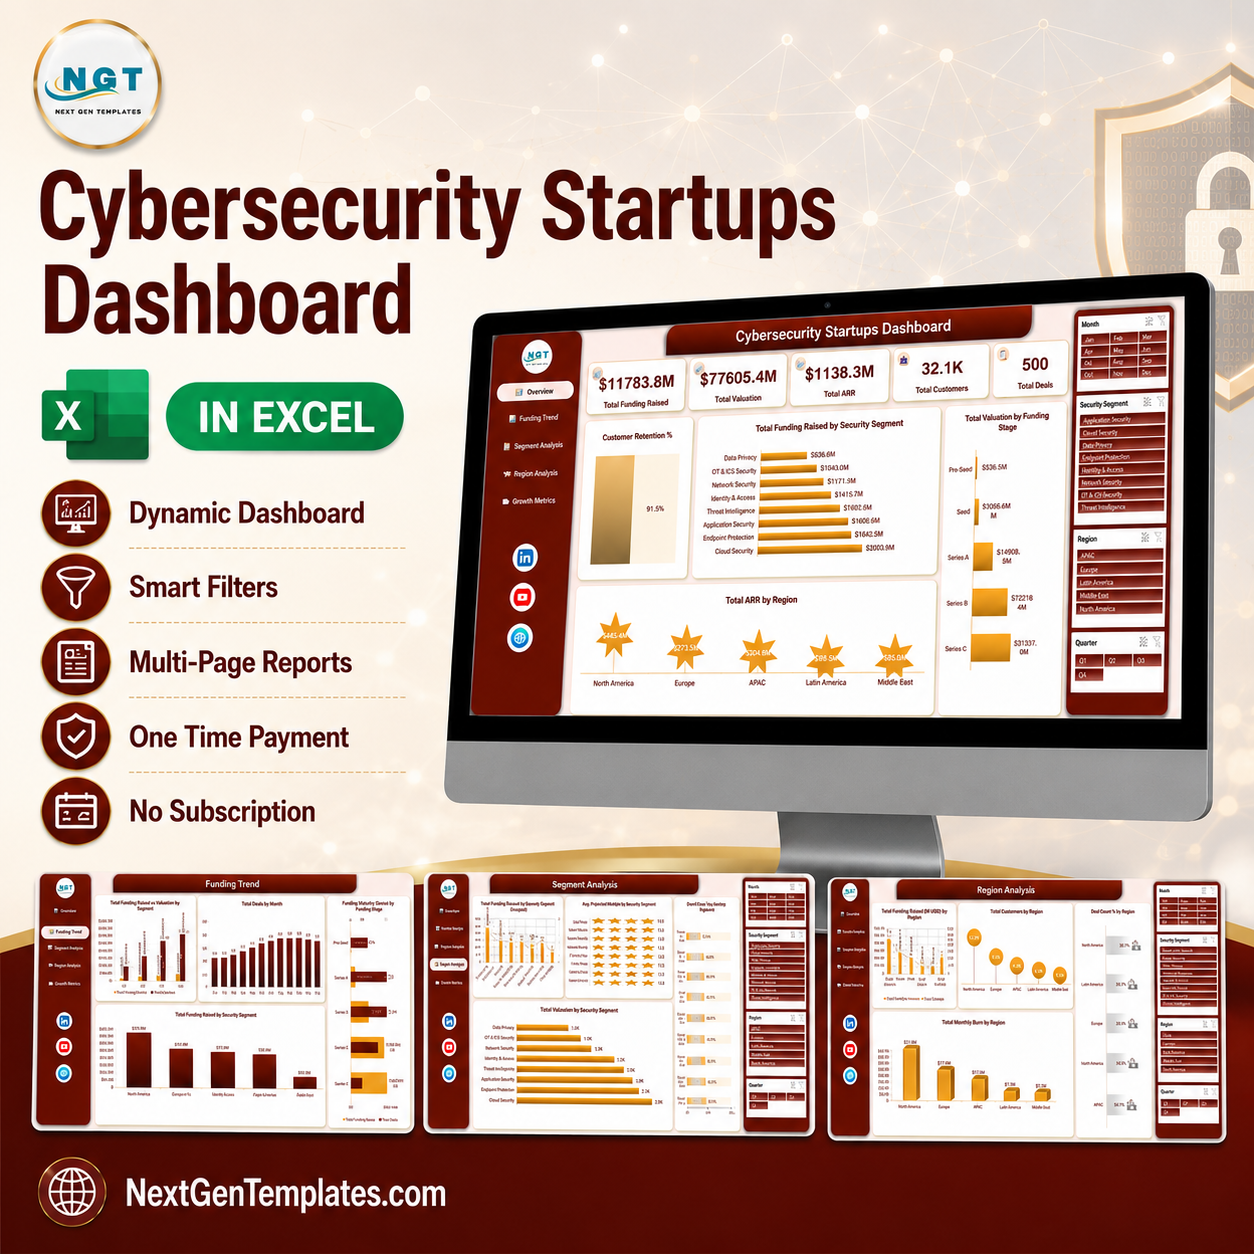


Cybersecurity Startups Dashboard in Excel gives venture investors, startup founders, corporate development teams, accelerator managers, and cyber-sector analysts a ready-to-use Excel reporting workbook for funding raised, valuation, ARR, customer count, churn, headcount, monthly burn, deal status, and product rating across the cybersecurity startup market. For $17.99 one-time, you get a 7-sheet Excel dashboard with five executive KPI cards, five analytical pages, four interactive slicers, a structured 500-row Data sheet, and a Support sheet powered by pivot tables. Instant download. No subscription. No per-user fee. Lifetime access.
Key Features of Cybersecurity Startups Dashboard in Excel
- 5 executive KPI cards for Total Funding Raised, Total Valuation, Total ARR, Total Customers, and Total Deals.
- 5 analytical dashboard pages covering Overview, Funding Trend, Segment Analysis, Region Analysis, and Growth Metrics.
- 20 chart views across security segment, funding stage, investor type, region, month, quarter, deal status, and funding band.
- 4 interactive slicers for Month, Security Segment, Region, and Quarter, so every page can be filtered without rebuilding a single chart.
- Structured Data sheet holding 500 sample deal records in 26 columns, ready to be replaced with your own pipeline.
- Support sheet with pivot tables that drives every chart and can be hidden once the workbook is set up.
- Excel-native workflow – update the Data sheet, click Refresh All, and the whole dashboard moves with it. No SaaS subscription, no implementation project, no per-seat reporting fee.
What’s Inside the Cybersecurity Startups Dashboard in Excel
1. Overview Page
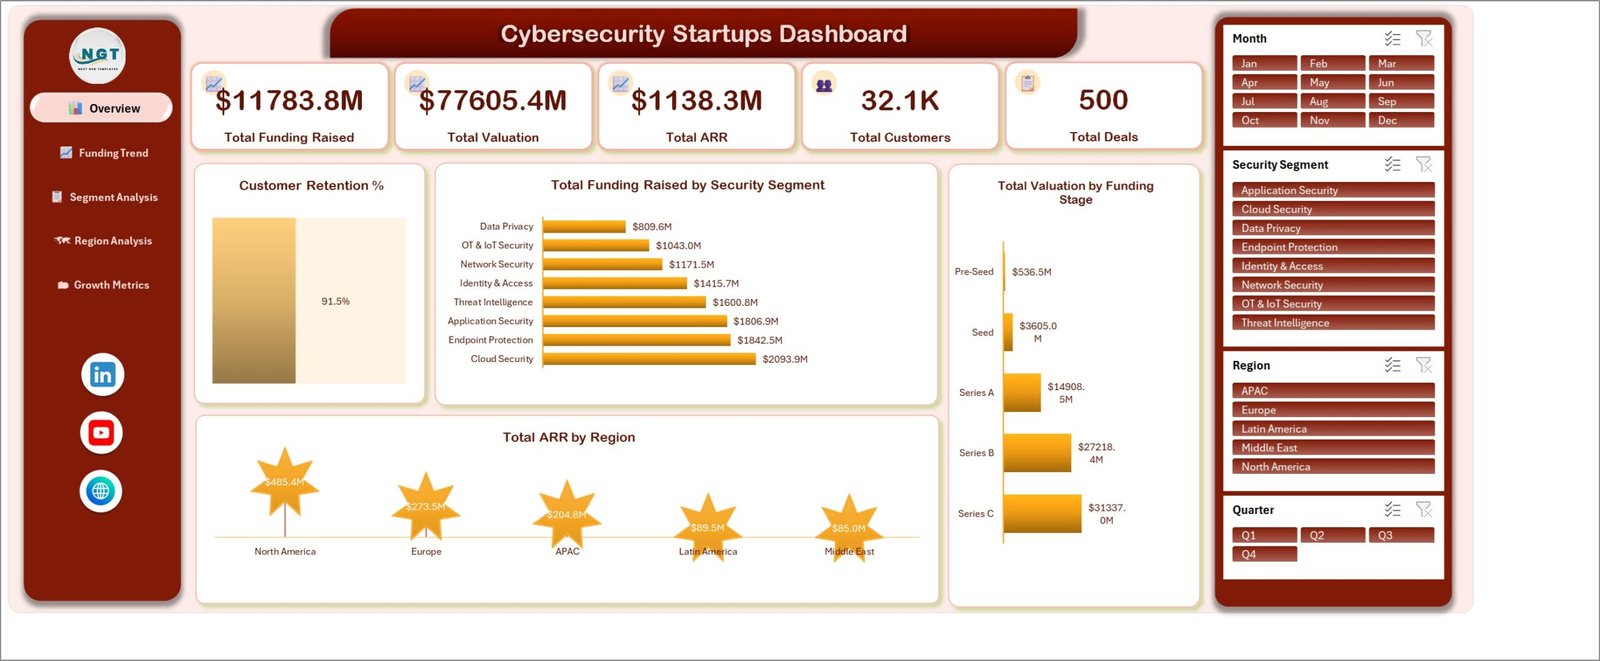
The Overview page is the leadership summary. Five cards across the top report Total Funding Raised, Total Valuation, Total ARR, Total Customers, and Total Deals, so a partner or founder can size the whole cybersecurity funding picture in one glance before drilling into any single segment.
Customer Retention %: A single large retention card that sits beside the KPI row and answers the first question any investor asks about a security vendor – are the customers staying? It moves with every slicer, so retention can be read for one segment, one region, or one quarter.
Total Funding Raised by Security Segment: A ranked bar chart across the eight segments – Cloud Security, Endpoint Protection, Application Security, Threat Intelligence, Identity & Access, Network Security, OT & IoT Security, and Data Privacy. It shows immediately where capital is concentrating and which sub-sectors are still under-funded.
Total Valuation by Funding Stage: A stage-by-stage view running Pre-Seed, Seed, Series A, Series B, and Series C. It makes the valuation step-up between rounds visible, which is exactly what a fund needs when it is setting entry price expectations.
Total ARR by Region: Recurring revenue split across North America, Europe, APAC, Latin America, and Middle East. Funding follows headlines, but ARR follows customers – reading the two side by side shows where the market is genuinely commercial.
2. Funding Trend
The Funding Trend page is the deal-flow view. It answers when money moved, how much of it, and through which kind of investor.
Total Funding Raised vs Valuation by Quarter: A combination column chart placing capital raised next to the valuation it bought, quarter by quarter. When the valuation bar grows much faster than the funding bar, pricing is running ahead of capital – a signal worth catching early.
Total Deals by Month: A monthly deal-count column chart that shows whether the pipeline is accelerating or thinning. It is the simplest capacity-planning chart in the workbook for anyone running a fund or an accelerator cohort.
Funding Raised vs Deals by Funding Stage: A paired bar chart that reads capital against deal count for each stage. A stage with many deals and little capital behaves very differently from one with few, large cheques, and this chart separates the two.
Total Funding Raised by Investor Type: Capital broken out by Venture Capital, Corporate VC, Growth Equity, Angel Syndicate, and Accelerator. It shows which class of investor is actually writing the cheques in cyber, which matters when a founder is building a target list.
3. Segment Analysis
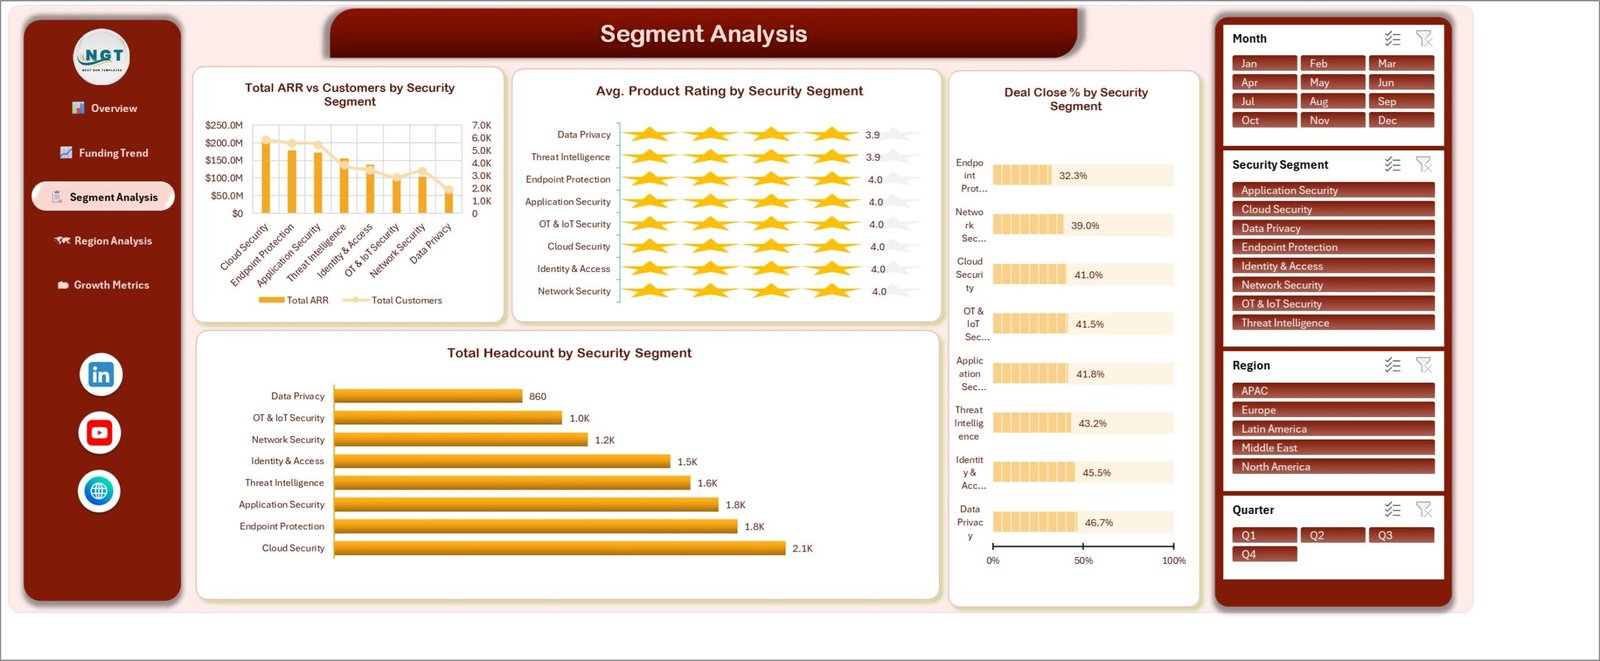
The Segment Analysis page moves from money to fundamentals, comparing the eight security segments on revenue, customers, product quality, conversion, and team size.
Total ARR vs Customers by Security Segment: A combination column-and-line chart that puts recurring revenue against customer count. A segment with high ARR and few customers is enterprise-priced; high customers and low ARR is a volume play. The shape of the gap tells you which.
Avg. Product Rating by Security Segment: A star-rating chart scoring each segment on average product rating. It gives a quality read that pure financial charts cannot, and it is useful for spotting a well-funded segment with weak product satisfaction.
Deal Close % by Security Segment: A progress-bar chart showing what share of deals in each segment actually closed. Conversion, not pipeline volume, is what separates a real market from a crowded one.
Total Headcount by Security Segment: A ranked bar chart of people employed per segment. Read alongside ARR, it becomes a rough revenue-per-employee comparison across the sector.
4. Region Analysis
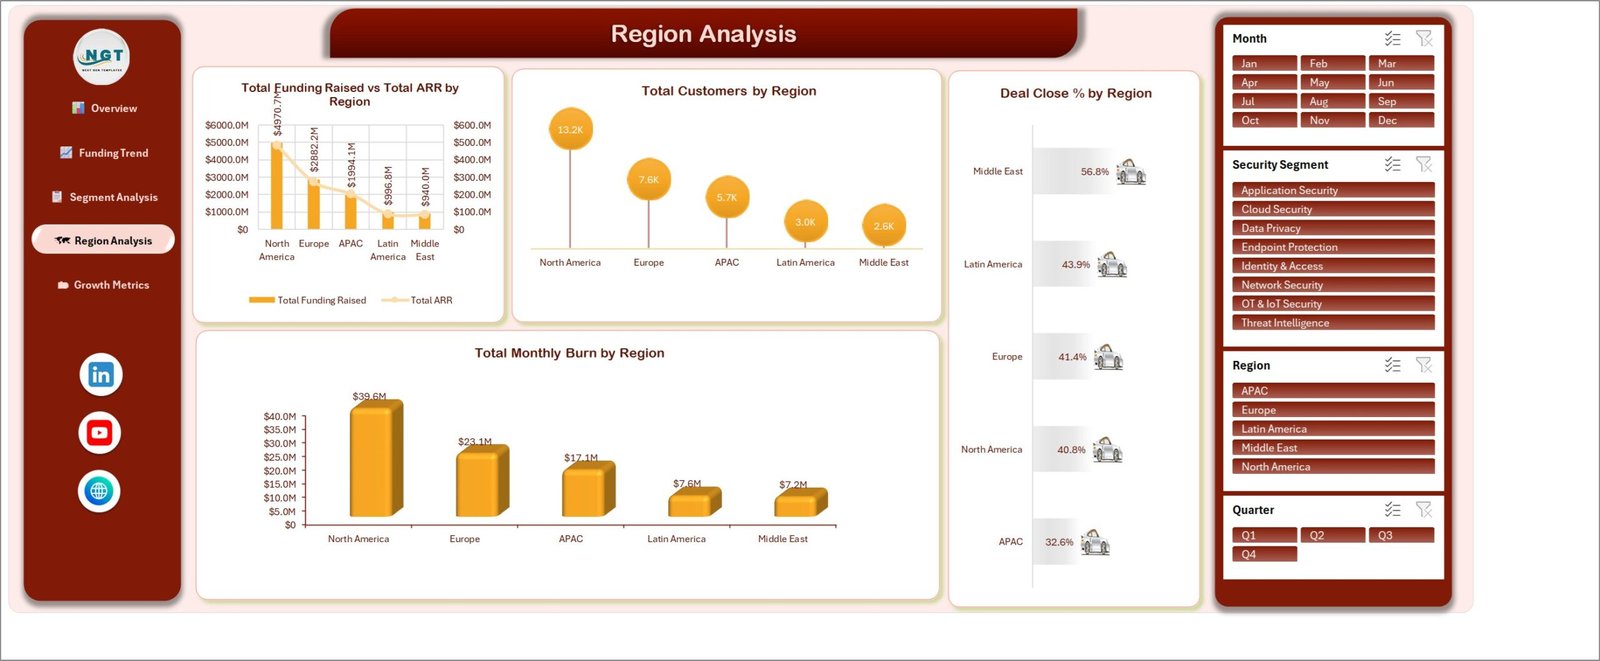
The Region Analysis page compares North America, Europe, APAC, Latin America, and Middle East on capital, customers, conversion, and cash consumption.
Total Funding Raised vs Total ARR by Region: A dual-axis chart placing capital raised against recurring revenue earned in each region. Regions where funding towers over ARR are early; regions where the two track each other are maturing.
Total Customers by Region: A customer-count chart that shows commercial reach rather than investor enthusiasm. It is the chart to use when deciding where a go-to-market push will find existing demand.
Deal Close % by Region: Conversion rate by region, so an investor can see where deals actually complete and where processes stall.
Total Monthly Burn by Region: Aggregate monthly cash burn by region. Set against funding raised, it is the runway conversation in a single chart.
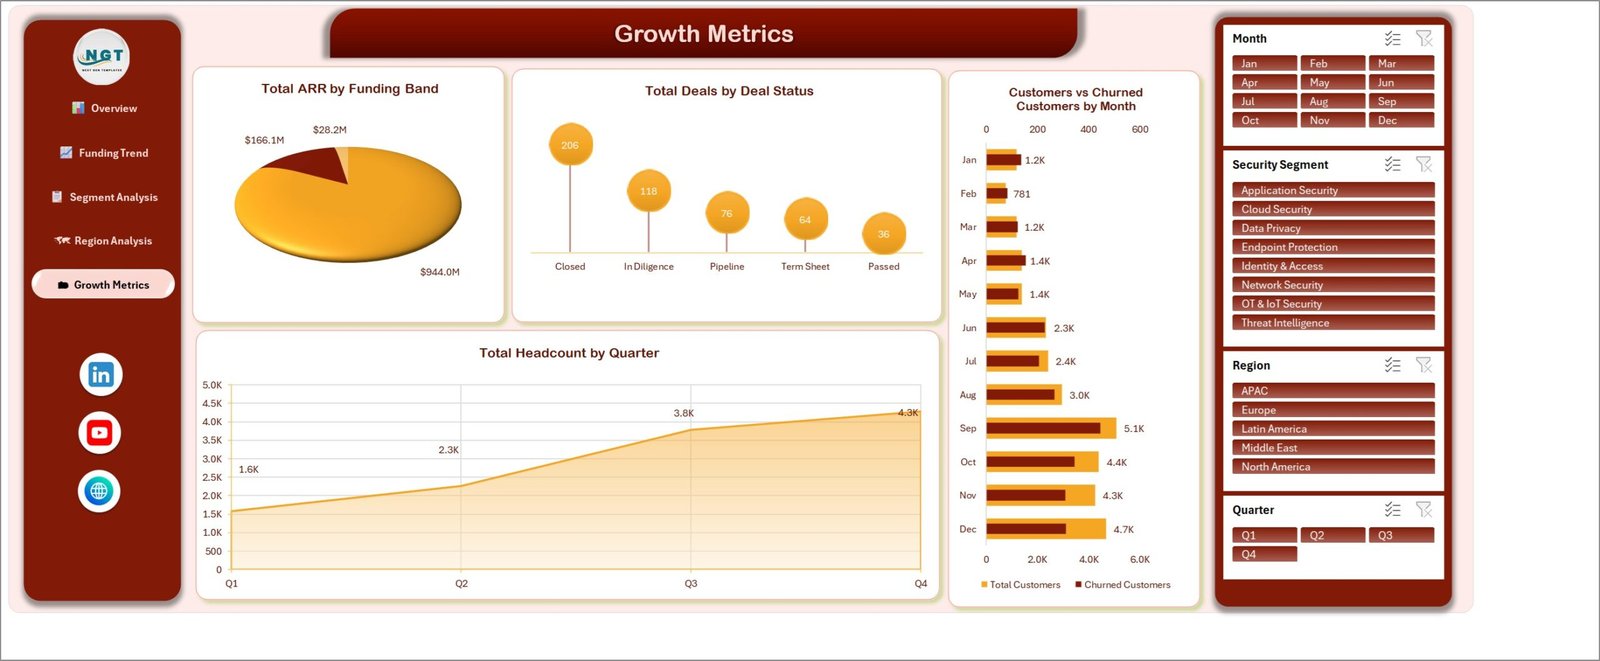
5. Growth Metrics
The Growth Metrics page is the trajectory view – where revenue sits by cheque size, how the pipeline is distributed, and how customers and teams grew over the year.
Total ARR by Funding Band: A share chart splitting recurring revenue across the Large, Mid, and Early funding bands, so you can see how much of the sector’s revenue really sits with the well-capitalised companies.
Total Deals by Deal Status: A funnel-style view across Closed, In Diligence, Pipeline, Term Sheet, and Passed. It is the pipeline health check, and it makes a stalled diligence stage obvious.
Customers vs Churned Customers by Month: A paired monthly bar chart running acquired customers against churned customers. Net growth is the difference between the two bars, and seeing them together stops churn from hiding inside a growing top line.
Total Headcount by Quarter: An area chart of total headcount across Q1 to Q4, showing whether hiring accelerated with funding or ran ahead of it.
6. Data Sheet
The Data sheet holds 500 sample deal records across 26 columns: Deal ID, Date, Startup Name, Security Segment, Funding Stage, Region, Investor Type, Deal Status, Funding Raised, Valuation, ARR, Customer Count, Customers Churned, Headcount, Monthly Burn, Product Rating, plus derived Month, Year, Quarter, deal-status counters, and Funding Band. Replace the sample rows with your own pipeline while keeping the same column order, and every page updates on Refresh All.
7. Support Sheet
The Support sheet carries the pivot tables that feed every chart on the five dashboard pages. It is there for maintenance and can be hidden in the copy you circulate, without breaking a single visual.
Cybersecurity Startups Dashboard in Excel vs. Google Sheets vs. Paid Market-Data SaaS – Where This Fits
| Feature | This Excel Dashboard | Google Sheets Alternative | Paid Market-Data SaaS |
|---|---|---|---|
| Cost | $17.99 one-time | Template cost or manual build | $5,000-$50,000+ per year |
| Platform | Microsoft Excel | Google Sheets | Vendor cloud platform |
| Setup time | Open, replace data, Refresh All | Copy sheet and configure sharing | Onboarding and data mapping |
| Works with your own deal pipeline | Yes – your rows, your columns | Yes, after rebuilding charts | Usually vendor data only |
| Real-time collaboration | Through OneDrive or SharePoint | Native collaboration | Usually seat-based |
| Customizable fields and charts | Fully editable workbook | Editable sheet structure | Limited by vendor settings |
| Offline access | Yes | Limited | Rarely |
| Year-1 cost at 5 users | $17.99 total | Template cost or build time | $5,000-$50,000+ |
| Startup funding analytics | Included across 5 pages | Requires custom setup | Usually included |
Who This Template Is For – and Who It’s Not For
It is for venture capital and corporate VC teams tracking cyber-sector deal flow, accelerator and incubator managers reporting on a cohort, startup founders preparing an investor update, corporate development and M&A teams mapping the security landscape, market analysts and consultants building sector reports, and LPs who want a readable one-file summary rather than a data-room export.
It is not for teams that need a live market-data feed, automatic company enrichment, or a CRM. This workbook does not scrape funding announcements, connect to Crunchbase or PitchBook, or manage investor relationships. It is the reporting layer you point at data you already have, whether that comes from a data provider export, a CRM report, or your own deal log.
How to Use the Cybersecurity Startups Dashboard in Excel
- Download the ZIP and open Cybersecurity Startups Dashboard in Excel.xlsx in Microsoft Excel. Enable editing if prompted.
- Open the Data sheet and look at the 500 sample rows so the column structure is clear before you change anything.
- Replace the sample rows with your own deal records, keeping the same column order. Keep values consistent – one spelling per segment, stage, region, investor type, and deal status.
- Go to Data > Refresh All. Every pivot, chart, and KPI card updates together.
- Use the Month, Security Segment, Region, and Quarter slicers on any page to filter the view for a partner meeting, a cohort review, or a single sub-sector.
- Hide the Support sheet before circulating the workbook if you want a clean, presentation-ready file.
Real-World Use Cases
Priya, venture partner: Priya refreshes the Data sheet each Monday from her deal log and uses Funding Trend and Growth Metrics to brief the investment committee on stage mix, quarterly capital deployed, and where the pipeline is stalling.
Marcus, accelerator director: Marcus filters to a single cohort quarter and reads Segment Analysis to compare ARR, customer count, product rating, and headcount across the security segments his teams are building in.
Elena, founder of an identity startup: Elena uses Region Analysis and the Customer Retention card to show prospective investors how her segment’s ARR, customer base, and burn compare with the wider market before her Series A.
Frequently Asked Questions
What does this dashboard track?
It tracks funding raised, valuation, ARR, customer count, customers churned, headcount, monthly burn, product rating, and deal count across security segment, funding stage, region, investor type, deal status, funding band, month, and quarter.
Do I need advanced Excel skills?
No. The normal workflow is to paste your records into the Data sheet, click Refresh All, and use the slicers. Advanced users can edit pivots, charts, and fields if they want to.
Does it connect to Crunchbase, PitchBook, or another data provider?
No. There is no live feed. Export or prepare your data first, paste it into the Data sheet, and refresh. That keeps the workbook free of subscriptions and lets it work with private deal logs as easily as with public data.
Can I use my own deal pipeline instead of the sample data?
Yes. Replace the 500 sample rows with your own records while keeping the column structure consistent, then refresh.
Can I change the security segments or funding stages?
Yes. The segment, stage, region, investor type, and deal status lists all come from the Data sheet, so editing your data changes what the charts and slicers show.
Can the Support sheet be hidden?
Yes. It can be hidden after setup and will keep powering the pivot tables and charts.
Which Excel versions does it work with?
It works in Excel 2016, 2019, 2021, and Microsoft 365 on Windows and Mac. Excel for the web can open it, but slicers and Refresh All behave best in the desktop app.
About the Author
Built by PK – Microsoft Certified Professional with 15+ years of Excel, Google Sheets, and Power BI experience. Founder of NextGenTemplates, reaching 300K+ subscribers across YouTube channels. Every template is hand-built and tested before release.
Explore Related Templates
Climate Tech Startups Dashboard in Excel – the same funding, valuation, and ARR analysis for the climate technology sector.
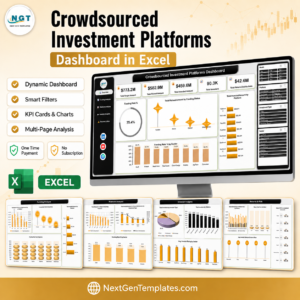
Crowdsourced Investment Platforms Dashboard in Excel – campaign, investor, and platform analytics for retail investment marketplaces.
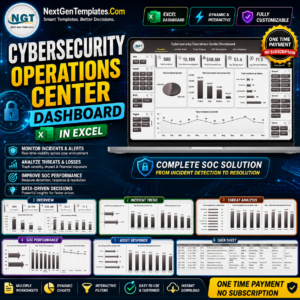
Cybersecurity Operations Center Dashboard in Excel – the operational side of cyber: incidents, alerts, detection, containment, and analyst workload.
Angel Investors KPI Dashboard in Excel – a KPI scorecard view for angel portfolios.
Browse more MS Excel templates and Excel Dashboard templates.
Ready to turn a cybersecurity deal log into a clear investment dashboard? Download the Cybersecurity Startups Dashboard in Excel and start reading funding, valuation, ARR, retention, burn, and pipeline conversion in one workbook.
Last updated: August 27, 2026

























Reviews
There are no reviews yet.