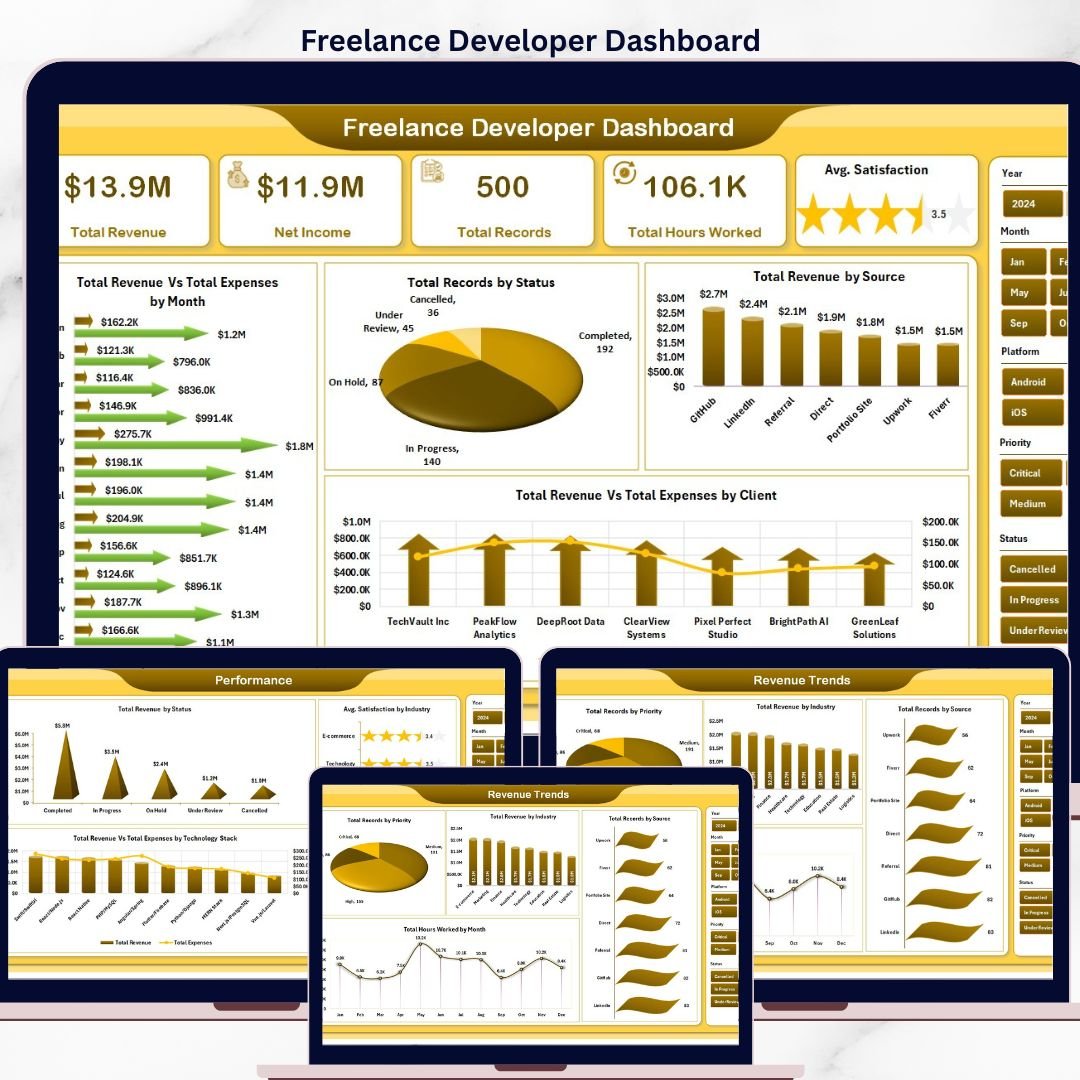
The Freelance Developer Dashboard in Excel tracks revenue, expenses, hours, client satisfaction, and project delivery across 500+ sample records on a single Excel file. The dashboard monitors 5 KPIs (Total Revenue, Net Income, Total Records, Total Hours Worked, Avg. Satisfaction) and renders 18+ charts across 5 interactive analysis pages with slicer-based filtering. Setup takes under 5 minutes — open the .xlsx file, replace the sample data, and click Data → Refresh All.
🌍 Join 8,400+ teams in 40+ countries using NextGenTemplates to replace paid SaaS tools with one-time-purchase Excel, Google Sheets, Power BI, and HTML templates.
✅ Instant download · One-time payment · No subscription · No per-user fees · Lifetime access
🔑 Key Features of Freelance Developer Dashboard in Excel
💰 5 headline KPI cards on the overview page — The overview displays Total Revenue, Net Income, Total Records, Total Hours Worked, and Avg. Satisfaction. Each card recalculates automatically when slicer filters are applied, so you can pivot from a 30,000-foot view to a single client or project type in two clicks.
📊 5 dedicated analysis sheet tabs with 18+ charts — Overview, Client Analysis, Project Insights, Revenue Trends, and Performance pages each focus on a different decision (which client is most profitable, which technology stack pays best per hour, which month trends up or down). No single sheet is cluttered.
🎛️ Slicer-driven filtering across every analysis page — Multiple slicers let you filter by client, status, payment status, project type, industry, technology stack, year, and more. Filter once, and every card and chart on the page redraws instantly — no VBA, no formulas to edit.
🔄 Fully dynamic via pivot tables on the Support Sheet — All charts are powered by pivot tables stored on a hidden Support Sheet. Update the Data Sheet with your own rows, click Data → Refresh All, and the entire dashboard rebuilds in under 2 seconds.
📁 Pre-formatted Data Sheet with 14+ columns — Structured columns for Client, Status, Source, Project Type, Industry, Technology Stack, Platform, Priority, Project Size, Hours Worked, Revenue, Expenses, Satisfaction, and Payment Status. Paste your own freelance logs in the same format and everything just works.
📦 What’s Inside the Freelance Developer Dashboard in Excel
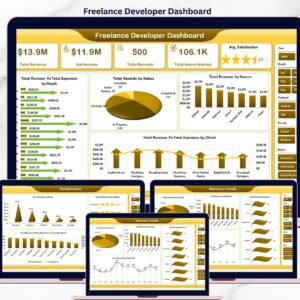
Freelance Developer Dashboard
1. Overview Page
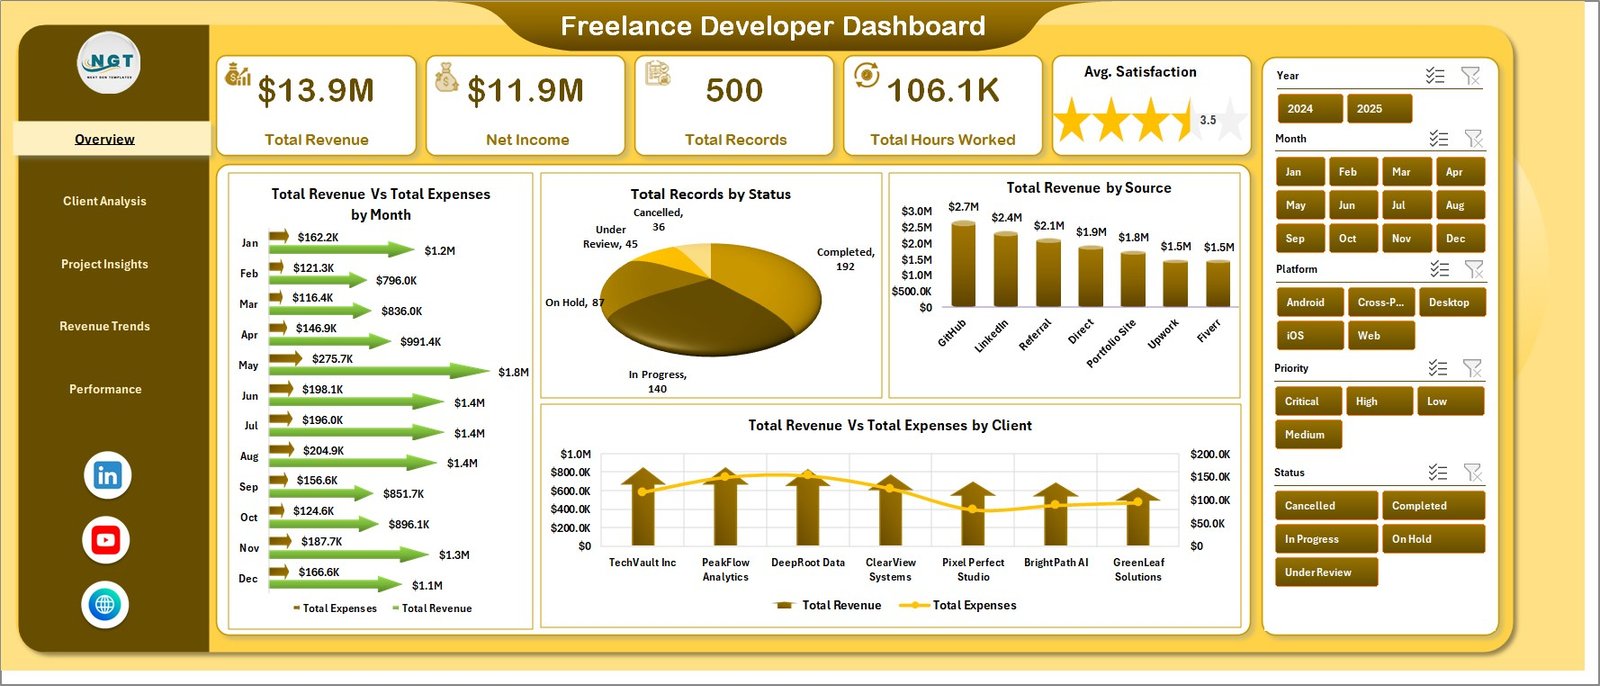
The Overview page is the command center. At the top, five KPI cards summarize the entire dataset: Total Revenue, Net Income, Total Records, Total Hours Worked, and Avg. Satisfaction. Slicers across the top let you filter the entire page in a single click. The following charts sit below the KPIs:
- Total Revenue Vs Total Expenses by Month — Compares monthly income against monthly expenses so you can spot cash-flow gaps and see whether margins are widening or tightening.
- Total Records by Status — Breaks down every project by its status (Completed, In Progress, Cancelled, On Hold) so you see delivery health at a glance.
- Total Revenue by Source — Shows how much revenue came from each lead source (Upwork, Referral, LinkedIn, Direct, etc.) so you can double down on channels that actually pay.
- Total Revenue Vs Total Expenses by Client — Ranks clients by profitability, revealing which relationships are worth keeping and which are bleeding hours.
2. Client Analysis
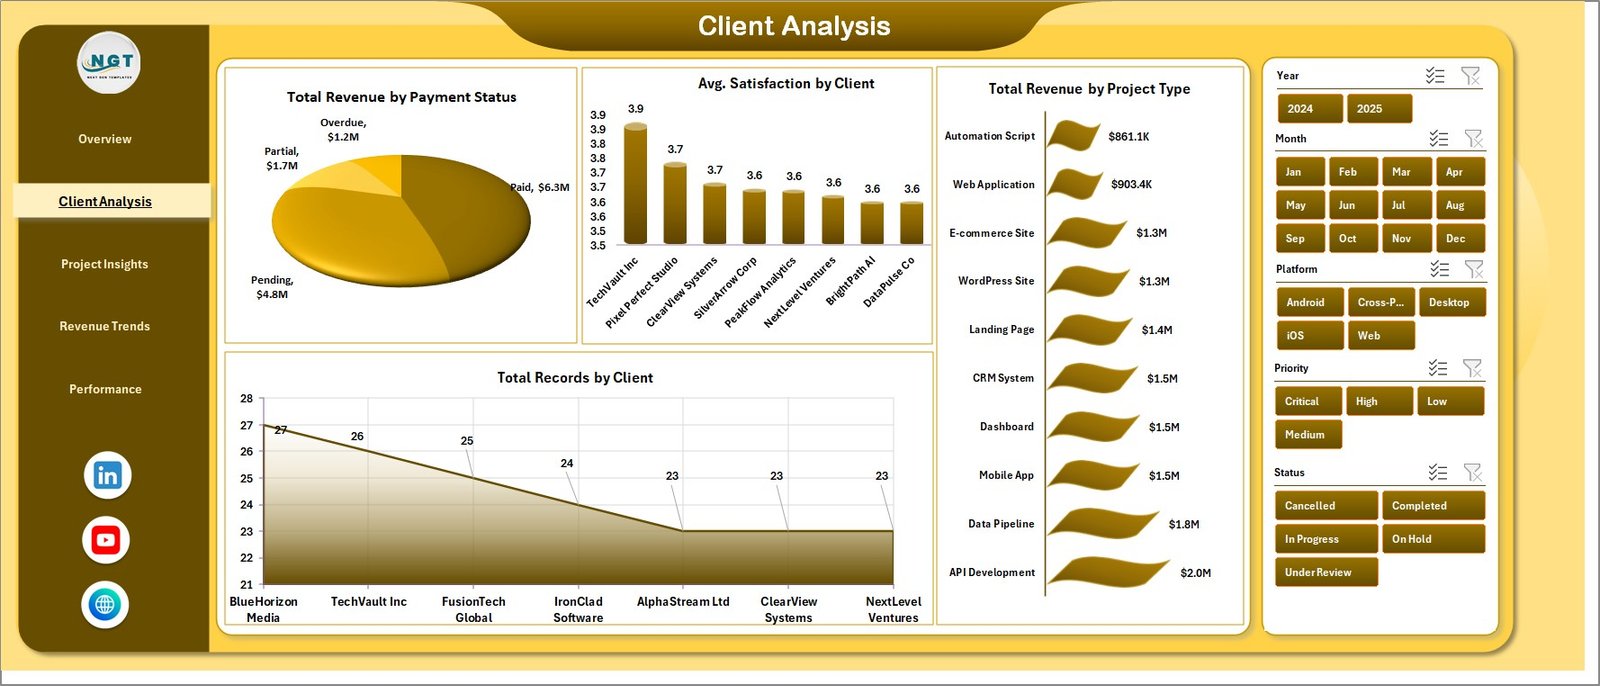
This sheet drills into client-level performance so you know who pays, who delays, and who deserves a raise in rates.
Client Analysis
- Total Revenue by Payment Status — Shows how much money is Paid, Pending, and Overdue so collections never slip through the cracks.
- Avg. Satisfaction by Client — Ranks clients by their satisfaction score so you spot happy repeat-buyers versus clients at risk of churn.
- Total Revenue by Project Type — Compares revenue across Web App, Mobile App, API, Landing Page, and other project types to see which engagements are most lucrative.
- Total Records by Client — Counts how many projects each client has commissioned, revealing your most loyal accounts.
3. Project Insights
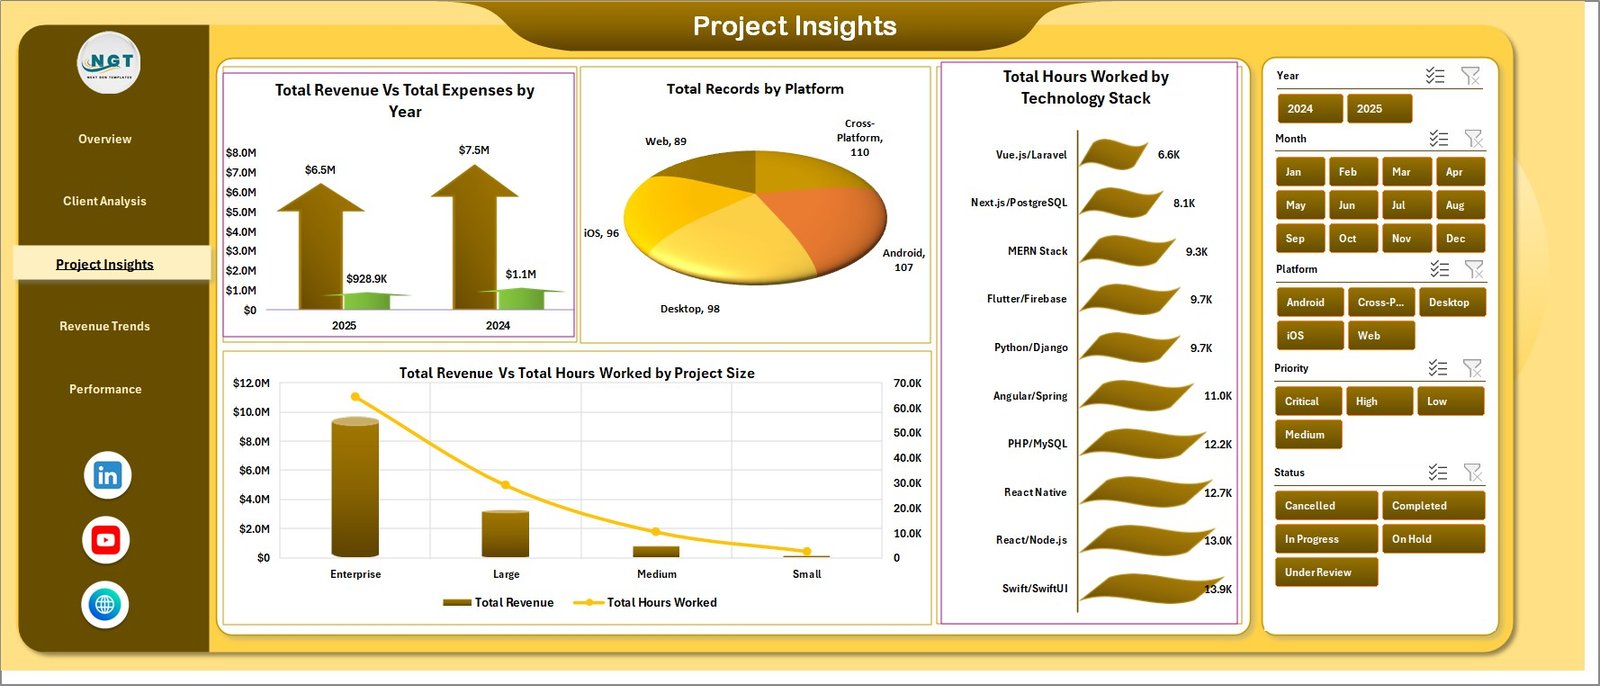
Project Insights looks at the work itself — where it came from, what stack you used, and how efficient you were.
Project Insights
- Total Revenue Vs Total Expenses by Year — Year-over-year P&L view so you can see whether your freelance business is actually scaling.
- Total Records by Platform — Counts projects sourced from Upwork, Fiverr, Toptal, Direct, LinkedIn, and other platforms.
- Total Hours Worked by Technology Stack — Shows where your hours went across React, Python, Node.js, .NET, Flutter, and more — critical for skill-pricing decisions.
- Total Revenue Vs Total Hours Worked by Project Size — Compares earned revenue against invested hours by project size (Small, Medium, Large), revealing effective hourly rates.
4. Revenue Trends
Revenue Trends surfaces time-based patterns and hidden opportunities in your pipeline.
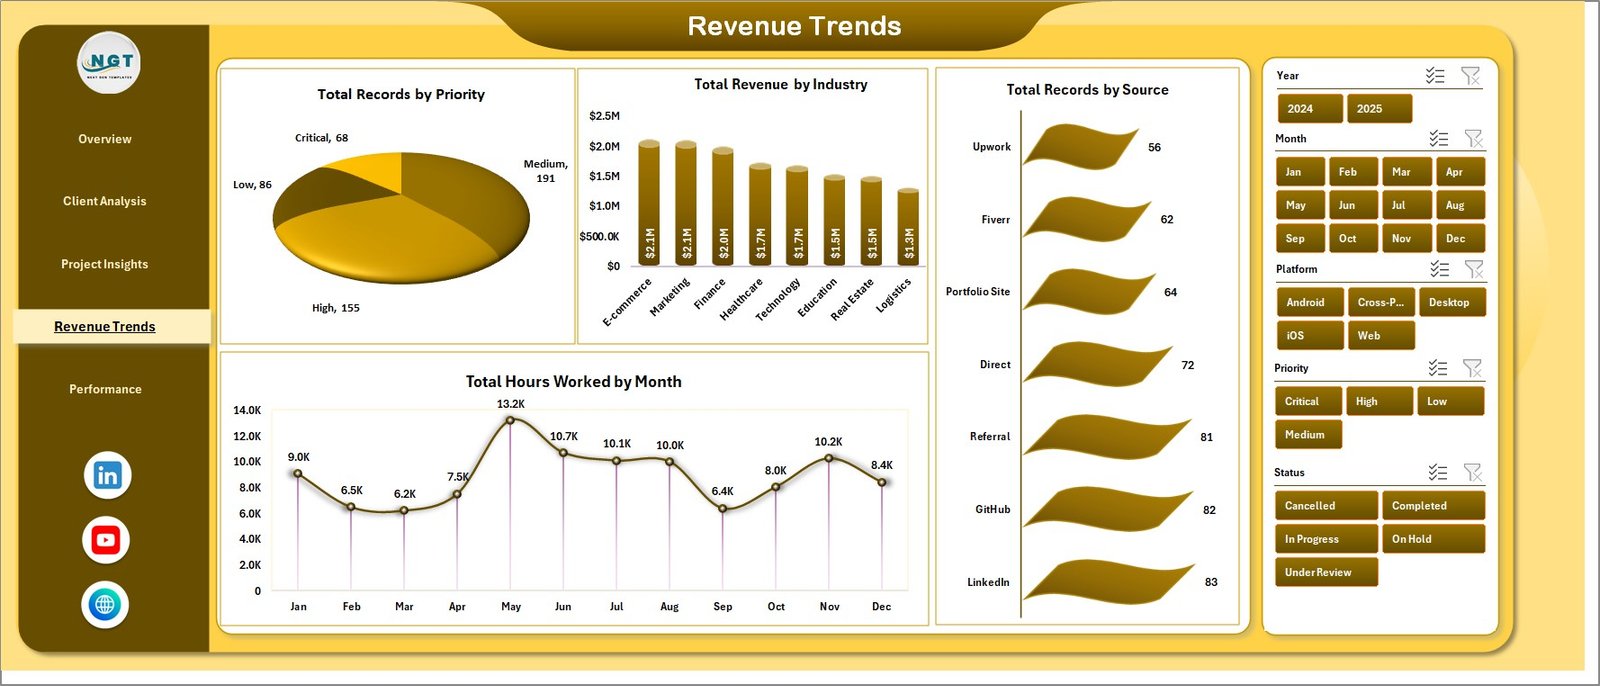
Revenue Trends
- Total Records by Priority — Counts how many High, Medium, and Low priority projects you juggle so you can rebalance workload.
- Total Revenue by Industry — Identifies which verticals (SaaS, E-commerce, Fintech, Healthcare, EdTech) pay you the most.
- Total Records by Source — Counts projects by acquisition channel to benchmark against the revenue-by-source view on the Overview page.
- Total Hours Worked by Month — Month-by-month workload view so you can spot seasonal crunches and plan capacity.
5. Performance
The Performance tab ties everything back to outcomes — were you paid, were clients happy, and which stack actually profits?
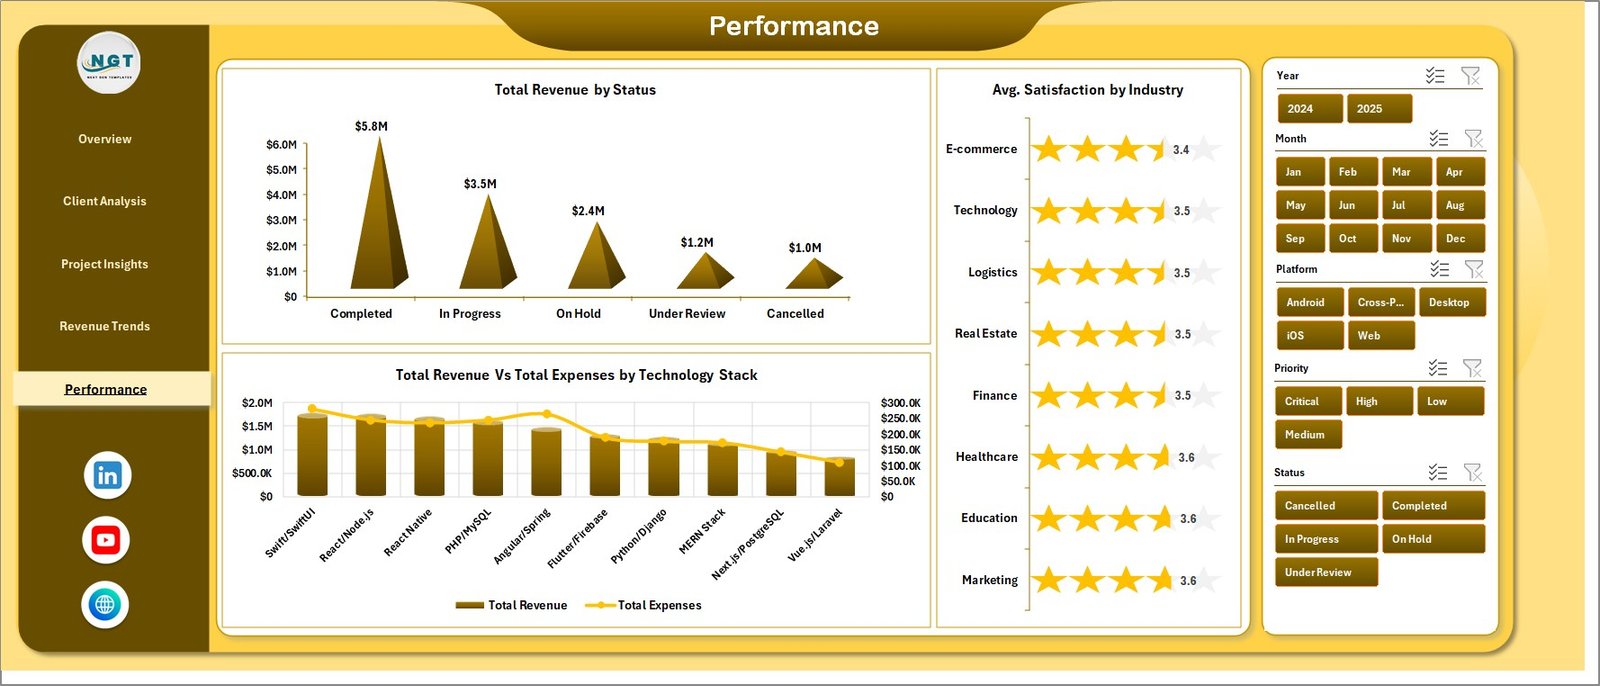
Performance
- Total Revenue by Status — Segments revenue across Completed, In Progress, Cancelled, and On Hold projects to highlight locked-in versus at-risk income.
- Avg. Satisfaction by Industry — Shows which verticals rate your work highest — useful for case-study selection and positioning.
- Total Revenue Vs Total Expenses by Technology Stack — Reveals the real profitability of each tech stack after infrastructure, tooling, and subcontractor costs.
6. Data Sheet
The Data Sheet is where you paste or type your own freelance records in the same column structure — Client, Status, Source, Project Type, Industry, Technology Stack, Hours Worked, Revenue, Expenses, Satisfaction, Payment Status, and more.
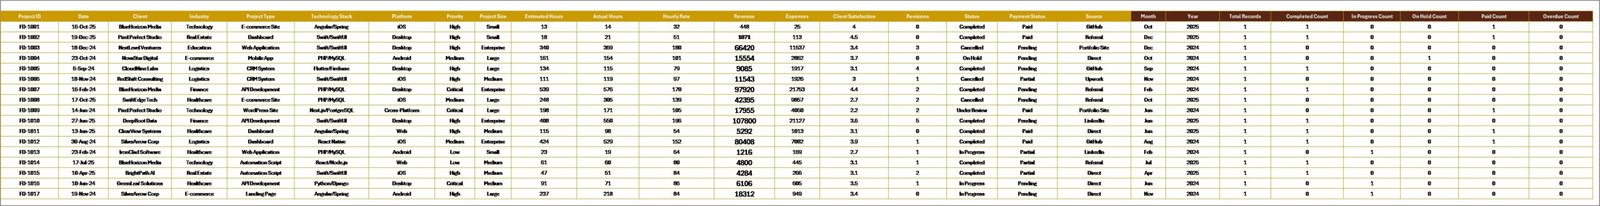
Data Sheet tab
7. Support Sheet
This hidden sheet holds every pivot table that drives the dashboard. After adding new data, go to Data → Refresh All and every chart and KPI card updates automatically. You can keep this sheet hidden during day-to-day use.
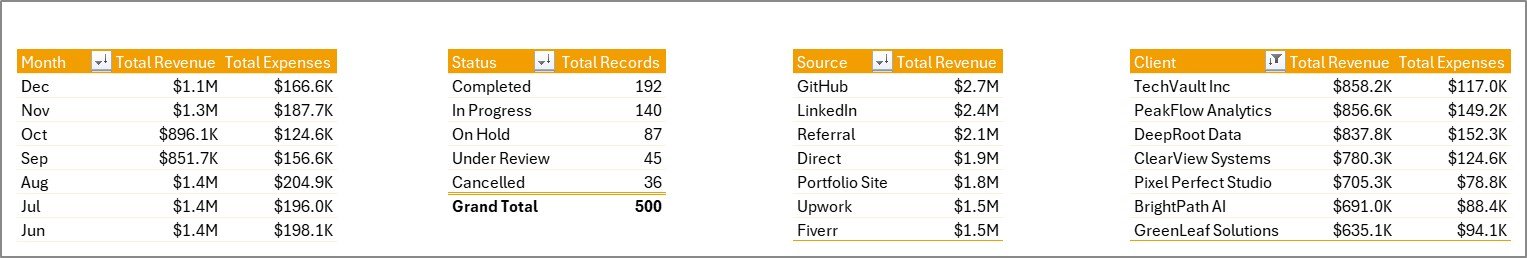
Support sheet tab
📊 Freelance Developer Dashboard in Excel vs. Google Sheets Dashboard vs. Paid SaaS — Where This Fits
| Feature | Freelance Developer Dashboard in Excel | Google Sheets Equivalent | HoneyBook / Bonsai / FreshBooks |
|---|---|---|---|
| Cost | $17.99 one-time | $9.99 one-time | $20-40 / user / month |
| Platform | Microsoft Excel (offline) | Google Sheets (cloud) | Proprietary cloud SaaS |
| Setup time | Under 5 minutes | Under 5 minutes | 1-2 hours + onboarding |
| Slicers & pivot refresh | ✅ Built-in | Partial (filter views) | N/A (prebuilt views only) |
| Works offline | ✅ Yes | No (needs internet) | No (needs internet) |
| Customizable fields | ✅ Full control | ✅ Full control | Limited to vendor schema |
| Multi-user real-time | Via OneDrive/365 | ✅ Native | ✅ Native |
| Year-1 cost at 1 user | $17.99 | $9.99 | $240-480 |
| Client invoicing built-in | No (pair with invoice template) | No | ✅ Yes |
For solo developers who want a fast, private, Excel-native revenue + project view without a $30/month subscription, the Freelance Developer Dashboard in Excel sits in the sweet spot.
👥 Who This Template Is For — and Who It’s Not For
✅ This template is built for:
- Solo freelance web, mobile, and full-stack developers tracking 20-500 projects per year
- Indie hackers and contractors running businesses on Upwork, Fiverr, Toptal, or direct clients
- Small agencies (1-5 people) who want one file summarizing revenue, hours, and client health
- Developers migrating off Notion/Airtable dashboards who want full Excel control
❌ This template is NOT for:
- Agencies with 10+ employees needing role-based access and SSO
- Teams that require automatic invoice sending, payment gateways, or client portals
- Non-developers — industry categories and technology-stack fields are developer-focused
- Users who don’t have Microsoft Excel 2016 or later
⚙️ How to Use the Freelance Developer Dashboard in Excel
- Download the .zip file and extract the .xlsx to your computer.
- Open the file in Microsoft Excel 2016 or later (Excel 365 recommended).
- Go to the Data Sheet and replace the sample rows with your own freelance project records in the same format.
- Click the Data tab in the Excel Ribbon, then click Refresh All. Every pivot and chart will recalculate.
- Return to the Overview tab and use the slicers to filter by client, status, platform, or technology stack.
- Explore the Client Analysis, Project Insights, Revenue Trends, and Performance tabs for deeper drill-downs.
💼 Real-World Use Cases
Aarav is a full-stack freelance developer in Bengaluru. He juggles 8-12 projects per quarter across Upwork and direct clients. Using the Freelance Developer Dashboard in Excel, he opens the file each Monday, checks Total Revenue by Source, and decides whether to pitch more on Upwork or double down on LinkedIn outreach — without paying $29/month for HoneyBook.
Priya runs a 3-person React agency in Pune. She uses the dashboard to track which technology stack (React, Next.js, React Native) generates the highest revenue per hour. The Total Revenue Vs Total Hours Worked by Project Size chart helped her increase her minimum project size from $2,000 to $5,000 within one quarter.
Marcus is an indie mobile developer in Berlin. He used to track everything in Notion but found reporting painful. With the Freelance Developer Dashboard in Excel, he pastes Clockify exports into the Data Sheet, clicks Refresh All, and gets a client-by-client P&L in seconds.
🔗 Explore Related Templates
- Freelancer Business Dashboard in Excel — broader view covering income, pipeline, and client-level P&L
- Also available in Power BI →
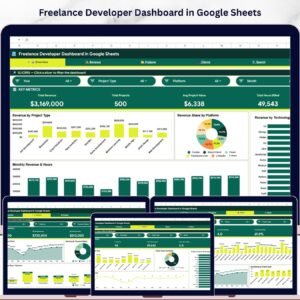
- Also available in Google Sheets →
- Browse all Excel Dashboards — 600+ production-grade Excel dashboards across every department
- Browse all Excel KPI Dashboards — 1,280+ KPI-focused templates
❓ Frequently Asked Questions
What KPIs does the Freelance Developer Dashboard in Excel track?
The Freelance Developer Dashboard in Excel tracks 5 headline KPIs — Total Revenue, Net Income, Total Records, Total Hours Worked, and Avg. Satisfaction — plus 18+ supporting charts across Client Analysis, Project Insights, Revenue Trends, and Performance tabs. All metrics update automatically when you replace the sample data with your own.
Which Excel version do I need?
The Freelance Developer Dashboard in Excel works in Microsoft Excel 2016 and later. Excel 365 is recommended for the best slicer and pivot-refresh performance. The file does not use VBA, so macro warnings will not appear and no security settings need to be adjusted.
How long does setup take?
Setup for the Freelance Developer Dashboard in Excel takes under 5 minutes. Open the .xlsx file, go to the Data Sheet, paste your freelance project records in the same column format, then click Data → Refresh All. Every KPI card and chart across all 5 dashboard pages will update instantly.
How does this compare to HoneyBook or Bonsai?
HoneyBook and Bonsai cost $20-40 per user per month and lock your data in a vendor cloud. The Freelance Developer Dashboard in Excel is a one-time $17.99 purchase that runs offline on Excel, gives you full control of every column and chart, and has no per-user fees. It does not send invoices — pair it with a separate Excel invoice template for that.
Can I add or remove columns in the Data Sheet?
Yes. The Freelance Developer Dashboard in Excel uses standard Excel pivot tables on a Support Sheet. If you add a new column, refresh the pivot cache from the Support Sheet and add the field to any pivot layout. If you remove a column referenced by a pivot, just delete that field from the pivot layout.
Does the dashboard work offline?
Yes, the Freelance Developer Dashboard in Excel runs completely offline on any computer with Microsoft Excel 2016 or later. No internet connection, no account signup, and no cloud sync is required. You can sync manually via OneDrive or SharePoint if you want multi-device access.
Is this template suitable for small agencies, not just solo freelancers?
Yes. The Freelance Developer Dashboard in Excel works well for solo developers and small agencies up to 5 people. Use the Client column to tag which developer owns which project, or save a separate copy per team member and consolidate monthly. For 10+ person agencies, a multi-user SaaS is usually a better fit.
👤 About the Author
Built by PK — Microsoft Certified Professional with 15+ years of Excel, Google Sheets, and Power BI experience. Founder of NextGenTemplates, reaching 300K+ subscribers across YouTube channels (@PK-AnExcelExpert, @NextGenTemplates, @NeoTechNavigators). Every template is hand-built and tested before release.
📖 Click here to read the Detailed Blog Post
🎥 Visit our YouTube channel for step-by-step video tutorials
👉 YouTube.com/@NextGenTemplates
📅 Last updated: April 2026


Reviews
There are no reviews yet.