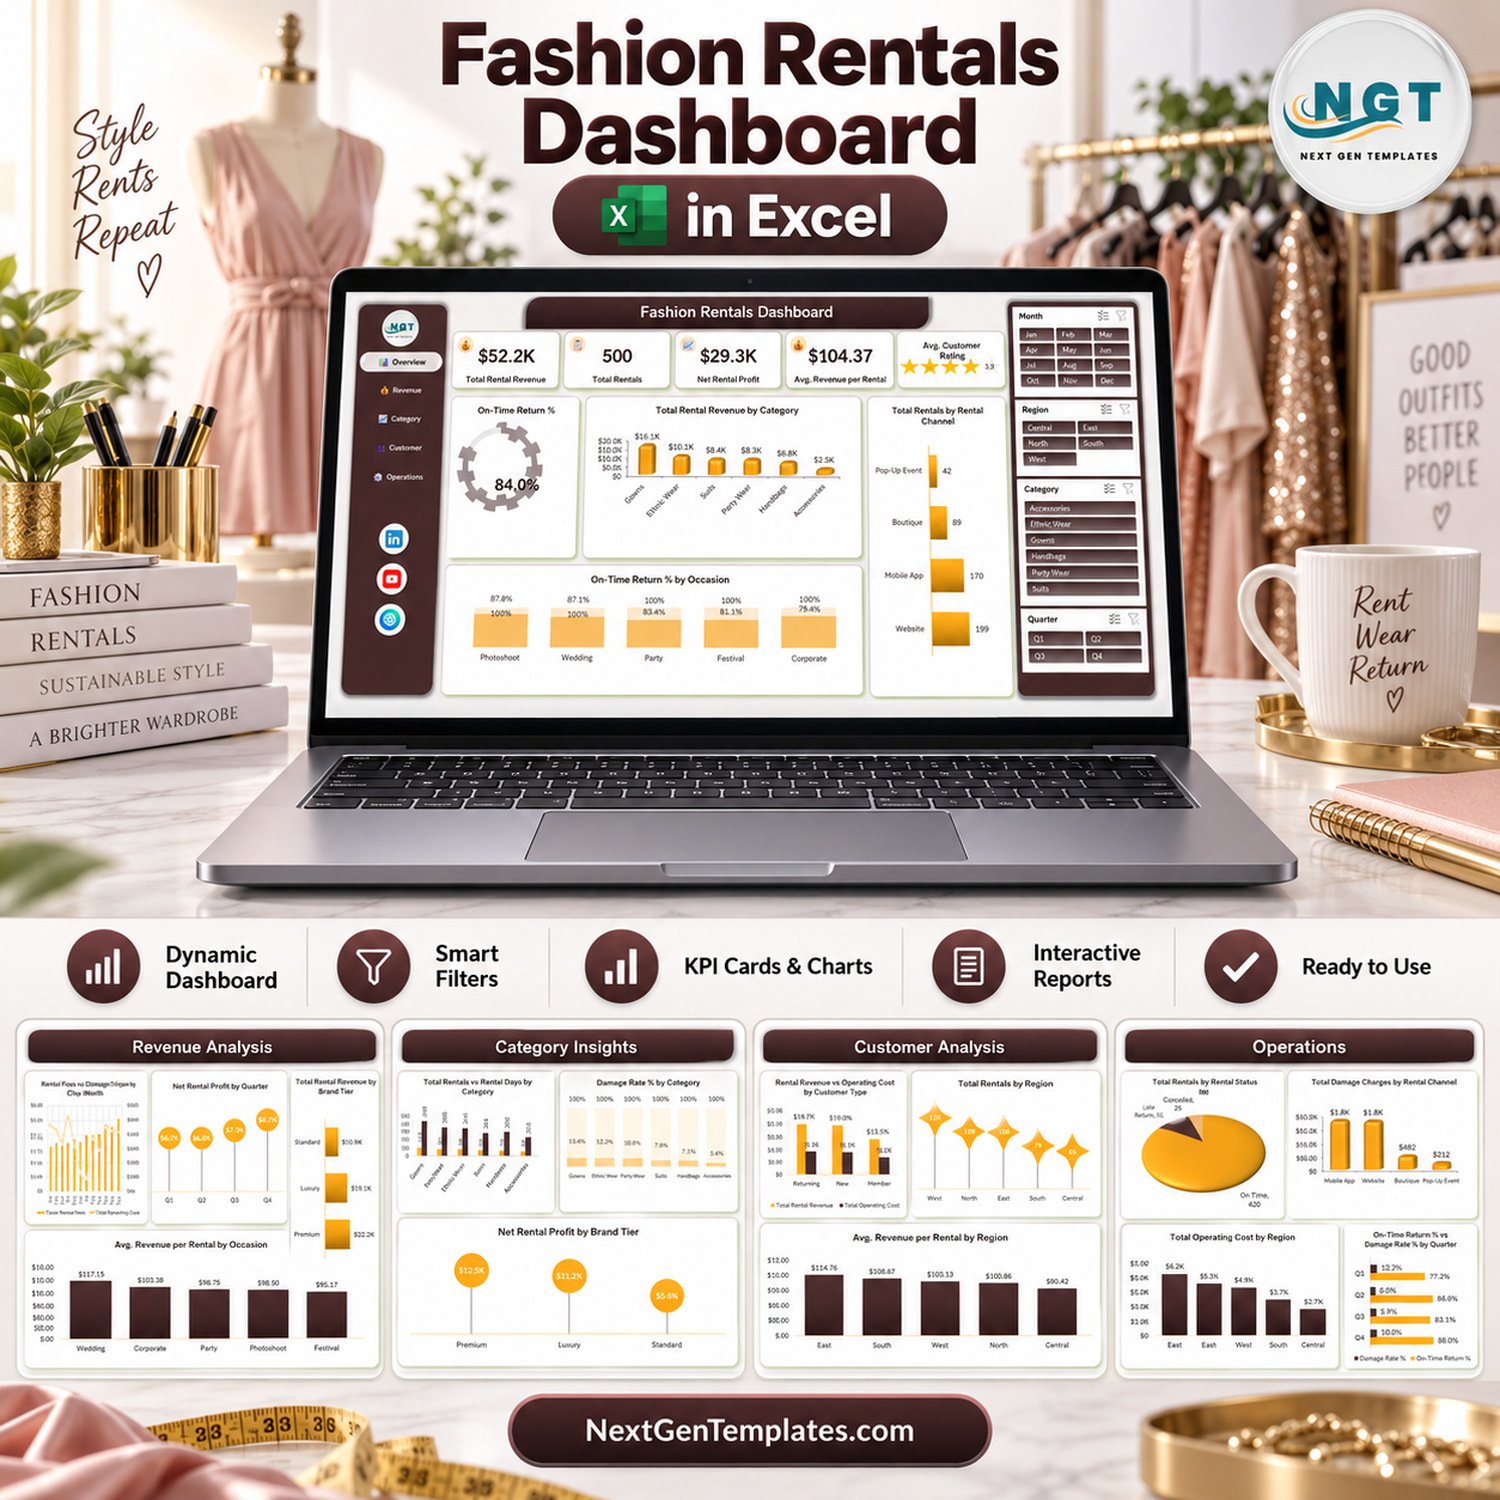
The Fashion Rentals Dashboard in Excel turns 500 sample rental records into 5 KPI cards, 20 charts and 4 slicers spread across 5 linked dashboard pages. It tracks rental revenue, net rental profit, on-time returns, damage rate and customer ratings for gowns, ethnic wear, suits, party wear, handbags and accessories. Paste your own rentals into the Data table, click Refresh All, and every card and chart updates.
🌍 Join 8,400+ teams in 40+ countries using NextGenTemplates to replace paid SaaS tools with one-time-purchase Excel, Google Sheets, Power BI and HTML templates.
✅ Instant download · One-time payment · No subscription · No per-user fees · Lifetime access

🔑 Key Features of the Fashion Rentals Dashboard in Excel
📊 Five KPI cards on the Overview: Total Rental Revenue ($52.2K in the sample), Total Rentals (500), Net Rental Profit ($29.3K), Avg. Revenue per Rental ($104.37) and Avg. Customer Rating (3.9 out of 5, shown as stars). Each card reads from the same pivot cache, so every number follows the slicers.
🎛️ Four slicers on every page: Month, Region, Category and Quarter sit in the right-hand panel of all five pages. One click on Gowns or Q4 filters every chart on the page, so you can compare a single category, region or season without building a new report.
🧭 Left-side page navigation: Overview, Revenue, Category, Customer and Operations buttons move you between pages in one click, which keeps the workbook usable for staff who never open the Data sheet.
👗 Built around how a rental business really runs: the data model separates rental fees, late fees and damage charges from cleaning, logistics and operating cost, and records rental days, security deposit, brand tier, occasion, rental channel, customer type and return status for every booking.
🔁 Returns and damage in one view: On-Time Return % (84.0% in the sample), Damage Rate % by Category and a Total Rentals by Rental Status split (420 on time, 55 late, 25 cancelled) show where garments come back late or damaged.
⚙️ No macros, no add-ins: the file is a standard .xlsx built on an Excel table, 25 PivotTables and PivotCharts. Nothing needs to be enabled, and new rows added inside the table are picked up on the next refresh.
📦 What’s Inside the Download
The zip holds the workbook (7 sheets: Overview, Revenue Analysis, Category Insights, Customer Analysis, Operations, Data and Support) and the Excel Dashboard User Manual PDF. Here is what each page shows.
Page 1: Overview
This page shows the five KPI cards plus On-Time Return %, Total Rental Revenue by Category, Total Rentals by Rental Channel and On-Time Return % by Occasion. In the sample, Gowns lead revenue at $16.1K and the Website channel books the most rentals (199).
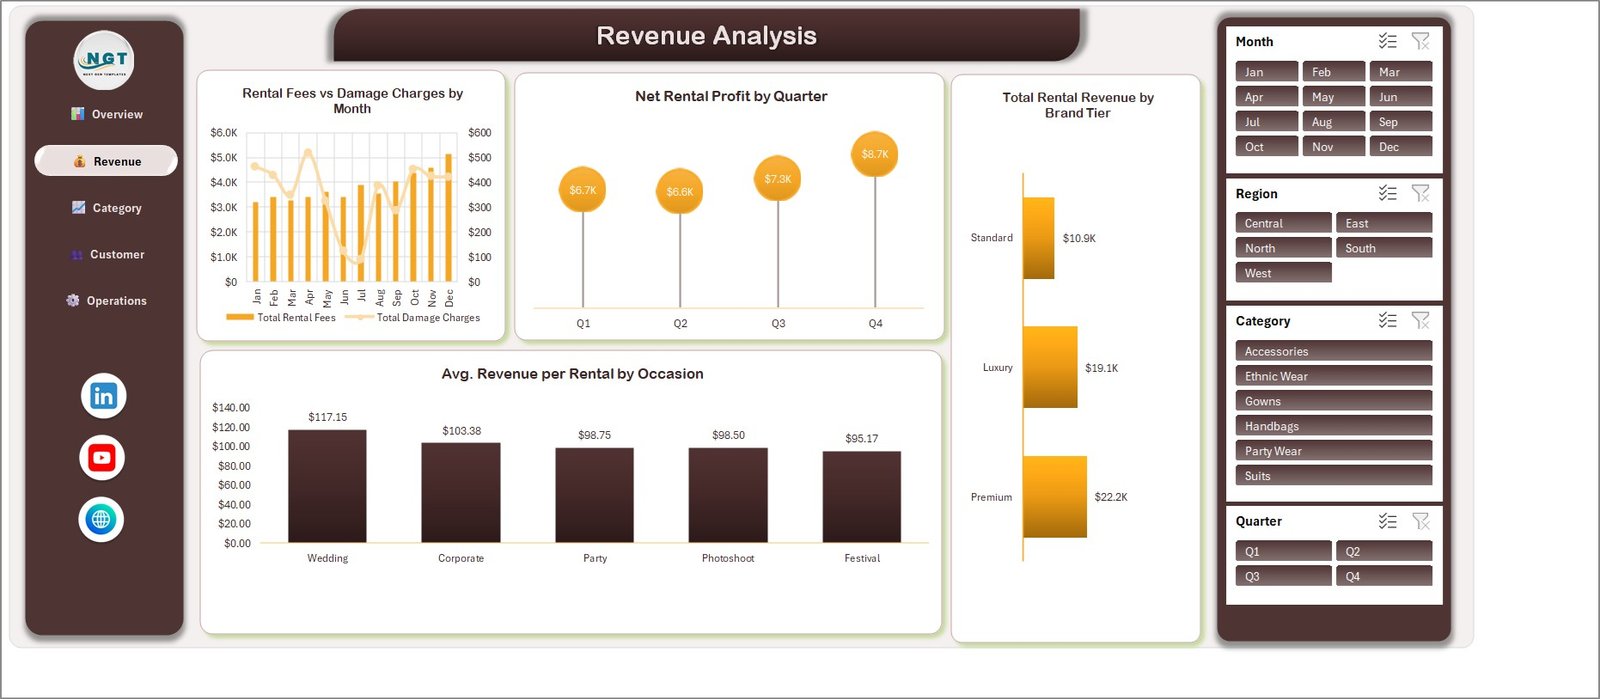
Page 2: Revenue Analysis
Charts include Rental Fees vs Damage Charges by Month, Net Rental Profit by Quarter, Total Rental Revenue by Brand Tier and Avg. Revenue per Rental by Occasion. Wedding rentals earn the highest average ticket ($117.15) and Premium brands the most revenue ($22.2K).
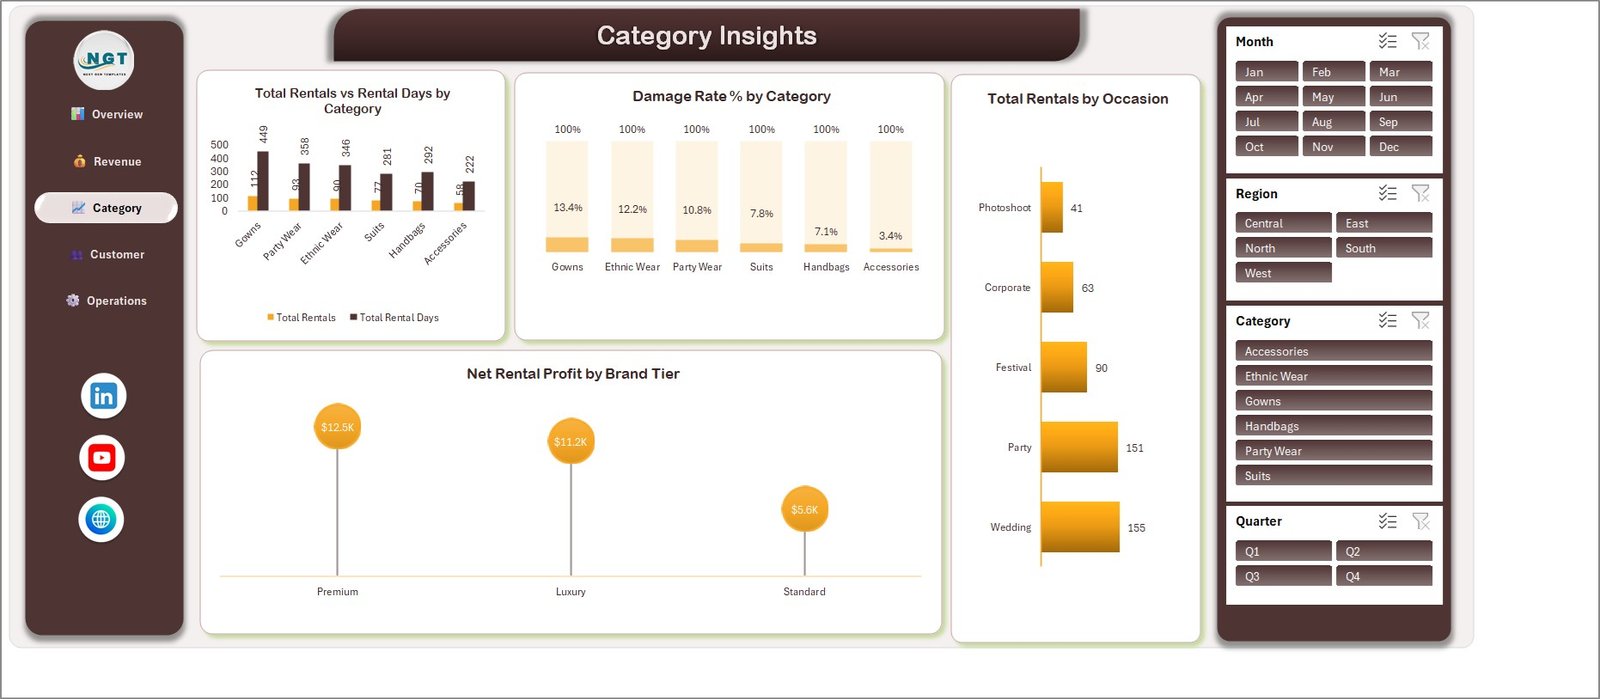
Page 3: Category Insights
Charts include Total Rentals vs Rental Days by Category, Damage Rate % by Category, Total Rentals by Occasion and Net Rental Profit by Brand Tier. Gowns carry the highest damage rate (13.4%) while Accessories sit at 3.4%.
Page 4: Customer Analysis
Charts include Rental Revenue vs Operating Cost by Customer Type, Total Rentals by Region, On-Time Return % by Customer Type and Avg. Revenue per Rental by Region. Members return on time 91.7% of the time against 80.0% for new customers.

Page 5: Operations
Charts include Total Rentals by Rental Status, Total Damage Charges by Rental Channel, On-Time Return % vs Damage Rate % by Quarter and Total Operating Cost by Region. The West region carries the highest operating cost ($6.2K).

Data Sheet
An Excel table (TblData) with 500 sample rentals dated January to December 2025 and 29 columns: Rental ID, Rental Date, Customer Name, Customer Type, Region, Rental Channel, Category, Brand Tier, Occasion, Rental Days, Rental Fee, Late Fees, Damage Charges, Total Revenue, Cleaning Cost, Logistics Cost, Operating Cost, Security Deposit, Customer Rating, Rental Status and Damage Reported, plus eight formula helper columns (Month, Year, Quarter and the status counters). All names are fictional sample data.
Support Sheet
Holds the PivotTables that feed each chart and card, grouped by dashboard page. You do not need to edit it; Refresh All updates it from the Data table.
📊 Excel vs. Google Sheets vs. Paid Rental Software: Where This Fits
| Feature | Fashion Rentals Dashboard (Excel) | Build it yourself in Google Sheets | Paid rental software (Booqable, Rentle and similar) |
|---|---|---|---|
| Cost | ✅ $17.99 one-time | Free tool, but hours of build time | Recurring monthly subscription |
| Platform | Desktop Microsoft Excel | Browser | Browser and apps |
| Setup time | ✅ Under 15 minutes with your own data | Days to design pivots and charts | Onboarding plus catalogue setup |
| Real-time team collaboration | Through OneDrive or SharePoint co-authoring | ✅ Built in | ✅ Built in |
| Mobile access | View only in Excel mobile | ✅ Yes | ✅ Yes |
| Customizable fields | ✅ Full control of columns, charts and colours | ✅ Full control | Limited to the vendor’s fields |
| Share with link | Via OneDrive | ✅ Yes | User seats required |
| Year-1 cost at 5 users | ✅ $17.99 total | Free plus build time | Plan fees for the whole year |
| Damage rate and on-time return analysis | ✅ Ready-made charts | Must be built | Depends on plan and reports |
| Online bookings and payments | ❌ Not included | ❌ Not included | ✅ Core feature |
For rental owners who want clear revenue, return and damage reporting without paying a monthly analytics fee, this Excel dashboard sits in the sweet spot. If you need online booking and payments, pair it with your booking tool and paste the exported rentals in.
👥 Who This Template Is For, and Who It’s Not For
✅ This template is built for:
- 👗 Dress, gown and ethnic-wear rental boutiques that export bookings to a spreadsheet
- 💼 Suit and occasion-wear rental shops comparing channels such as website, mobile app, store and pop-up events
- 📈 Owners and analysts who present monthly or quarterly rental performance to partners or investors
❌ This template is NOT for:
- Businesses looking for a booking calendar, availability checker or payment system; this is a reporting dashboard, not rental software
- Teams working only in Google Sheets, Excel for the web or on a phone; the slicers and PivotCharts are built for desktop Excel
- Shops that need per-garment stock tracking by item ID or size; the data model reports by category and brand tier, not individual pieces
⚙️ How to Use the Dashboard
- Unzip the download and open the workbook in desktop Microsoft Excel (Microsoft 365, Excel 2021, 2019 or 2016).
- Go to the Data sheet and clear the 500 sample rows, keeping the header row and the table.
- Paste your rentals into the input columns (Rental ID to Damage Reported). The helper columns fill themselves.
- Click Data > Refresh All to update every PivotTable, card and chart.
- Use the left navigation buttons to move between pages and the Month, Region, Category and Quarter slicers to filter.
New to slicers? Microsoft’s guide on using slicers to filter data explains how they work.
💼 Real-World Use Cases
Priya runs a bridal and ethnic-wear rental studio with two stores. She pastes her monthly booking export into the Data table and uses Damage Rate % by Category to decide which gowns need a higher security deposit before wedding season.
Marcus manages a suit rental business that sells through a website and pop-up events. Total Rentals by Rental Channel and Total Damage Charges by Rental Channel show him whether pop-up events are worth the logistics cost each quarter.
Elena is the analyst for a subscription wardrobe start-up. She filters the Customer Analysis page by Region and Quarter to show investors that members return garments on time more often than new customers and earn more per rental.
❓ Frequently Asked Questions
What KPIs does the Fashion Rentals Dashboard in Excel track?
It shows five KPI cards: Total Rental Revenue, Total Rentals, Net Rental Profit, Avg. Revenue per Rental and Avg. Customer Rating. Twenty charts add On-Time Return %, Damage Rate %, rental days, operating cost and damage charges by category, occasion, brand tier, channel, region and customer type.
Which version of Excel do I need?
Use desktop Microsoft Excel: Microsoft 365, Excel 2021, 2019 or 2016 on Windows, or a recent Excel for Mac. The dashboard relies on PivotTables, PivotCharts and slicers. It contains no macros, so there is nothing to enable, but Excel for the web and mobile apps are not supported for working with it.
How long does setup take?
Most users are running on their own data in under 15 minutes. Clear the sample rows in the Data table, paste your rentals into the same columns, then click Refresh All. The user manual PDF in the download walks through each step.
Can I add my own categories, regions or channels?
Yes. Type any category, region, rental channel, occasion or brand tier into the Data table and refresh. New values appear in the charts and slicers automatically because every PivotTable reads from the same Excel table.
How does this compare to paid rental software such as Booqable?
Rental software handles bookings, availability and payments for a monthly fee. This dashboard does none of that. It is a one-time $17.99 reporting layer that analyses revenue, profit, returns and damage from data you export, so many owners use both.
Is there a Power BI or Google Sheets version?
Not of this dashboard yet. If you prefer Google Sheets, the Fashion and Apparel Dashboard in Google Sheets covers retail fashion sales in the browser.
👤 About the Author
Built by PK, Microsoft Certified Professional with 15+ years of Excel, Google Sheets and Power BI experience. Founder of NextGenTemplates, reaching 300K+ subscribers across YouTube channels (@PKAnExcelExpert, @NextGenTemplates, @NeoTechNavigators). Every template is hand-built and tested before release.
🔗 Explore Related Templates
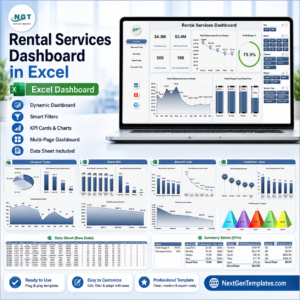
🧾 Rental Services Dashboard in Excel: the same rental-business view for general rental companies.
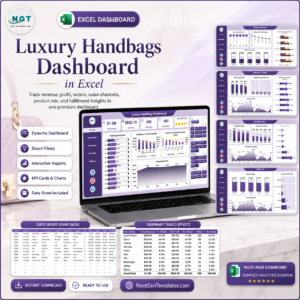
👜 Luxury Handbags Dashboard in Excel: sales and margin analysis for premium accessories.
🛍️ Fashion Boutiques Dashboard in Excel: store sales reporting for boutiques that sell rather than rent.
📈 Fast Fashion Brands KPI Dashboard in Excel: a month-picker KPI dashboard with targets and trends for fashion brands.
Browse every Excel Dashboard Template or the full MS Excel template collection.
📖 Click here to read the Detailed Blog Post
🎥 Visit our YouTube channel for step-by-step video tutorials
👉 YouTube.com/@NextGenTemplates
📅 Last updated: September 2026