

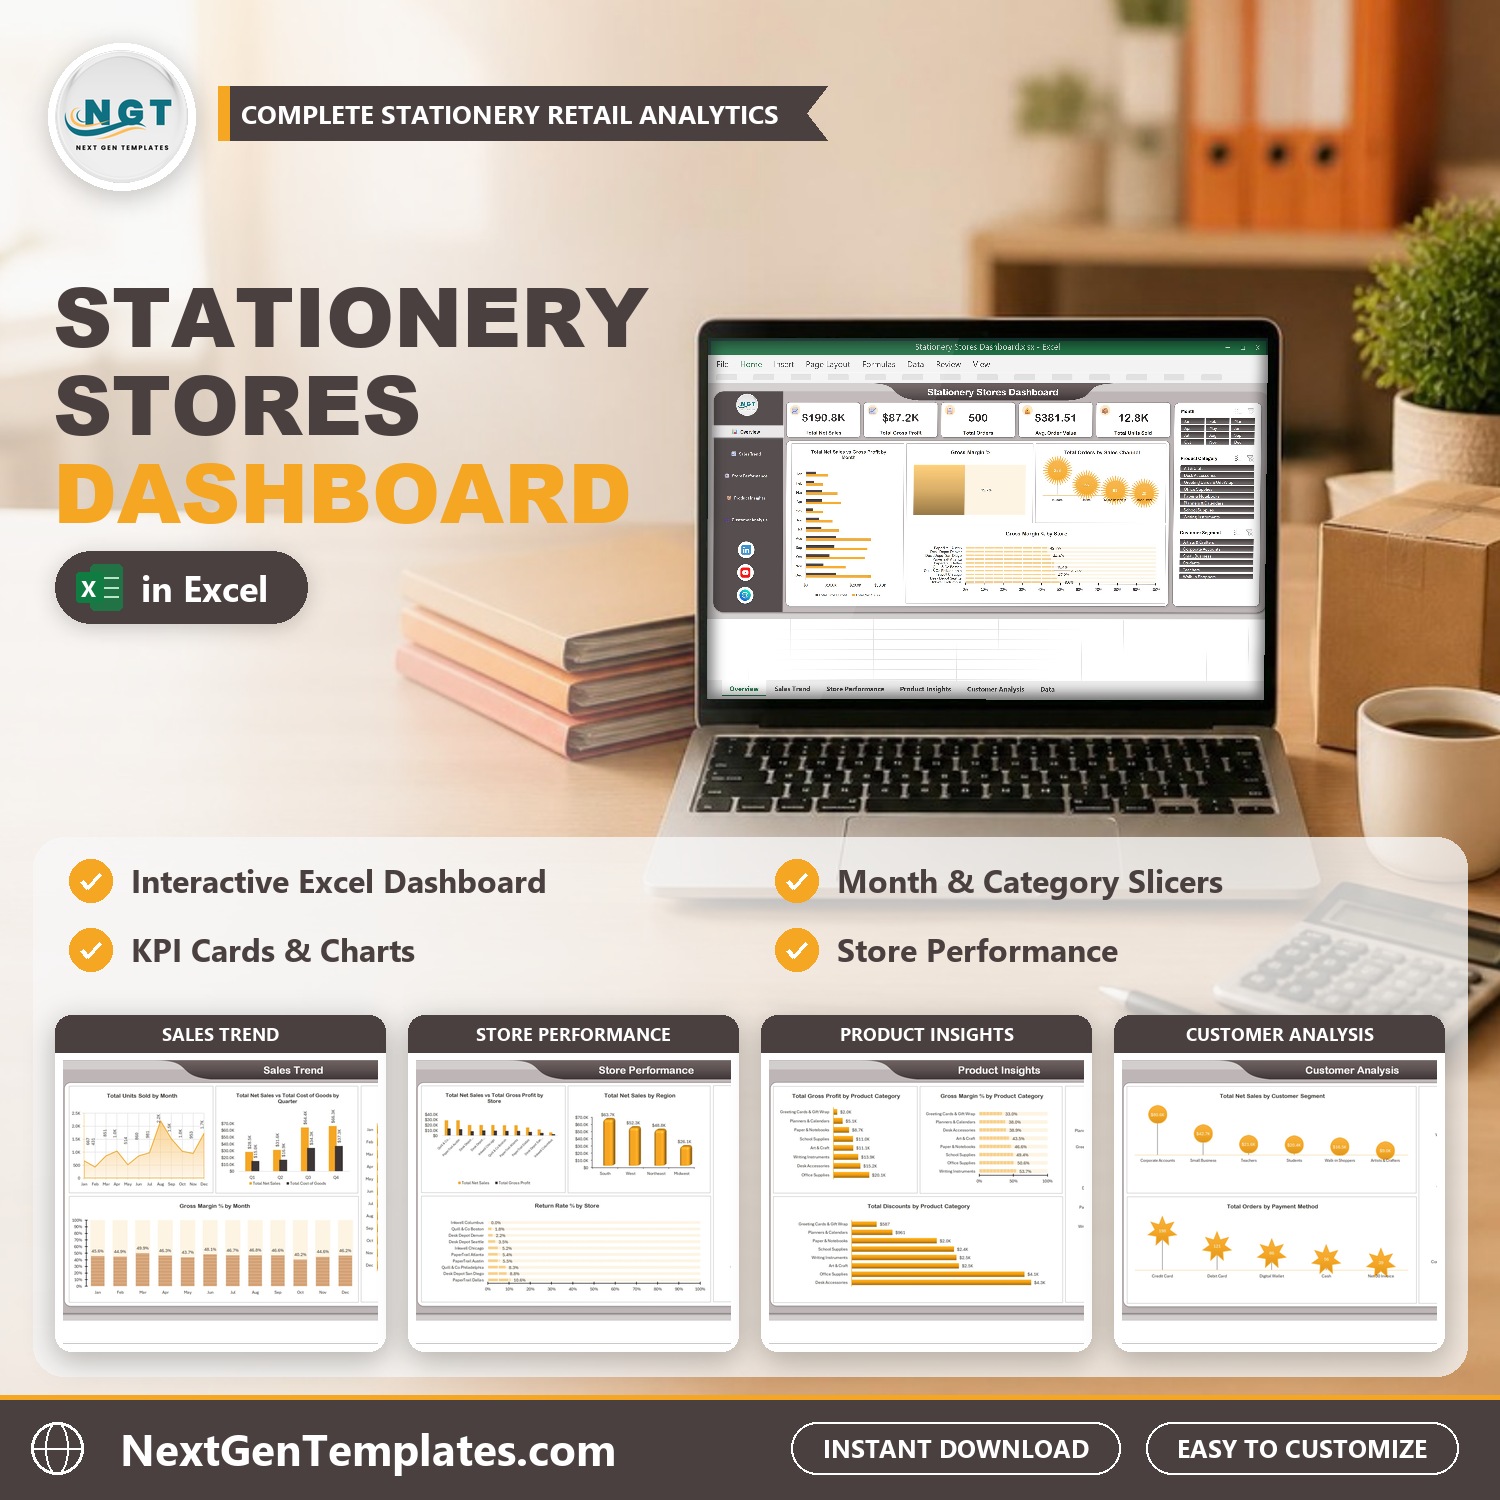
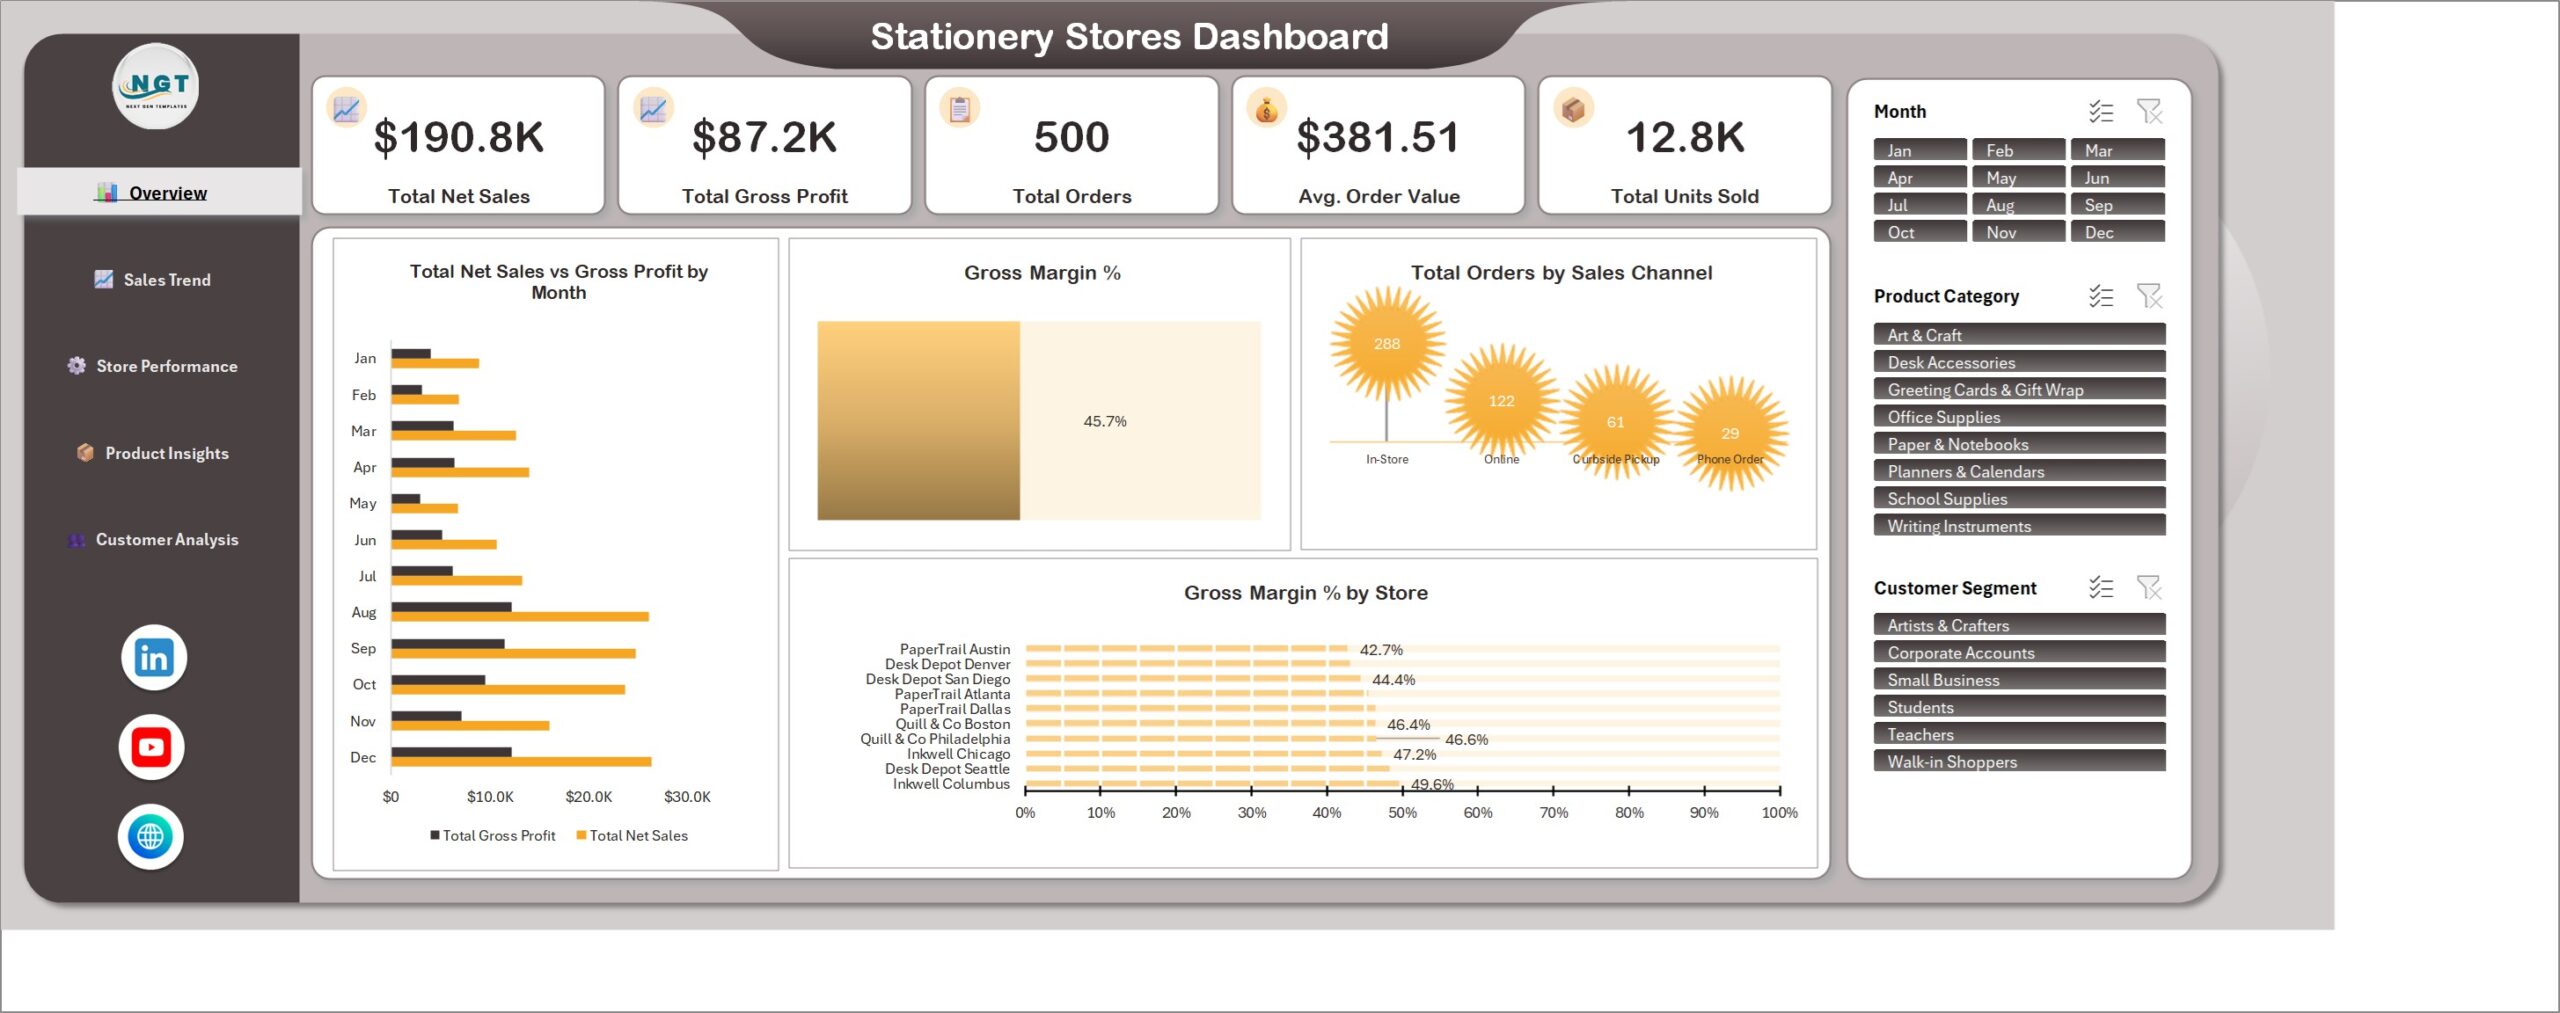
Stationery Stores Dashboard in Excel turns 500 sample orders into five interactive pages that show where a stationery business earns its sales and profit, store by store, category by category and customer segment by customer segment. The overview shows $190.8K net sales, $87.2K gross profit, 500 orders, a $381.51 average order value and 12.8K units sold, with a 45.7% gross margin. All figures are fictional sample data. Replace them with your own orders and click Refresh All to update every chart.
Watch the Stationery Stores Dashboard in Excel walkthrough
Key Features of Stationery Stores Dashboard in Excel
- Five analysis pages: Overview, Sales Trend, Store Performance, Product Insights and Customer Analysis.
- Five KPI cards: Total Net Sales, Total Gross Profit, Total Orders, Average Order Value and Total Units Sold.
- Excel dashboard with slicers: Month, Product Category and Customer Segment slicers sit on every page and filter all of them together.
- Store comparison: net sales, gross profit, gross margin, customer rating and return rate for ten example stores.
- Category insight: gross profit, gross margin, units sold and discounts for eight stationery product categories.
- Customer view: net sales and average order value by customer segment, plus orders by payment method.
- Plain .xlsx: built with pivot tables, pivot charts and slicers. No macros and no add-ins.
- Customer ZIP: includes the Excel workbook and the Excel Dashboard User Manual PDF.
What’s Inside the Stationery Sales Dashboard
Overview
The landing page shows the five KPI cards with Total Net Sales vs Gross Profit by Month, a Gross Margin % gauge, Total Orders by Sales Channel (In-Store, Online, Curbside Pickup and Phone Order) and Gross Margin % by Store. It works as a quick retail sales dashboard Excel owners can read in a minute.
Sales Trend
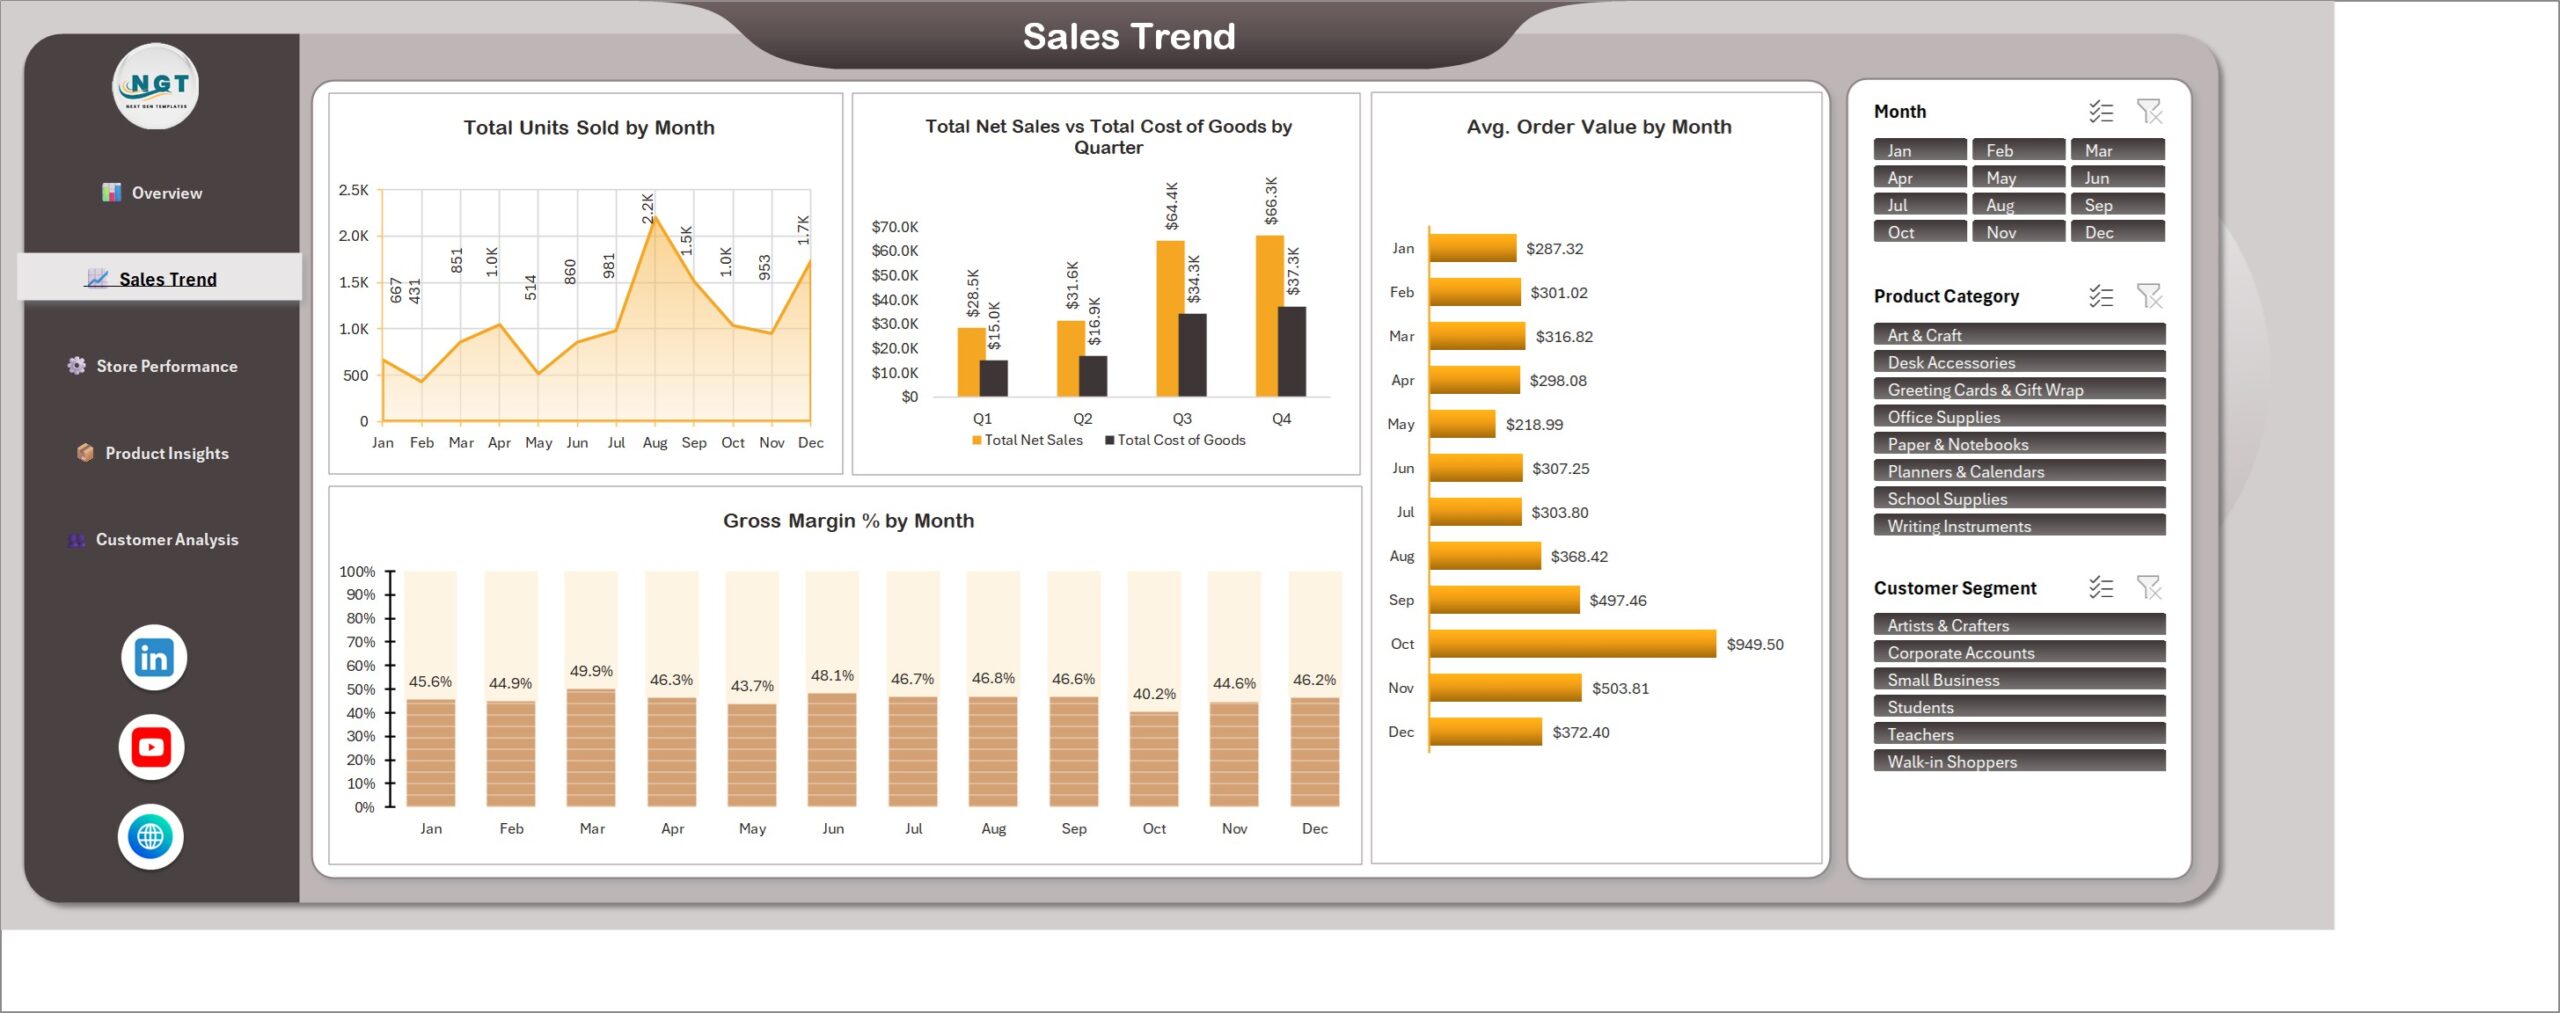
Track Total Units Sold by Month, Total Net Sales vs Total Cost of Goods by Quarter, Gross Margin % by Month and Avg. Order Value by Month. Use it to see seasonal peaks in your own records.
Store Performance
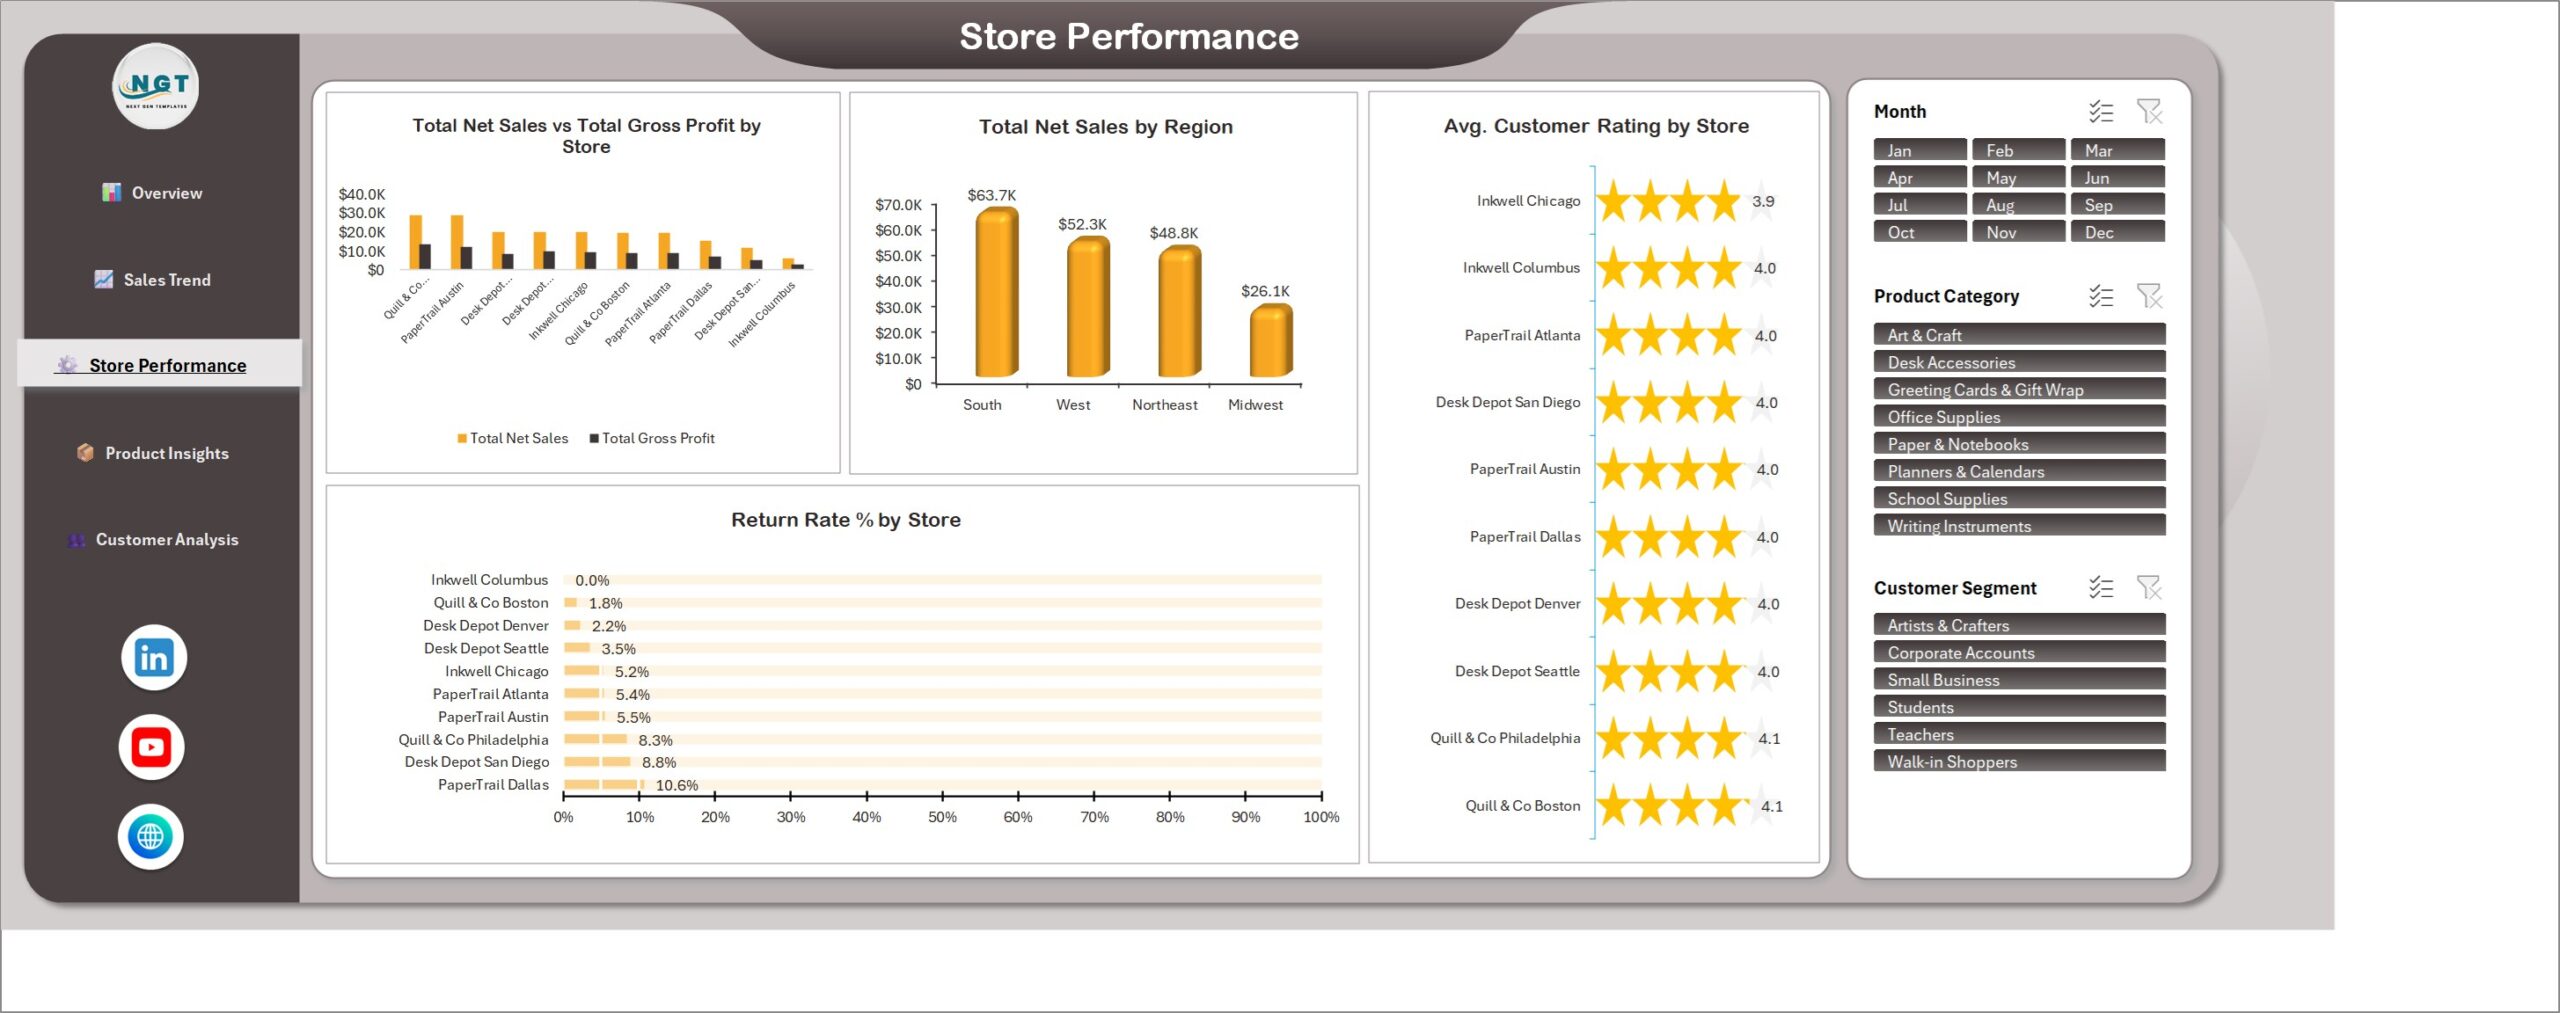
Compare Total Net Sales vs Total Gross Profit by Store, Total Net Sales by Region, Avg. Customer Rating by Store and Return Rate % by Store. It acts as a store performance dashboard Excel managers can use to spot which locations need attention.
Product Insights
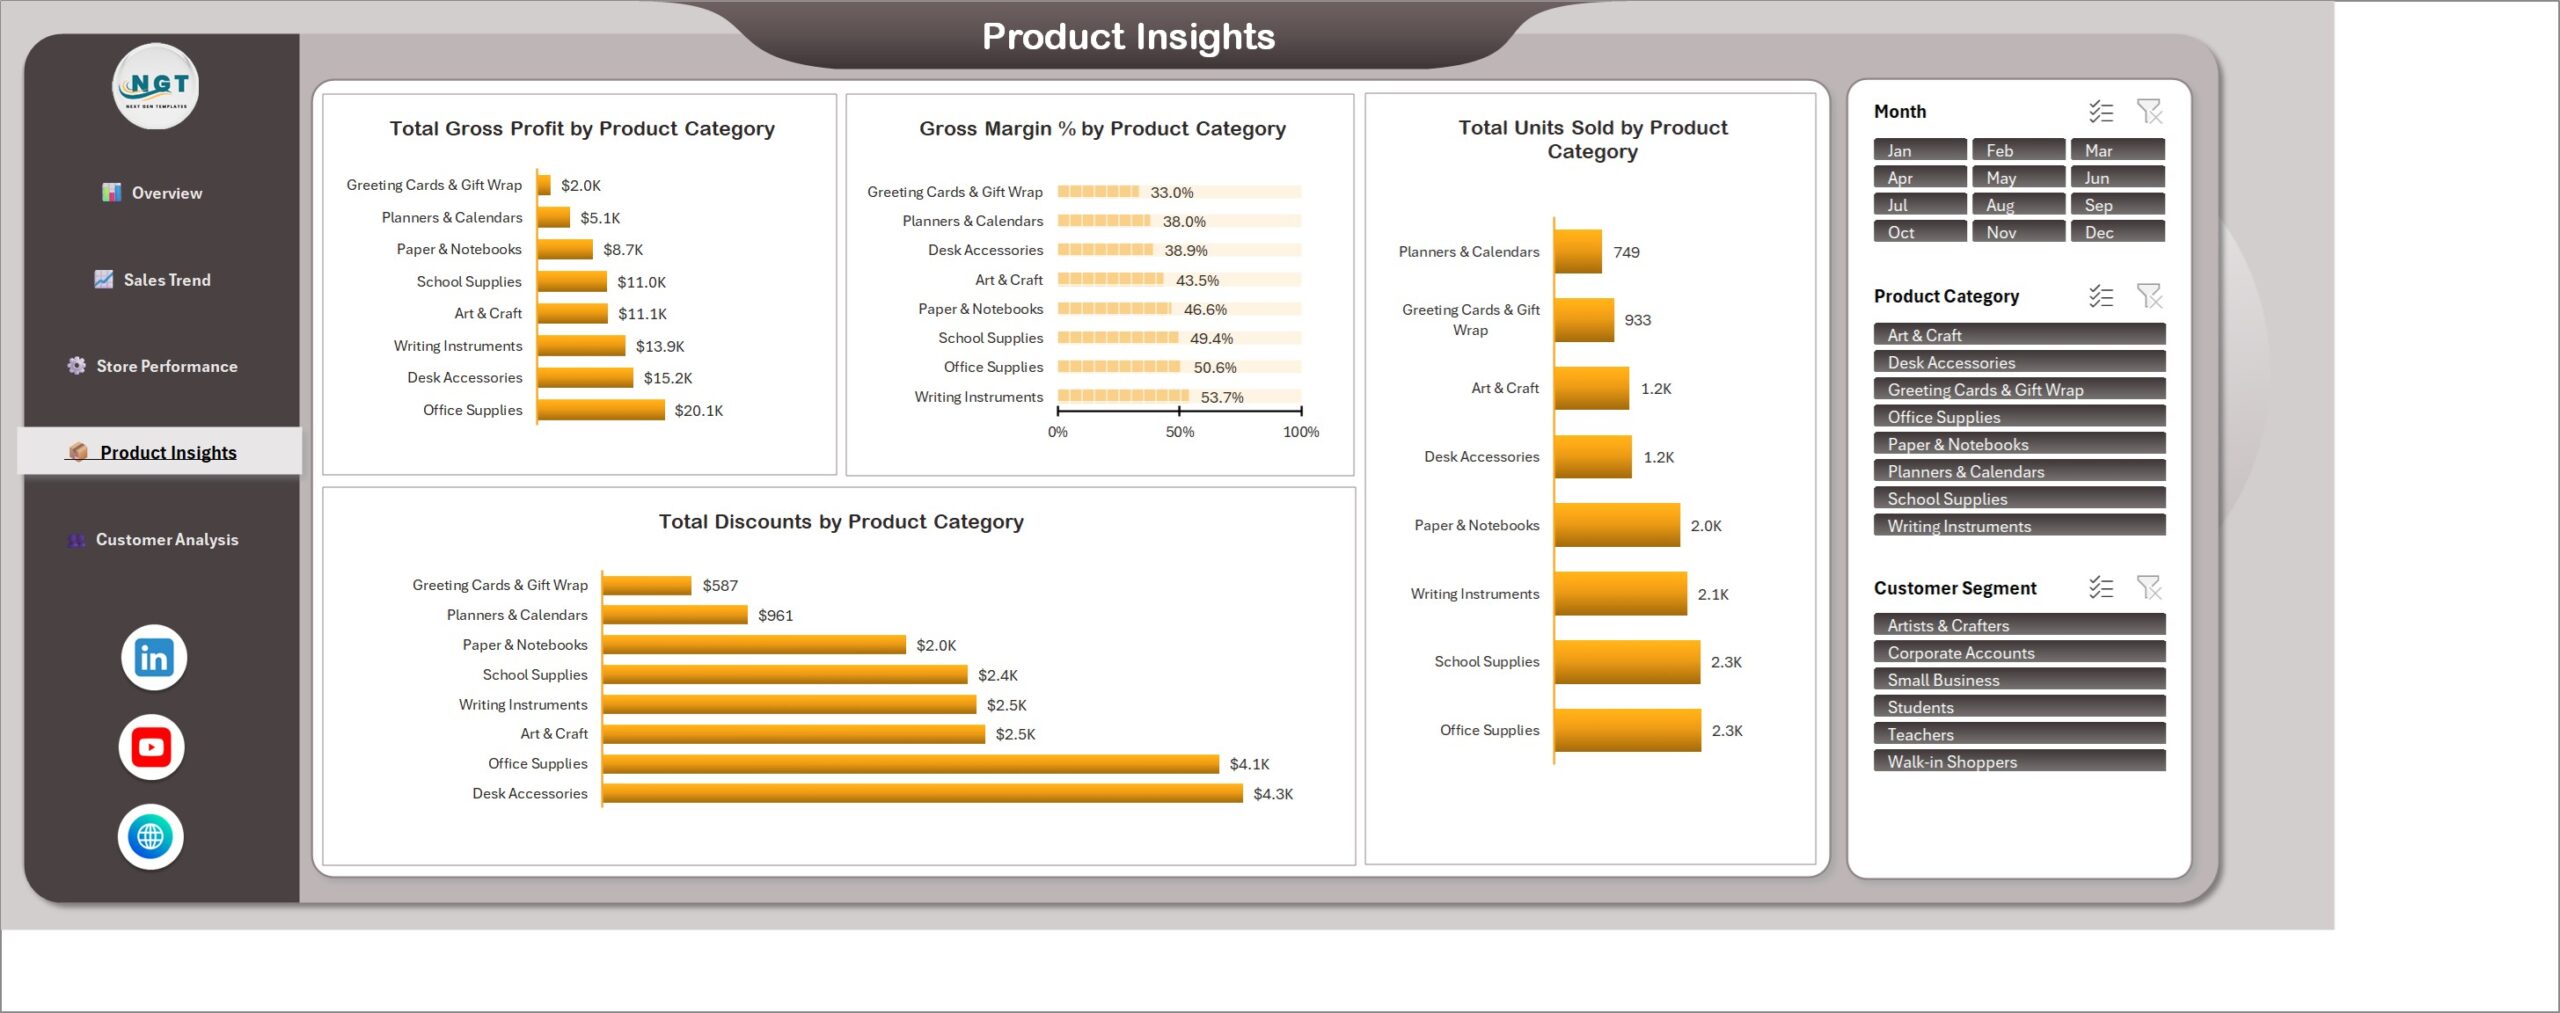
See Total Gross Profit, Gross Margin %, Total Units Sold and Total Discounts by Product Category, from Writing Instruments and Office Supplies to Planners & Calendars and Greeting Cards & Gift Wrap.
Customer Analysis
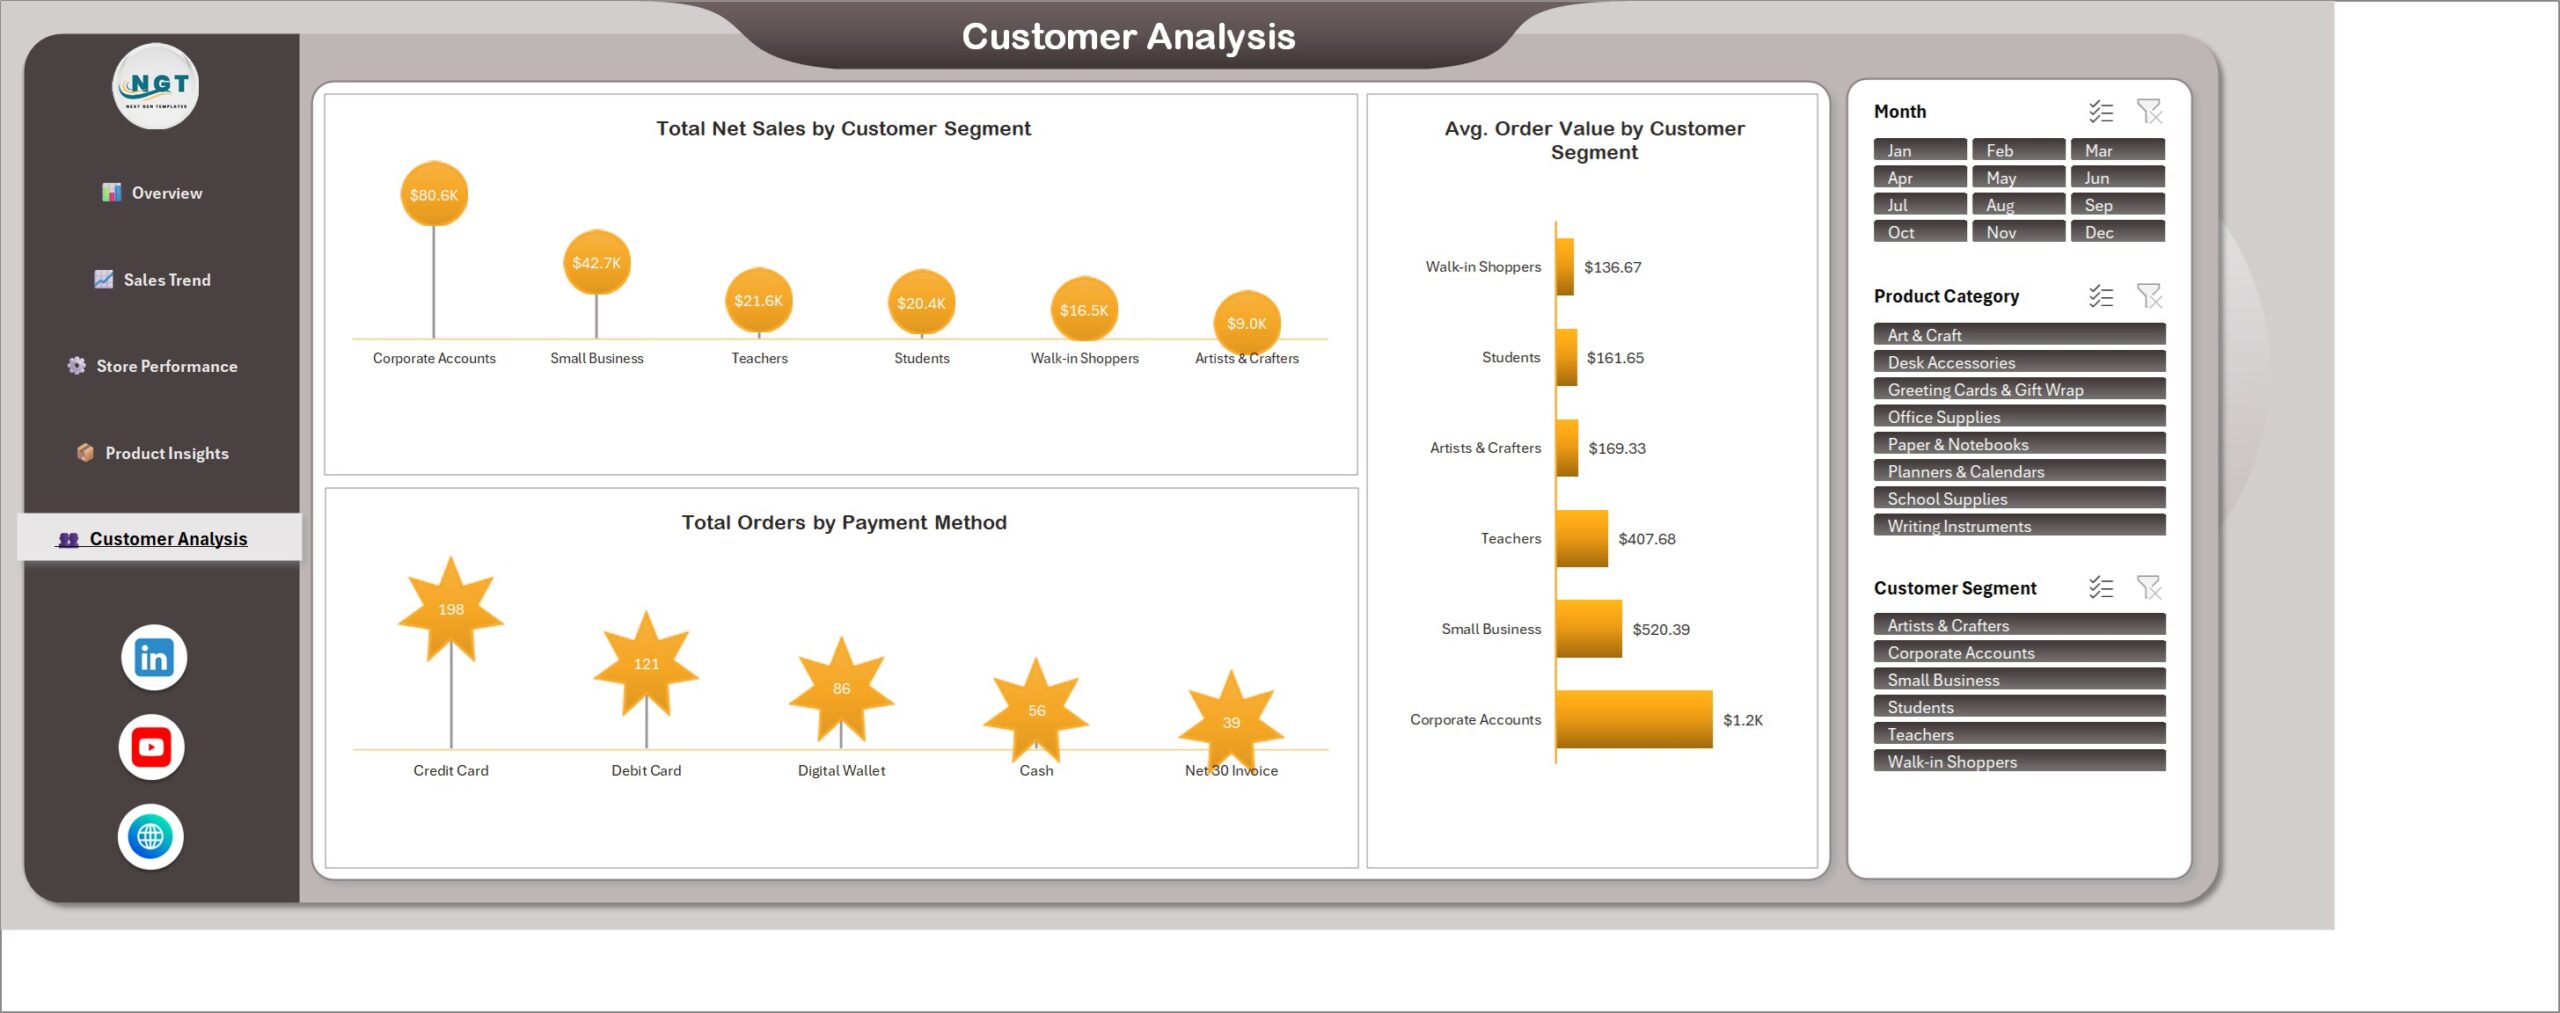
Review Total Net Sales by Customer Segment, Avg. Order Value by Customer Segment and Total Orders by Payment Method for six example segments, including Corporate Accounts, Small Business, Teachers, Students, Walk-in Shoppers and Artists & Crafters.
Excel Dashboard vs. POS Software vs. Power BI – Where This Fits
| Consideration | This Excel dashboard | POS or retail software | Power BI report |
|---|---|---|---|
| Cost model | One-time template | Usually a monthly subscription | Desktop file plus licensing where needed |
| Best for | Reviewing sales and profit from your own order data | Billing, stock and daily operations | Larger connected data models |
| Works offline in desktop Excel | Yes | Varies | Desktop analysis |
| Interactive filters | Excel slicers | Vendor-dependent | Report slicers |
| Live POS connection | Not included | Often included | Needs set-up |
| Billing and stock control | Not included | Included | Not included |
Who This Template Is For – and Who It’s Not For
It suits owners and managers of stationery shops and small chains, office supply retailers, retail analysts and consultants who already export orders from a till, spreadsheet or online store. It is an analysis dashboard: you add your own sales data and refresh. It is not a POS system, an invoicing tool or a stock-control application, and it does not connect to a POS automatically.
How to Use This Excel Dashboard
- Download and unzip the package.
- Open the workbook in desktop Microsoft Excel and keep an untouched backup of the sample file.
- Paste your own orders into the Data sheet using the existing columns.
- Click Data, then Refresh All, so the pivot tables and charts update.
- Use the Month, Product Category and Customer Segment slicers to filter every page.
- Check totals against your source records before you use the results in a decision.
Real-World Use Cases
A store owner can compare net sales, gross profit and return rate across locations. A buyer can see which product categories carry the best margin and where discounts are heaviest. An account manager can review how Corporate Accounts and Small Business customers compare with walk-in shoppers. A consultant can prepare a clear monthly sales review for a retail client.
A monthly review can start on Overview, move to Sales Trend for timing, then use Store Performance, Product Insights and Customer Analysis to find the drivers. Note the active slicer selections whenever you share a screenshot, so readers know which subset produced the totals. Keep store, category and segment names consistent in the Data sheet before refreshing, otherwise one category can split into several chart entries.
Frequently Asked Questions
Is this a sales dashboard Excel template I can use with my own data?
Yes. Paste your orders into the Data sheet using the existing columns, click Refresh All and every page updates.
Does it need macros or add-ins?
No. It is a standard .xlsx file built with pivot tables, pivot charts and slicers. Use it in desktop Excel.
Which slicers are included?
Month, Product Category and Customer Segment. They are connected to all five pages.
Does it connect to my POS or handle billing and stock?
No. It analyses sales data you add. It does not connect to a POS system and it does not handle billing or stock control.
Is the sample data real?
No. The 500 orders, store names and figures are fictional and exist only to show how the dashboard works.
Is a user manual included?
Yes. The ZIP contains the Excel workbook and the Excel Dashboard User Manual PDF.
Is there a subscription?
No. It is a one-time payment.
About the Author
Built by PK – Microsoft Certified Professional with 15+ years of Excel, Google Sheets, and Power BI experience. Founder of NextGenTemplates, reaching 300K+ subscribers across YouTube channels. Every template is hand-built and tested before release.
Explore Related Templates
Compare the Retail Dashboard in Excel, Department Stores Dashboard in Excel and Baby Products Retail Dashboard in Excel. For daily stock entry, see the Stationery Shop Stock Data Entry System in Excel. Browse more Excel dashboards. Microsoft explains how to use slicers to filter data.
See which stores, categories and customers drive your stationery profit. Download the dashboard, replace the sample orders, refresh and review the five pages.
Last updated: October 8, 2026.






























Reviews
There are no reviews yet.