

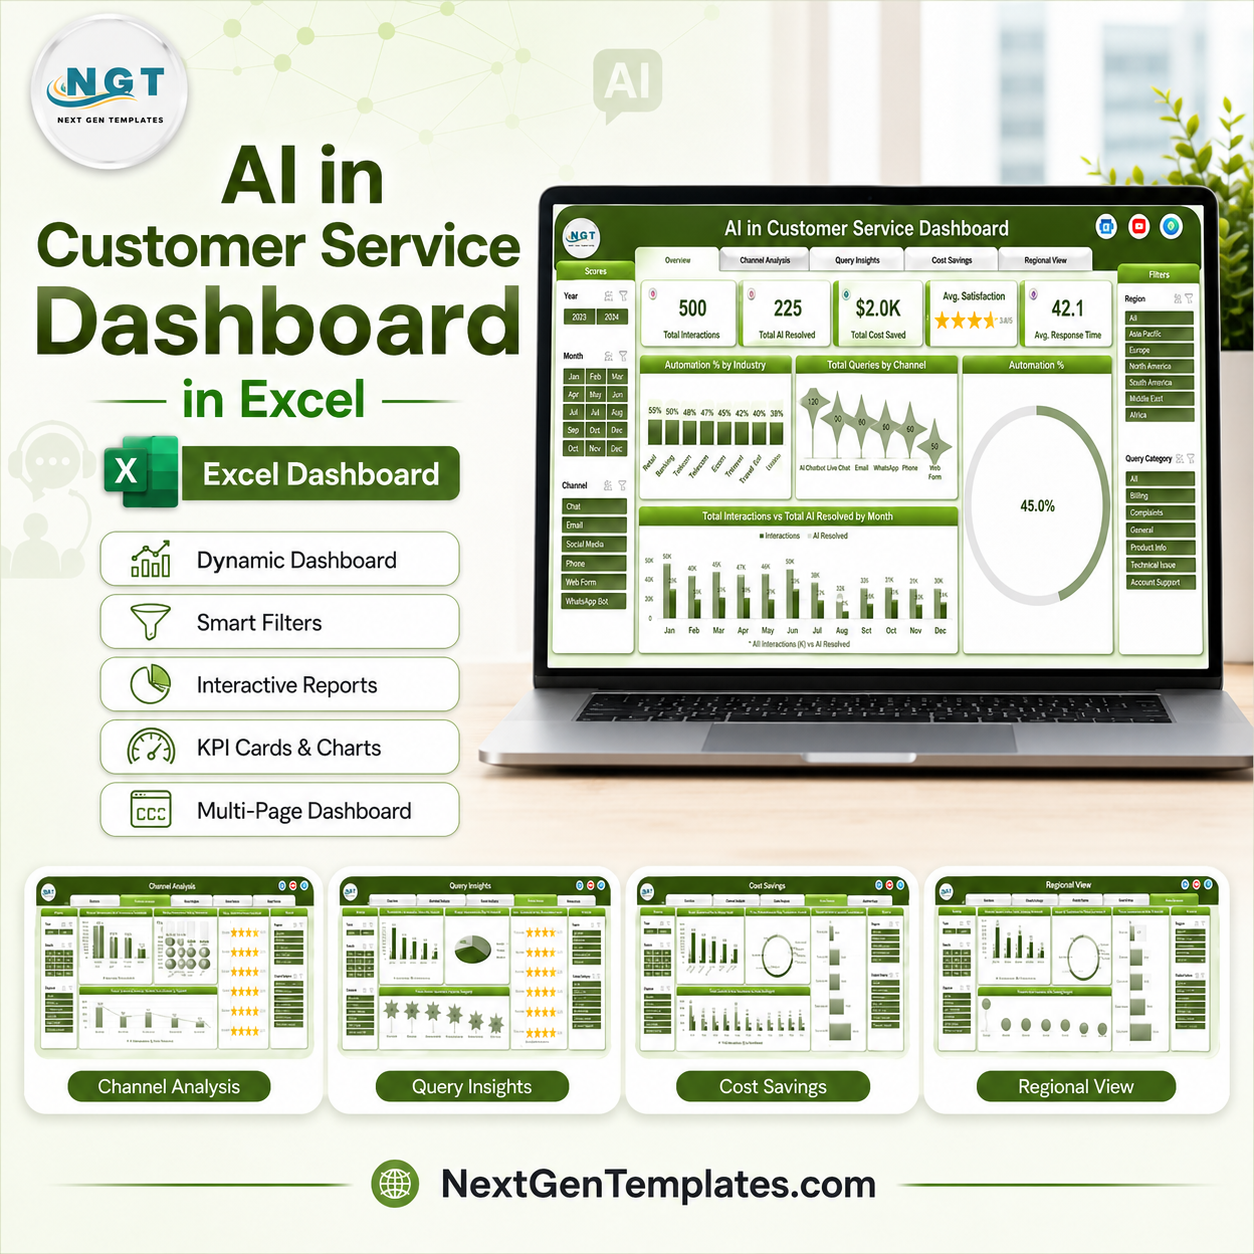
Every support team that has deployed a chatbot faces the same board question: is it actually working? Deflection numbers from a vendor console rarely answer it, because they count contacts the bot touched rather than contacts it closed – and they never net the saving against what the AI itself costs to run. The AI in Customer Service Dashboard in Excel is built to answer it properly: 5 dashboard pages, 20 charts, page-synced slicers on Year, Month, Channel, Region and Query Category, and a sample dataset of 500 interactions across 6 AI channels, 5 AI platforms, 8 industries, 7 languages and 5 regions. Automation rate, escalation rate, cost saved against handling cost, satisfaction by sentiment – each one a chart rather than a claim. Built by PK, a Microsoft Certified Professional with 15+ years in Excel and Power BI and 300K+ subscribers across two YouTube channels. Download, unzip, open in Excel, paste your own export over the sample data, and every page follows. No macros, no add-in, no subscription.
Key Features of the AI in Customer Service Dashboard in Excel
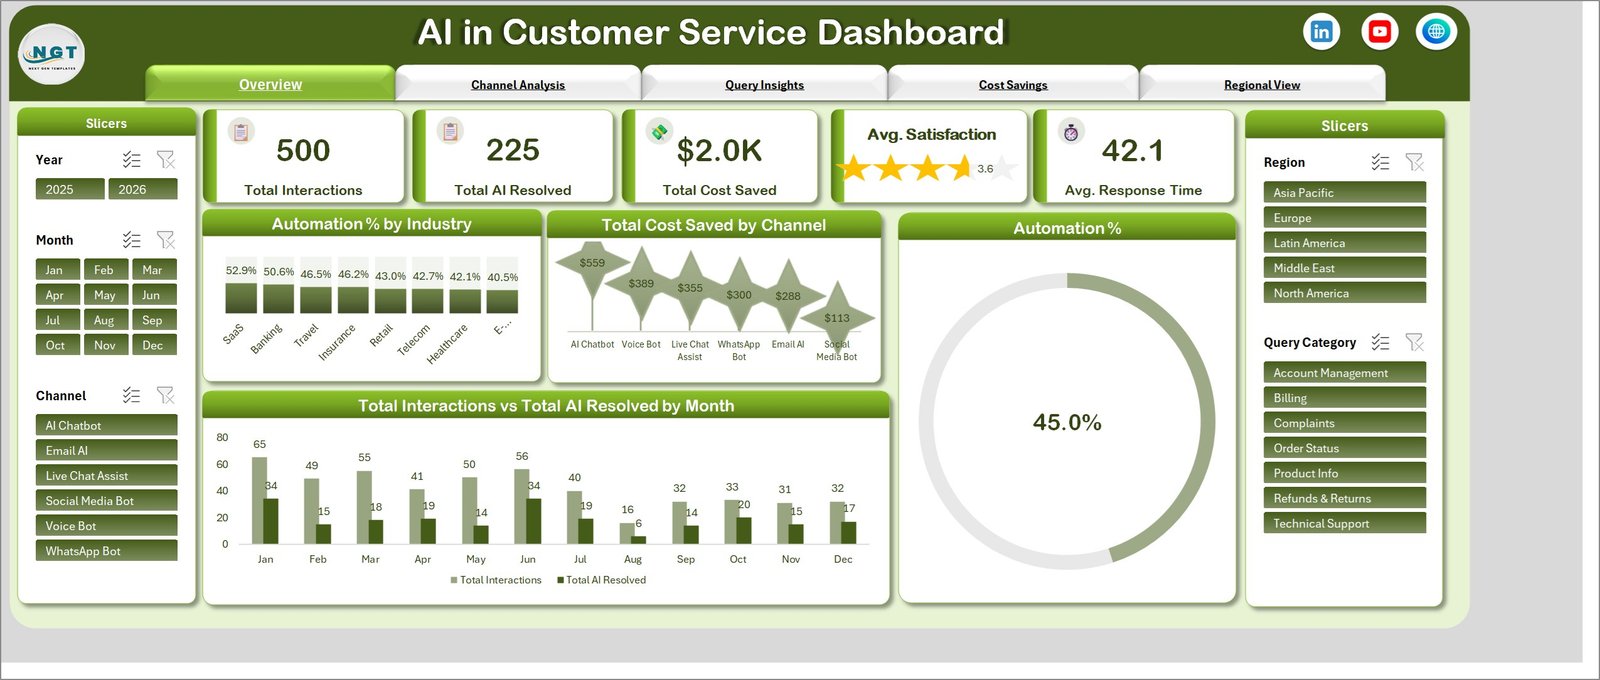
- Automation rate as the headline. A single donut shows what share of interactions AI resolved end to end, backed by Total Interactions and Total AI Resolved as separate KPI cards – so the number cannot be inflated by counting touches.
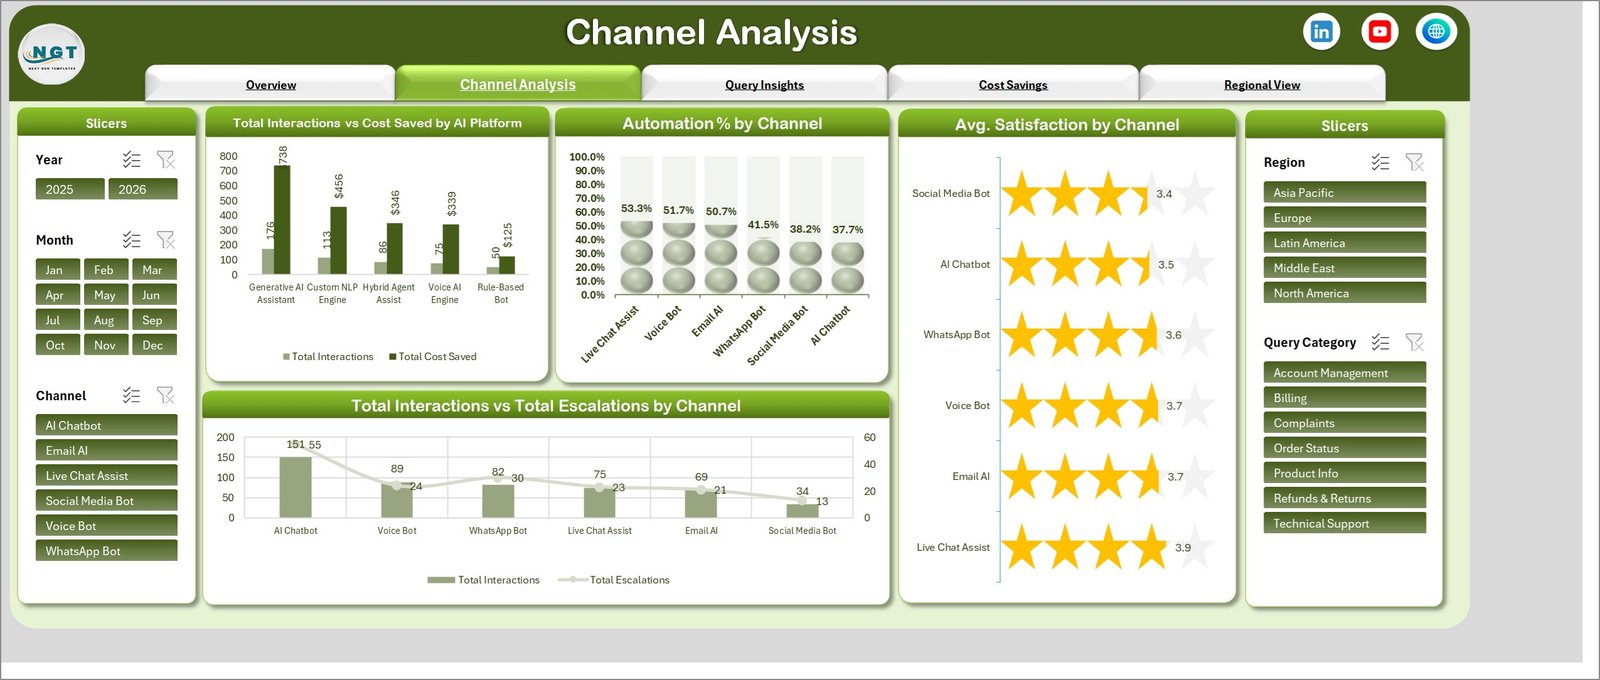
- Escalation tracking by channel. Total Interactions vs Total Escalations puts the handover count beside the volume for every channel. A bot with high traffic and high escalation is costing you twice, and this is the chart that shows it.
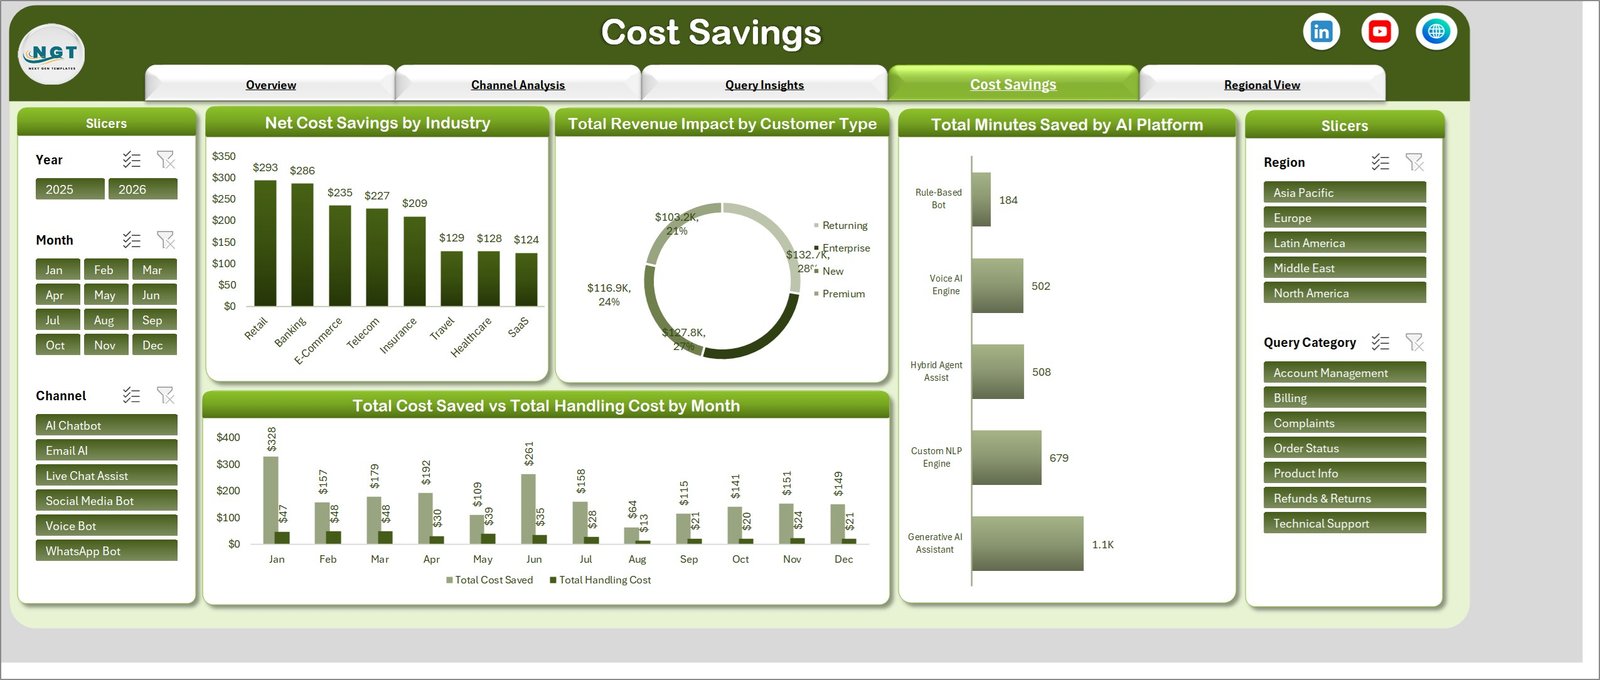
- Net cost saving, not gross. Total Cost Saved vs Total Handling Cost by Month runs the two series side by side across twelve months, so the saving you report is the one that survives the AI’s own running cost.
- Five AI platforms compared. Generative AI Assistant, Custom NLP Engine, Hybrid Agent Assist, Voice AI Engine and Rule-Based Bot, ranked on interactions, cost saved and minutes saved – the comparison to make before renewing a licence.
- Six channels compared. AI Chatbot, Voice Bot, WhatsApp Bot, Live Chat Assist, Email AI and Social Media Bot, each with automation rate, cost saved, satisfaction and escalation count.
- Satisfaction where it belongs. Star-rated satisfaction by channel, plus Avg Satisfaction by Sentiment split across positive, neutral and negative – because an automation rate without a satisfaction figure beside it is half a story.
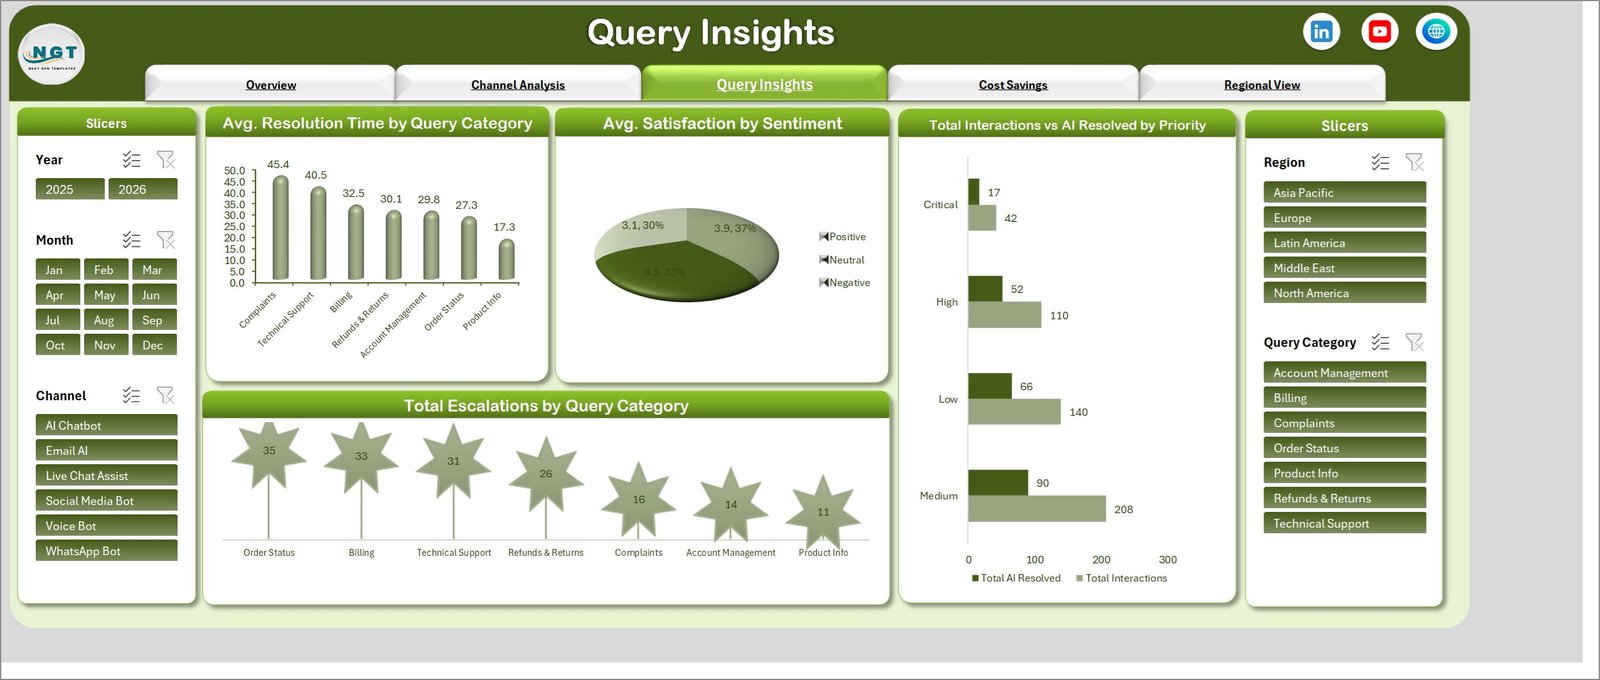
- Query category analysis. Average resolution time and escalation counts across Account Management, Billing, Complaints, Order Status, Product Info, Refunds & Returns and Technical Support, so you can see which query types the bot should never have been given.
- Priority breakdown. Total Interactions vs AI Resolved across Critical, High, Medium and Low, which is how you confirm the AI is handling volume rather than urgency.
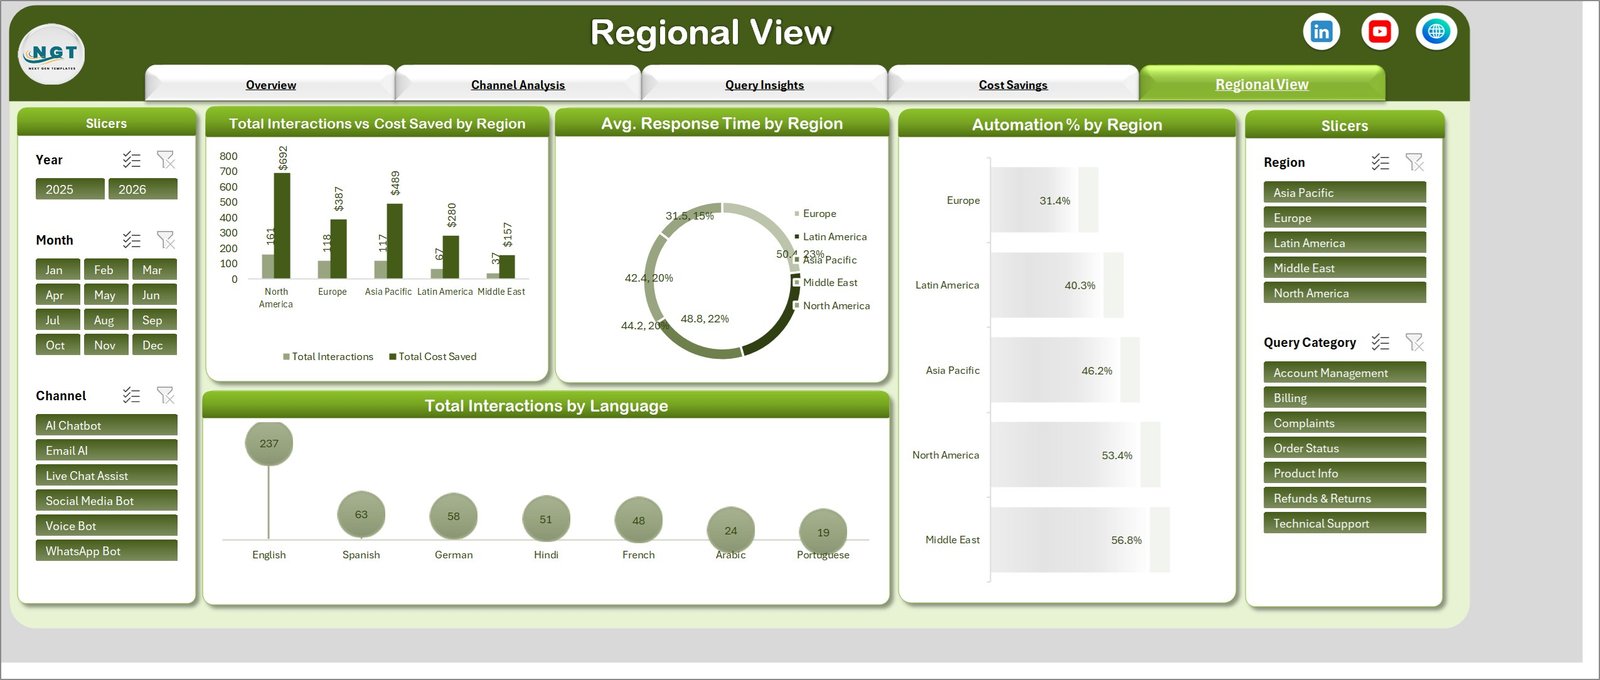
- Regional and language view. Five regions on interactions, cost saved, response time and automation rate, plus interaction volume across seven languages – the page that tells a global support team where the model is weakest.
- Industry benchmarking. Automation % and Net Cost Savings across SaaS, Banking, Travel, Insurance, Retail, Telecom, Healthcare and E-Commerce.
- Page-synced slicers. Year, Month and Channel on the left; Region and Query Category on the right. Every page carries the same set, so a filter means the same thing wherever you are.
What’s Inside the AI in Customer Service Dashboard
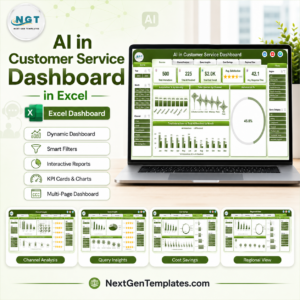
Five dashboard pages behind a navigation strip, plus the data and support sheets that feed themAI in Customer Service Dashboard in Excel
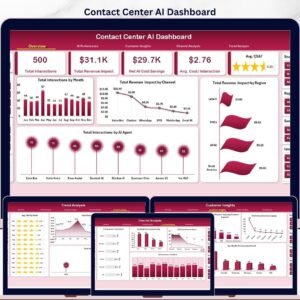
1. Overview. Total Interactions, Total AI Resolved, Total Cost Saved, Avg Satisfaction and Avg Response Time as KPI cards, with Automation % by Industry, Total Cost Saved by Channel, an overall Automation % donut and Total Interactions vs Total AI Resolved by Month.
2. Channel Analysis. Total Interactions vs Cost Saved by AI Platform, Automation % by Channel, Avg Satisfaction by Channel as star ratings, and Total Interactions vs Total Escalations by Channel. This is the page for deciding which channel gets the next investment.
3. Query Insights. Avg Resolution Time by Query Category, Avg Satisfaction by Sentiment, Total Interactions vs AI Resolved by Priority, and Total Escalations by Query Category. Complaints and Technical Support consistently take the longest to resolve in the sample data – which is exactly the pattern most teams find in their own.
4. Cost Savings. Net Cost Savings by Industry, Total Revenue Impact by Customer Type across new, returning, premium and enterprise, Total Minutes Saved by AI Platform, and Total Cost Saved vs Total Handling Cost by Month.
5. Regional View. Total Interactions vs Cost Saved by Region, Avg Response Time by Region, Automation % by Region, and Total Interactions by Language.
Behind the pages sit the data sheet holding one row per interaction and a support sheet carrying the pivot tables the charts read. Replace the sample rows with your own export, keep the headers, refresh, and all five pages update together.
AI in Customer Service Dashboard vs. a Google Sheets Build vs. a Helpdesk Analytics Add-On – Where This Fits
| This Excel dashboard | A Google Sheets build | Helpdesk / CX analytics add-on | |
|---|---|---|---|
| Cost | 17.99 once | Free, plus your build time | Often 200+ per month on top of the helpdesk |
| Platform | Microsoft Excel, desktop | Google Sheets, any browser | Vendor web app |
| Setup time | Under 30 minutes with your export | 2 to 4 days for five pages | Days, plus connector configuration |
| Real-time team collaboration | Through OneDrive co-authoring | Yes, native sharing | Per paid seat |
| Mobile access | Limited | Yes, free Sheets app | Yes |
| Customizable metrics | Yes – every pivot and chart is editable | Yes, if you build them | No, fixed report set |
| Combines several AI vendors in one view | Yes – it reads a data sheet, not an API | Yes | Rarely – usually one vendor’s data |
| Nets AI cost against saving | Yes, per month | Build it yourself | Sometimes, if licensing data is loaded |
| Works offline | Yes | No | No |
| Year-1 cost for a support team | 17.99 | 0 plus several days of work | 2,400 and up |
The honest position: your helpdesk knows what happened five minutes ago and this workbook does not – it reports on an export. It earns its place when you run more than one AI vendor, when finance wants the saving netted against licence and handling cost, or when the board wants a single monthly page that does not depend on a vendor login.
Who This Template Is For – and Who It’s Not For
A good fit if you are: a customer service or CX manager who has deployed AI and has to report on it; a support operations lead comparing chatbot, voice and messaging channels; a finance business partner asked to verify a claimed automation saving; a BPO or outsourcer reporting AI performance to a client; a consultant building an AI-in-support business case with real numbers AI in Customer Service Dashboard in Excel
Not the right tool if you are: looking for live monitoring – this is a monthly or weekly reporting workbook, not a real-time console; running a helpdesk that already produces analytics you trust, where a second view adds work rather than insight; or handling fewer than a hundred interactions a month, where the pattern will not be visible in any chart AI in Customer Service Dashboard in Excel
How to Use the AI in Customer Service Dashboard
- Unzip the download and open the workbook in Microsoft Excel. Nothing to install and no macros to enable.
- Look at the sample data first. Five pages of a working year show you what each chart is meant to say before you replace anything.
- Export your interactions from your helpdesk or AI platform and paste them onto the data sheet, keeping the existing column headers so the pivots and charts stay connected.
- Refresh all (Data, then Refresh All) so every pivot picks up the new rows.
- Check the Overview page. Total interactions and total AI resolved will tell you within seconds whether the import landed correctly.
- Read escalations before automation. A high automation rate with a high escalation count is a bot that is closing tickets the customer then reopens – the Channel Analysis page separates the two.
- Use the slicers to compare like with like. Filter to one region or one query category and every chart on the page moves together.
- Report the net saving. Total Cost Saved vs Total Handling Cost is the pair to put in front of finance, not the cost-saved figure on its own.
Real-World Use Cases
Deciding whether to renew an AI licence. Total Interactions vs Cost Saved by AI Platform showed the Generative AI Assistant carrying by far the most interactions and the most saving, while a legacy rule-based bot handled a small volume at a low rate. The renewal conversation became about consolidating onto one platform rather than paying for both AI in Customer Service Dashboard in Excel
Finding where automation is failing. The AI Chatbot channel led on volume but also led on escalations by a wide margin. Cross-referencing Total Escalations by Query Category showed Order Status and Billing driving most of it – two categories with clear data dependencies the bot could not reach. The fix was an integration, not a better model AI in Customer Service Dashboard in Excel
Reporting a saving finance will accept. A gross cost-saved figure looks impressive until someone asks what the AI cost to run. Because handling cost sits beside the saving month by month, the CX lead could present a net number and keep it.
Frequently Asked Questions
Which version of Excel do I need?
Excel 2016 or later on Windows, or Microsoft 365. The workbook uses ordinary pivot tables, charts and slicers – nothing that needs a newer function set AI in Customer Service Dashboard in Excel
Are there macros?
No. It is a plain .xlsx workbook, so there is no macro warning, no security prompt and nothing for a corporate policy to block.
Does it connect to my helpdesk or chatbot platform?
No, and that is deliberate. You export interactions and paste them onto the data sheet, which means it works with any helpdesk, any AI vendor, and several of them at once.
Can I add my own channels, platforms or query categories?
Yes. They are values in your data, not hard-coded lists. Paste in your rows, refresh the pivots, and the charts and slicers pick up whatever names you use AI in Customer Service Dashboard in Excel
How is automation rate calculated?
Total AI Resolved divided by Total Interactions – contacts closed by AI without a human, not contacts the bot merely touched. Escalations are tracked separately so a handover is never counted as a resolution.
Can I use it in Google Sheets?
Uploading it to Sheets will convert the data but the slicer and chart formatting will not survive intact. It is built for Excel; use one of our Google Sheets dashboards if Sheets is where your team works.
Can I change the colours to match my brand?
Yes. The workbook uses standard Excel chart formatting and a single accent colour, so a theme change takes a few minutes rather than a rebuild.
About the Author
Built by PK – Microsoft Certified Professional with 15+ years of Excel, Google Sheets, and Power BI experience. Founder of NextGenTemplates, reaching 300K+ subscribers across YouTube channels. Every template is hand-built and tested before release.
Explore Related Templates
- AI Chatbot Providers Dashboard in Excel – vendor-side comparison rather than your own operation.
- AI Chatbot Providers Dashboard in Power BI – the same questions with drillthrough.
- Sentiment Analysis Startups Dashboard in Power BI – a deeper look at sentiment data.
- SaaS Development Dashboard in Excel – for the product side of the same business.
- IT Manager & CISO Toolkit – ten templates for the wider technology function.
- Browse every Excel dashboard or the full MS Excel template catalogue. AI in Customer Service Dashboard in Excel
Get Your Copy
Export last quarter’s interactions, paste them in, and look at escalations by channel first. Most teams discover the bot is doing well on volume and badly on exactly the two query types that generate complaints. If anything does not work as described, contact us and we will put it right AI in Customer Service Dashboard in Excel
Last updated: 12 August 2026.























Reviews
There are no reviews yet.