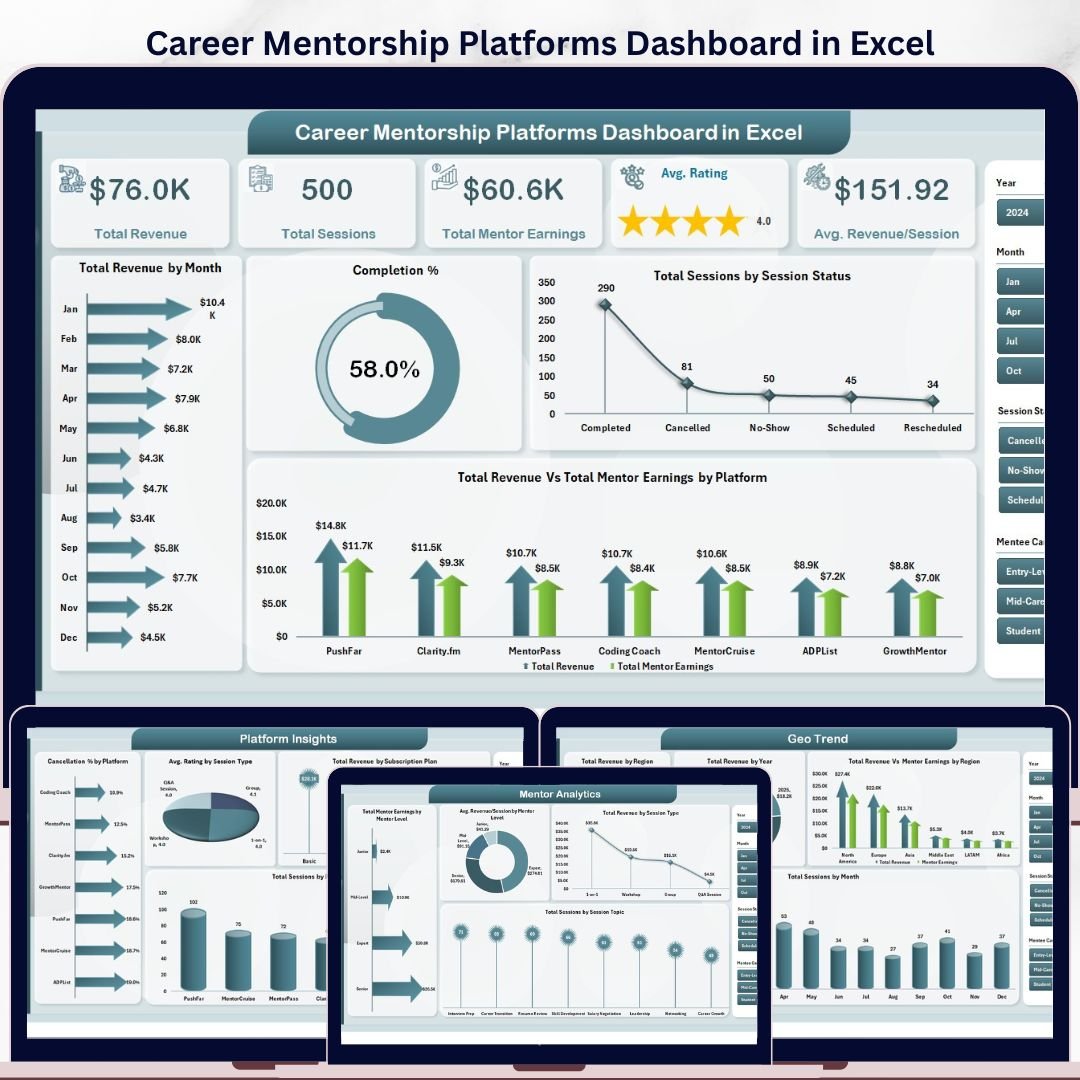


The Career Mentorship Platforms Dashboard in Excel tracks 5 core KPIs across 5 interactive analytical pages, with 16 pre-built charts and multi-slicer filters. Setup takes under 10 minutes — just replace the sample data and every chart updates automatically through pivot-driven calculations.
🌍 Join 8,400+ teams in 40+ countries using NextGenTemplates to replace paid SaaS tools with one-time-purchase Excel, Google Sheets, Power BI, and HTML templates.
✅ Instant download · One-time payment · No subscription · No per-user fees · Lifetime access
🔑 Key Features of Career Mentorship Platforms Dashboard in Excel
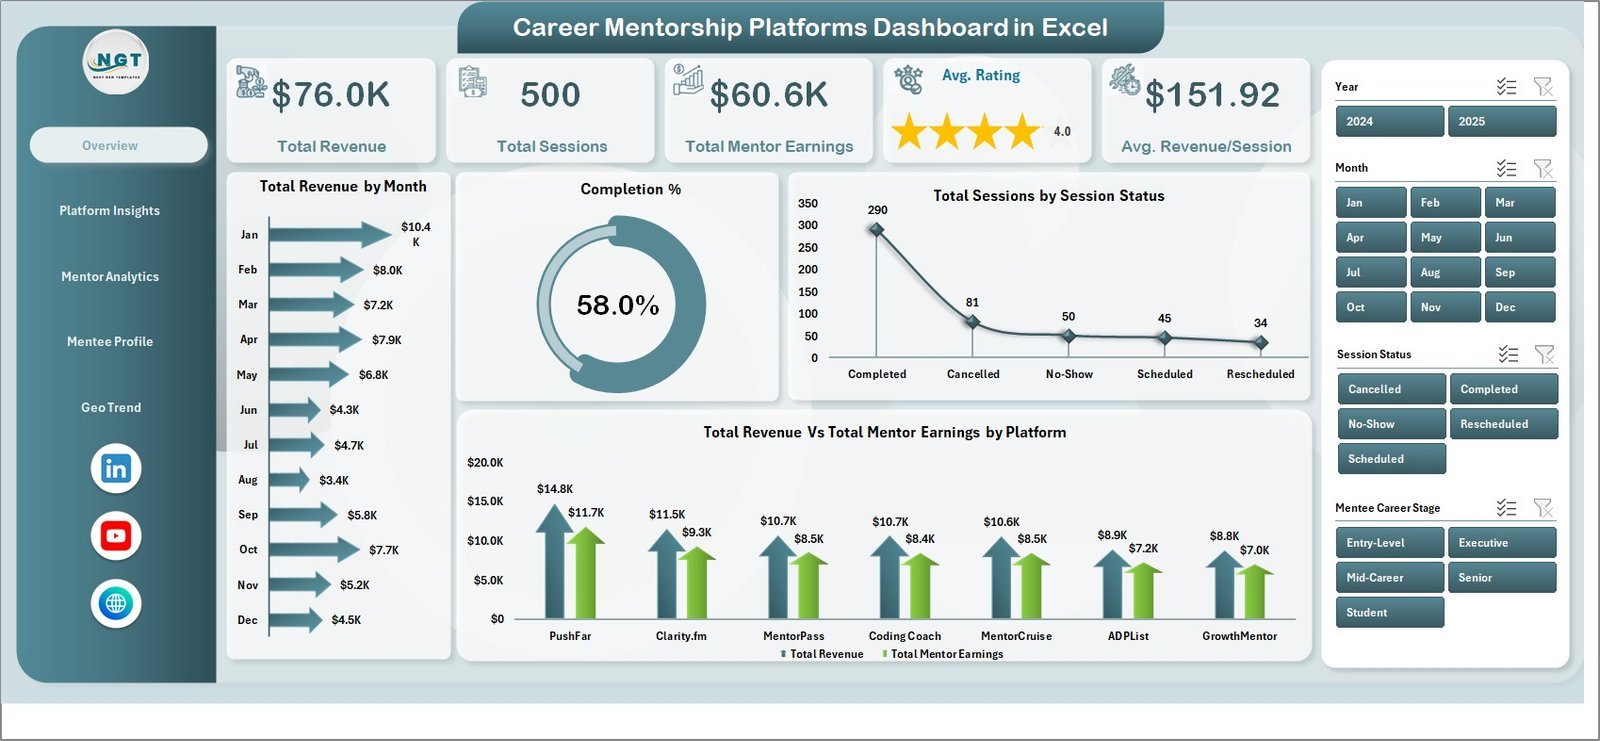
📊 5 KPI Cards on the Overview Page — Track Total Revenue, Total Sessions, Total Mentor Earnings, Average Rating, and Average Revenue per Session in one high-level snapshot updated automatically from the data sheet.
📈 16 Pre-Built Pivot Charts — Charts include Total Revenue by Month, Completion %, Sessions by Status, Revenue vs. Mentor Earnings by Platform, Cancellation % by Platform, Avg. Rating by Session Type, and more. This dashboard tracks 8+ chart-level dimensions across mentorship data.
🔄 Pivot-Driven Auto-Refresh — All charts and KPIs are powered by pivot tables on a dedicated Support Sheet. After updating your data, simply go to Data → Refresh All to update every visual instantly — no formulas to edit manually.
🗂️ 5 Analytical Pages + Data Sheet + Support Sheet — Covers Overview, Platform Insights, Mentor Analytics, Mentee Profile, and Geo Trend. A structured Data Sheet accepts new session records, and a Support Sheet holds all pivot logic hidden in the background.
🌐 Multi-Dimensional Slicers — Apply filters by Platform, Session Type, Subscription Plan, Mentor Level, Region, and more to drill into exactly the segment you need without touching any formulas.
💡 Career-Stage and Industry Segmentation — Analyze sessions and goal scores by Mentee Career Stage and Industry, helping platform operators understand which segments generate the most engagement and revenue.
📦 Zero Dependency on Add-ins — Works in any version of Microsoft Excel (2016 and above). No Power Query, no macros, no external dependencies. Just open and use.
📦 What’s Inside the Career Mentorship Platforms Dashboard in Excel
Page 1: Overview Page
This page displays 5 high-level KPI cards — Total Revenue, Total Sessions, Total Mentor Earnings, Avg. Rating, and Avg. Revenue/Session — along with 4 charts: Total Revenue by Month, Completion %, Total Sessions by Session Status, and Total Revenue vs. Total Mentor Earnings by Platform. Interactive slicers let you filter the entire page instantly.

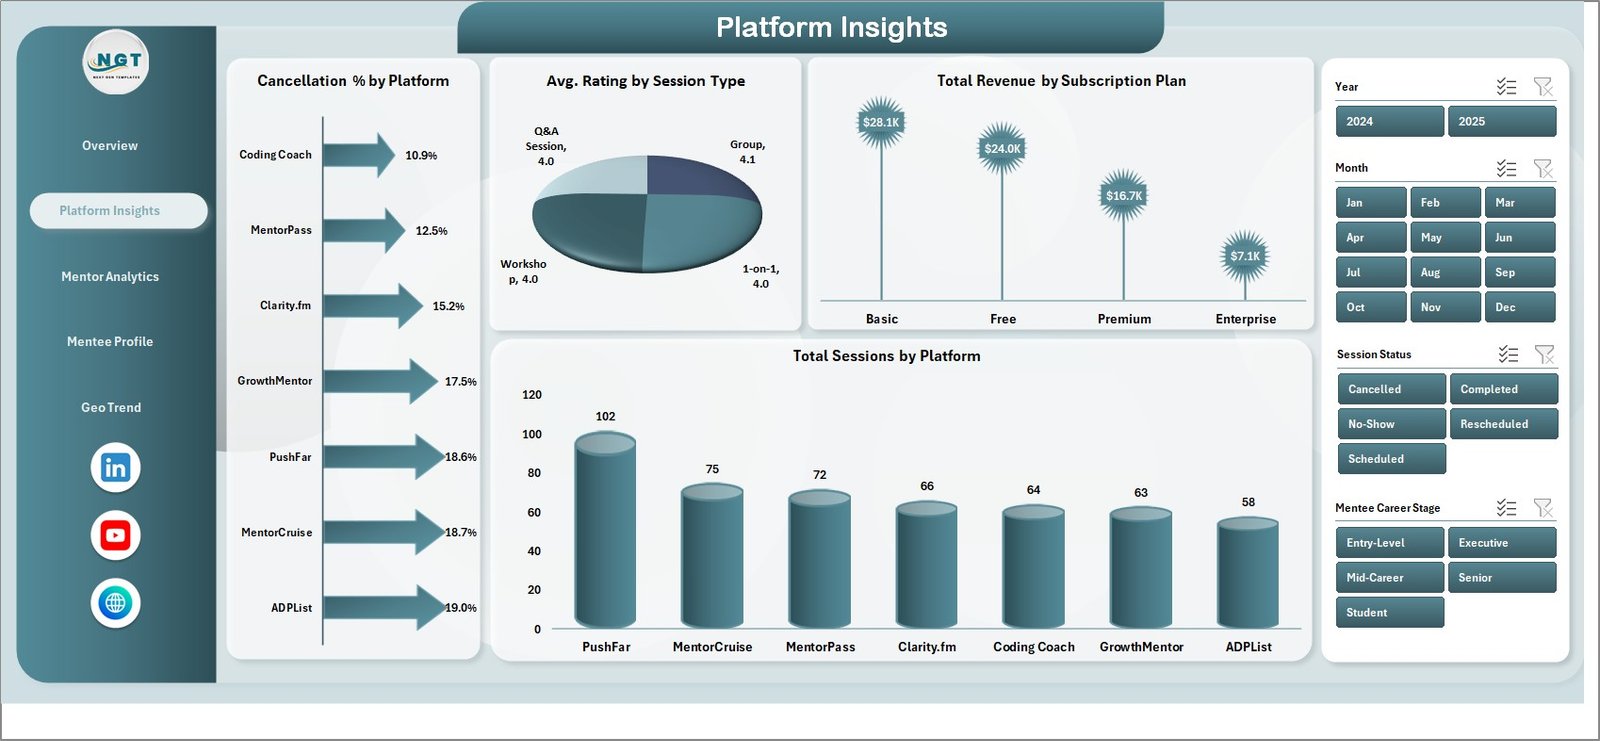
Page 2: Platform Insights
This page analyzes performance at the platform level with 4 charts: Cancellation % by Platform, Avg. Rating by Session Type, Total Revenue by Subscription Plan, and Total Sessions by Platform. Use this page to compare how different mentorship platforms perform across key service metrics.
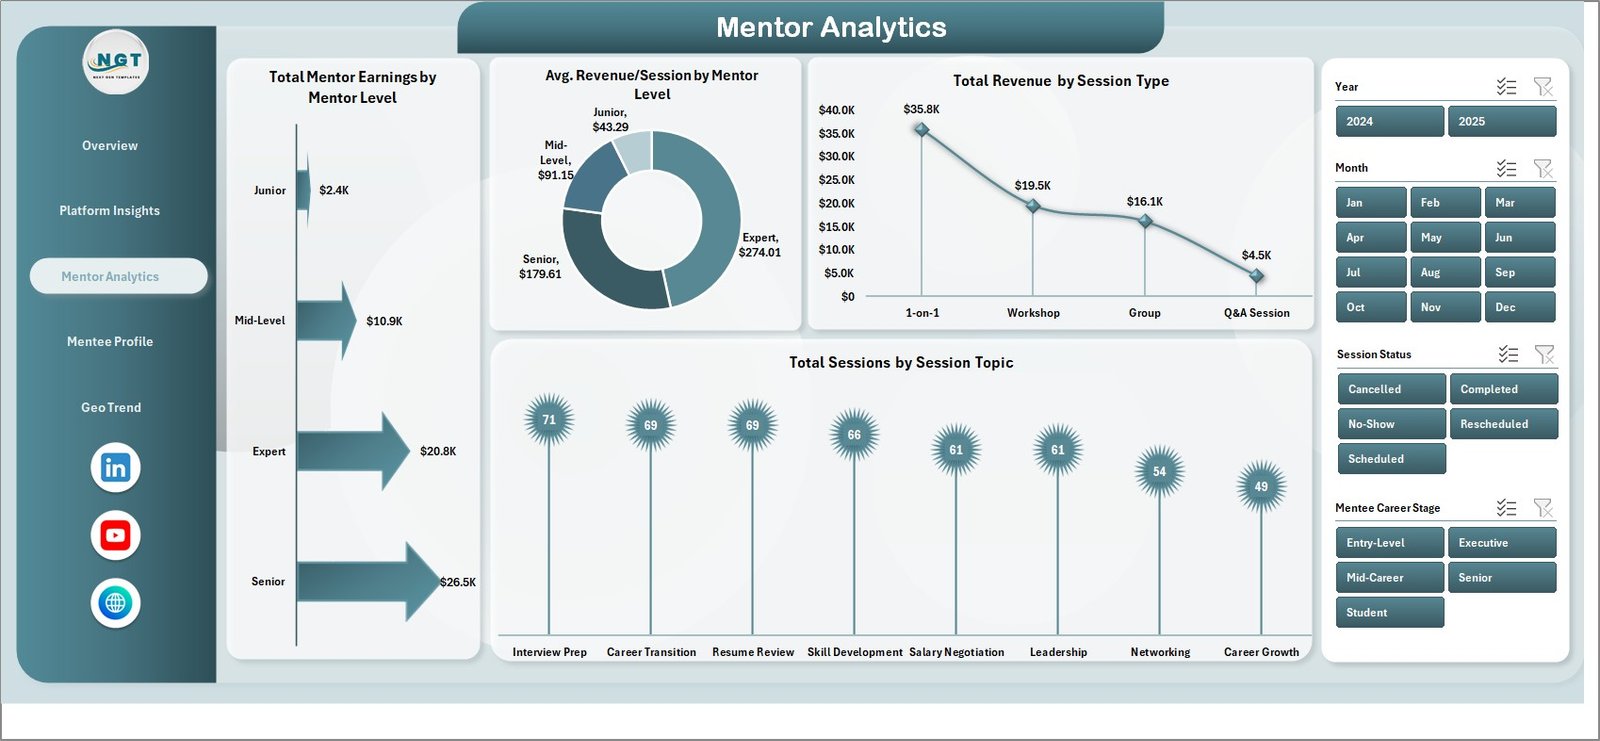
Page 3: Mentor Analytics
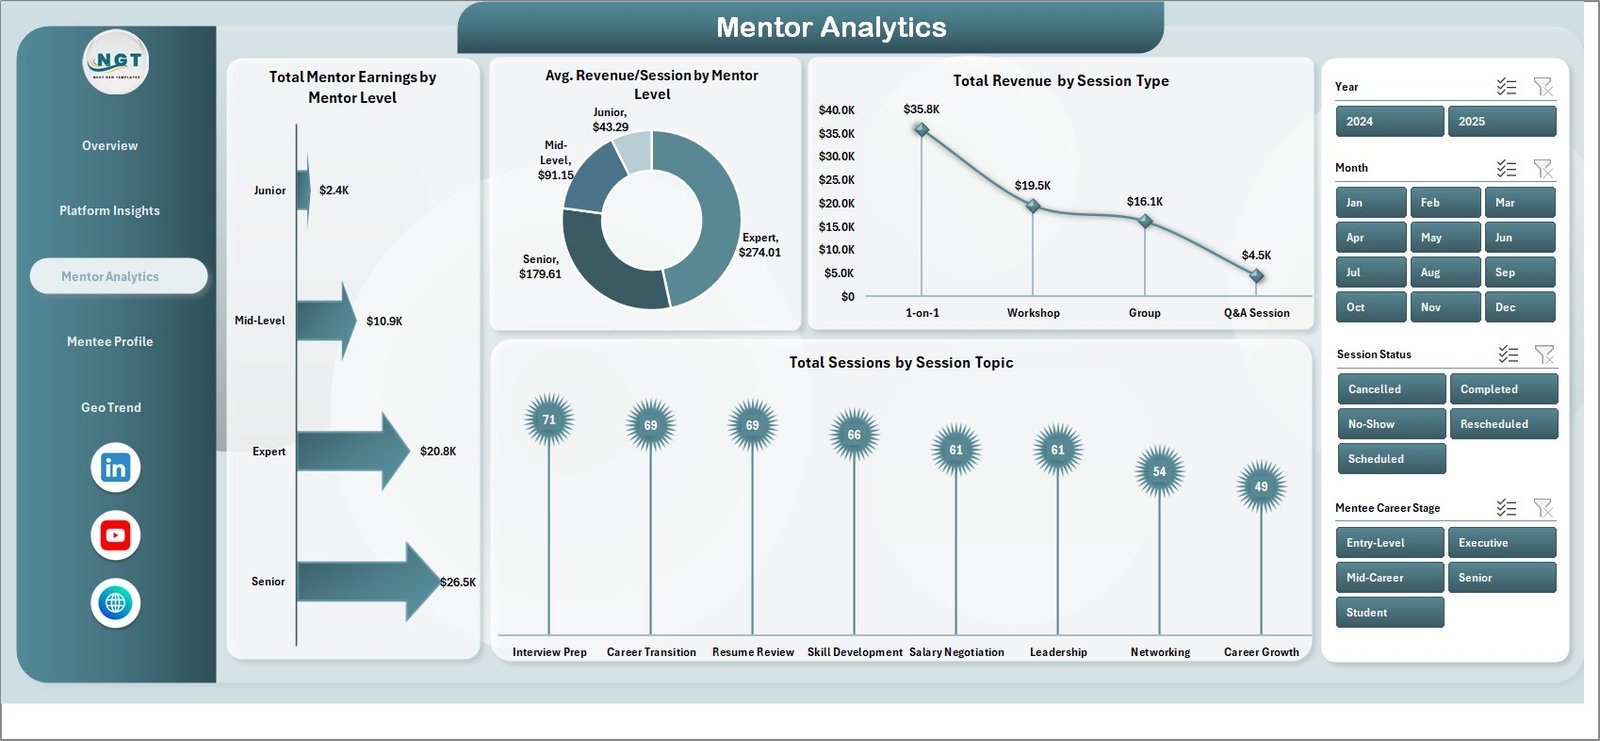
This page breaks down mentor-level performance through 4 charts: Total Mentor Earnings by Mentor Level, Avg. Revenue/Session by Mentor Level, Total Revenue by Session Type, and Total Sessions by Session Topic. Identify which mentor levels and session topics drive the highest revenue.
Page 4: Mentee Profile
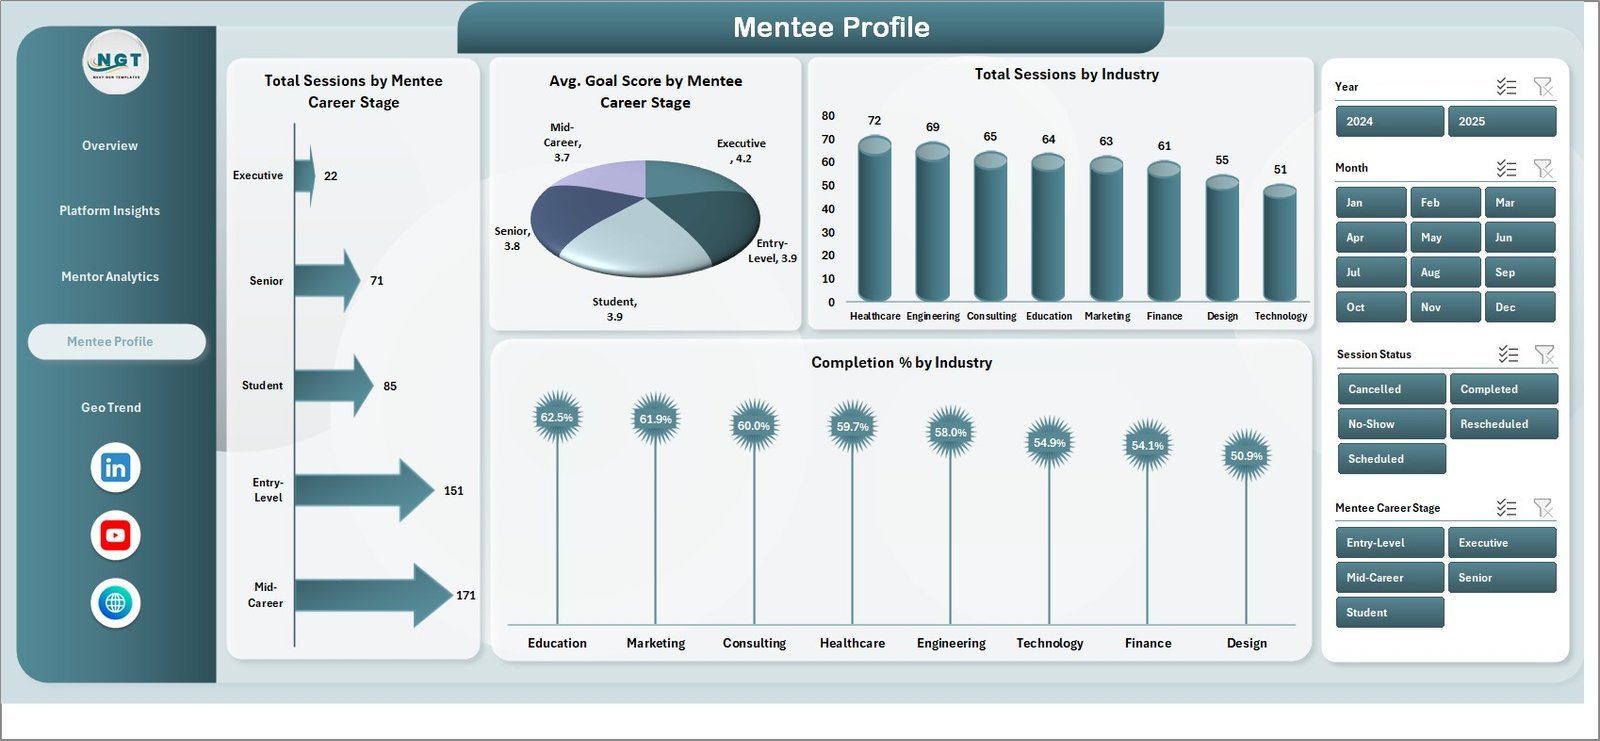
This page examines the mentee side of the platform with 4 charts: Total Sessions by Mentee Career Stage, Avg. Goal Score by Mentee Career Stage, Total Sessions by Industry, and Completion % by Industry. Understand which career stages and industries are most active on your platform.

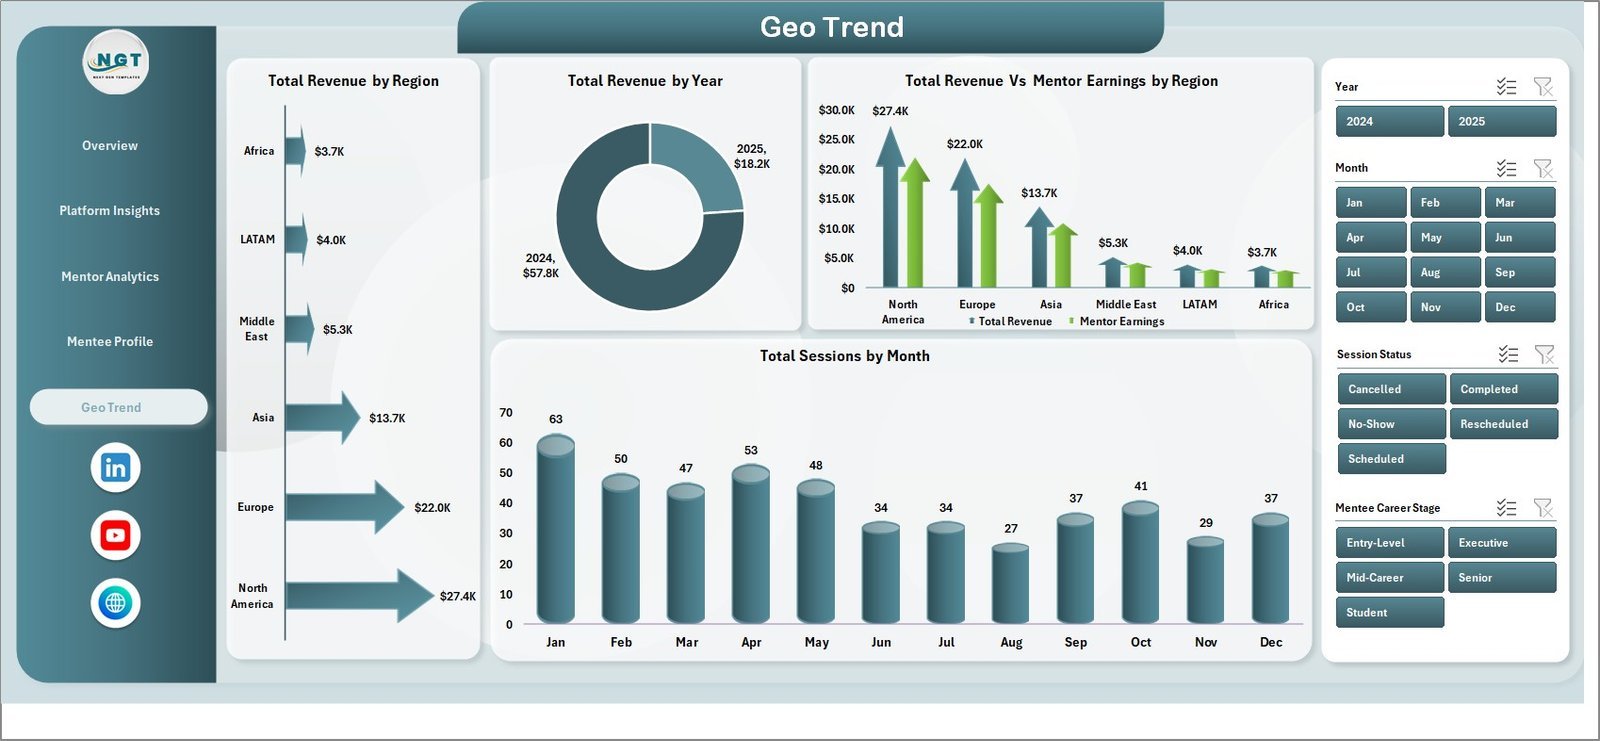
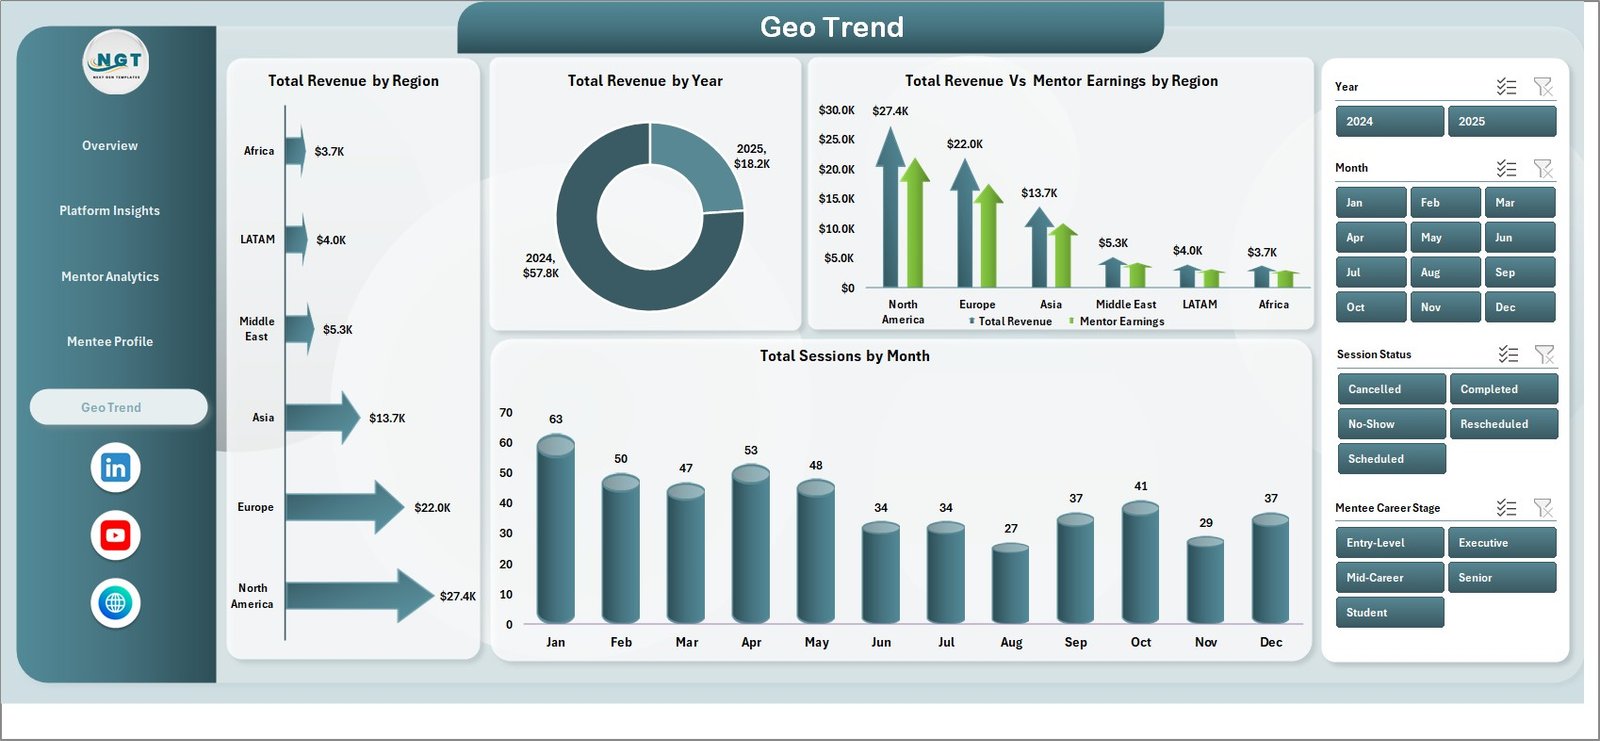
Page 5: Geo Trend
This page maps geographic and temporal performance through 4 charts: Total Revenue by Region, Total Revenue by Year, Total Revenue vs. Mentor Earnings by Region, and Total Sessions by Month. Track where your sessions are concentrated and how revenue evolves over time across geographies.
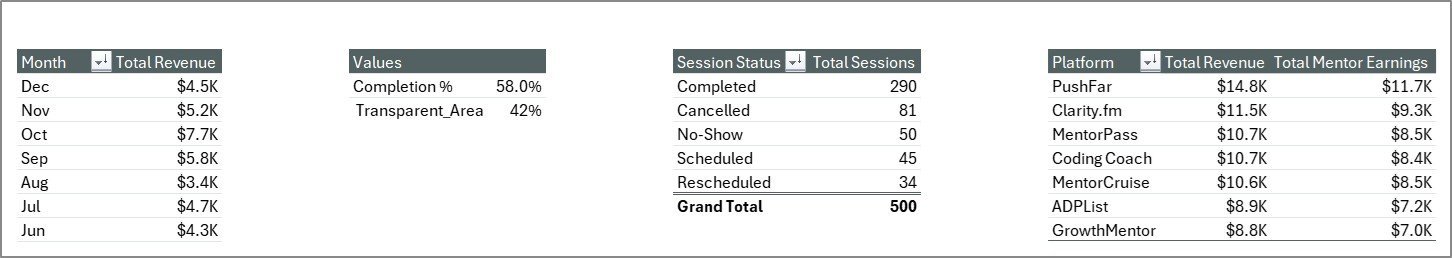
Data Sheet
Enter all your mentorship session records here in the structured column format provided. Each row represents one session and feeds the pivot tables on the Support Sheet, which in turn updates all 5 dashboard pages automatically.

Support Sheet
This hidden sheet contains all the pivot tables that drive the dashboard charts and KPIs. After updating data, use Data → Refresh All in the Excel Ribbon to refresh everything at once. You can keep this sheet hidden during regular use.

📊 Career Mentorship Platforms Dashboard in Excel vs. Google Sheets Dashboard vs. MentorcliQ / Together Platform — Where This Fits
| Feature | Career Mentorship Platforms Dashboard in Excel | Google Sheets Dashboard | MentorcliQ / Together Platform |
|---|---|---|---|
| Cost | $17.99 one-time | Free (limited) | $10–25 / user / month |
| Platform | Microsoft Excel | Google Sheets (browser) | SaaS (web-based) |
| Setup Time | Under 10 minutes | 15–20 minutes | Days (onboarding required) |
| Real-time Collaboration | Via SharePoint/OneDrive | ✅ Native | ✅ Native |
| Works Offline | ✅ Fully offline | ❌ Requires internet | ❌ Requires internet |
| Customizable KPIs | ✅ Fully editable | ✅ Editable | ❌ Fixed platform metrics |
| Data Privacy | ✅ Data stays local | Stored on Google servers | Stored on vendor servers |
| Year-1 Cost (5 users) | $17.99 total | $0 | $600–1,500+ |
| Pivot-Based Auto Refresh | ✅ Data → Refresh All | Manual formula update | Automatic (SaaS) |
For mentorship platform operators who want detailed multi-dimensional analytics without a monthly SaaS subscription, the Career Mentorship Platforms Dashboard in Excel sits in the sweet spot.
👥 Who This Template Is For — and Who It’s Not For
✅ This template is built for:
- Career coaching platform operators tracking session performance, mentor earnings, and mentee engagement
- HR teams running internal mentorship programs at companies of 50–5,000 employees
- EdTech startups and coaching businesses managing multiple platforms or subscription tiers
- Data analysts and operations managers who need a customizable, Excel-native reporting solution
- Freelance career coaches tracking their own session revenue, ratings, and client progress
❌ This template is NOT for:
- Enterprise platforms needing real-time API integrations or automated data pipelines
- Teams requiring built-in video/scheduling features (this is a reporting dashboard only)
- Organizations that need SOC 2-compliant SaaS with SSO and role-based data access
⚙️ How to Use the Career Mentorship Platforms Dashboard in Excel
1️⃣ Download and Open — Unzip the file and open it in Microsoft Excel 2016 or later.
2️⃣ Enter Your Data — Navigate to the Data Sheet and replace the sample records with your own session data, keeping the same column structure.
3️⃣ Refresh All Pivots — Click on the Data tab in the Excel Ribbon and select Refresh All. All pivot tables on the Support Sheet update instantly.
4️⃣ Explore Each Page — Navigate through the 5 dashboard pages using the page navigator tabs to view Overview, Platform Insights, Mentor Analytics, Mentee Profile, and Geo Trend.
5️⃣ Apply Slicers — Use the interactive slicers on each page to filter by platform, session type, subscription plan, region, and more.
💼 Real-World Use Cases
Priya runs operations for a career coaching startup with 3 mentorship platforms. She uses the Career Mentorship Platforms Dashboard in Excel to compare which platform generates the highest revenue per session, which subscription plan has the lowest cancellation rate, and which mentor level drives the most completions — all without paying $500/month for a BI tool.
Marcus heads an L&D team at a 200-person tech company. He uses the Mentee Profile page to track which career stages and industry groups are underserved by the internal mentoring program, and presents the Geo Trend page to leadership to justify regional expansion of coaching resources.
Ananya is a freelance career mentor managing 50+ active clients. She inputs session data monthly and uses the Mentor Analytics page to track her revenue by session type and topic — helping her focus on the highest-value offerings for her coaching business.
❓ Frequently Asked Questions
What KPIs does the Career Mentorship Platforms Dashboard in Excel track?
The Career Mentorship Platforms Dashboard in Excel tracks 5 top-level KPIs: Total Revenue, Total Sessions, Total Mentor Earnings, Average Rating, and Average Revenue per Session. These are complemented by 16 charts across 5 pages covering platform, mentor, mentee, and geographic dimensions.
Does this dashboard require any Excel add-ins or macros?
No. The Career Mentorship Platforms Dashboard in Excel is built entirely on native Excel pivot tables and charts. No macros, no Power Query, no add-ins. It works in Excel 2016, 2019, 2021, and Microsoft 365.
How do I update the dashboard with new session data?
Add your new session records to the Data Sheet in the same column format as the sample data, then go to Data → Refresh All in the Excel Ribbon. All 16 charts and 5 KPI cards update automatically within seconds.
How does this compare to MentorcliQ or Together Platform?
MentorcliQ and Together Platform are subscription SaaS tools costing $10–25 per user per month with fixed dashboards. The Career Mentorship Platforms Dashboard in Excel is a $17.99 one-time purchase with fully customizable KPIs, offline access, and no recurring fees — ideal for small to mid-size teams or early-stage platforms.
Can I add more KPIs or customize the charts?
Yes. Since the dashboard is built on editable pivot tables, you can add new data columns, create additional pivot fields, and build new charts. The Support Sheet provides the pivot data foundation for any customization.
Is this suitable for tracking multiple mentorship platforms simultaneously?
Yes. The Career Mentorship Platforms Dashboard in Excel includes a Platform dimension across all pages, allowing you to filter and compare performance across multiple platforms within a single workbook.
What Excel version is required?
Microsoft Excel 2016 or later is recommended. The dashboard uses pivot tables and slicers, both of which are fully supported in Excel 2016, 2019, 2021, and Microsoft 365.
👤 About the Author
Built by PK — Microsoft Certified Professional with 15+ years of Excel, Google Sheets, and Power BI experience. Founder of NextGenTemplates, reaching 300K+ subscribers across YouTube channels
(@PK-AnExcelExpert,
@NextGenTemplates,
@NeoTechNavigators).
Every template is hand-built and tested before release.
🔗 Explore Related Templates
Looking for more Excel Dashboard Templates? Here are some related products you may find useful:
- Alumni Engagement KPI Dashboard in Excel — Track alumni participation, donations, and volunteer engagement
- Event Management Dashboard in Excel — Monitor event budgets, satisfaction, and ROI across regions
- Colleges & Universities Dashboard in Power BI — Institutional performance tracking for academic teams
📖 Click here to read the Detailed Blog Post
🎥 Visit our YouTube channel for step-by-step video tutorials
👉 YouTube.com/@NextGenTemplates
📅 Last updated: May 2026
Watch the step-by-step video tutorial:
YouTube


Reviews
There are no reviews yet.