

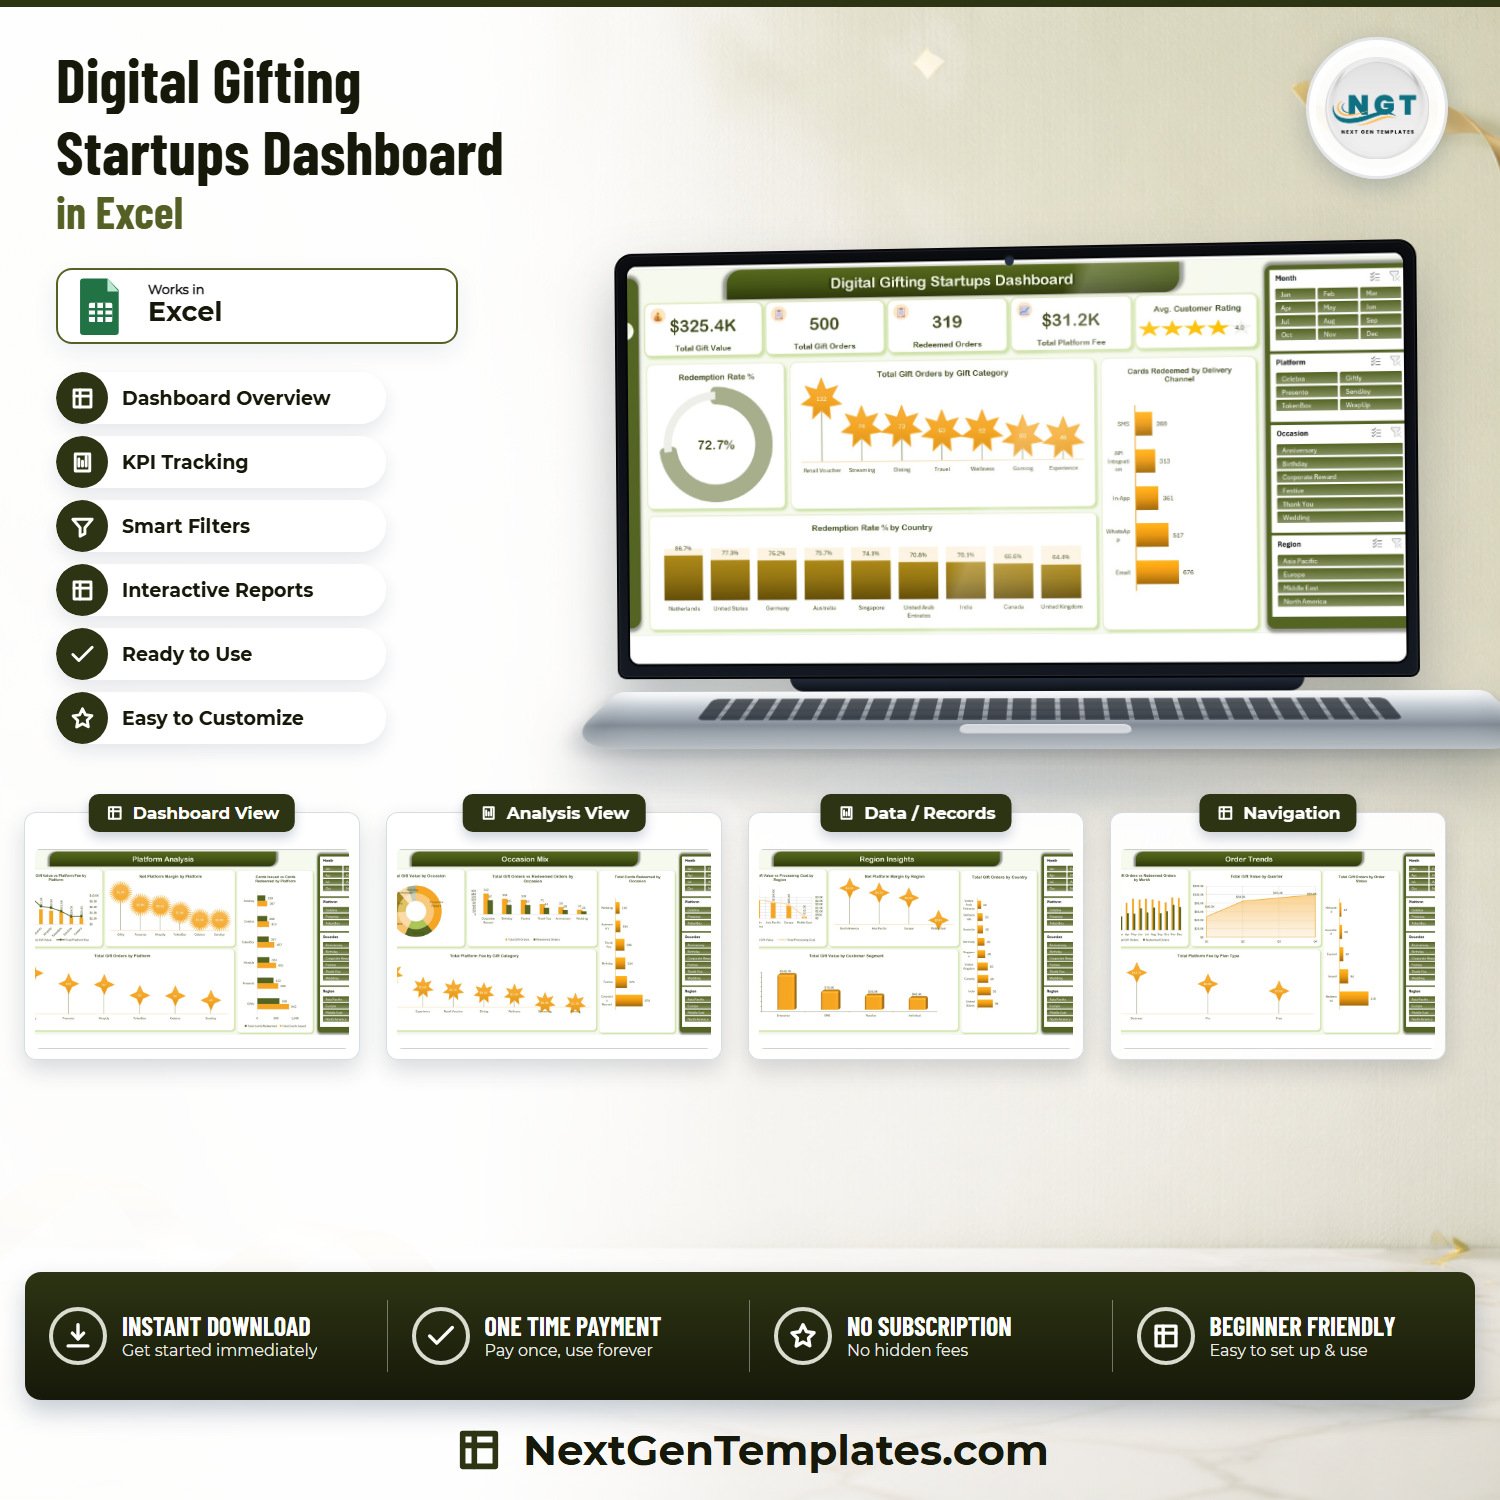

The Digital Gifting Startups Dashboard in Excel turns 500 e-gift orders into five linked report pages that answer the question every gifting platform founder gets asked in a board meeting: how much value moved, how much of it was actually redeemed, and what the platform kept. The sample book runs from 1 January 2025 to 30 December 2025 and carries $325.4K in gift value, 500 gift orders, 319 redeemed orders, $31.2K in platform fee and a 72.7% card redemption rate across six platforms, nine countries and six occasions. Nothing is hard-coded: 26 pivot tables sit behind 21 charts, so when you paste your own orders onto the Data sheet and hit Refresh All, every card and chart moves with you. No macros, no add-ins, no subscription – one file, one payment, and a user manual PDF in the same download. Digital Gifting Startups Dashboard in Excel
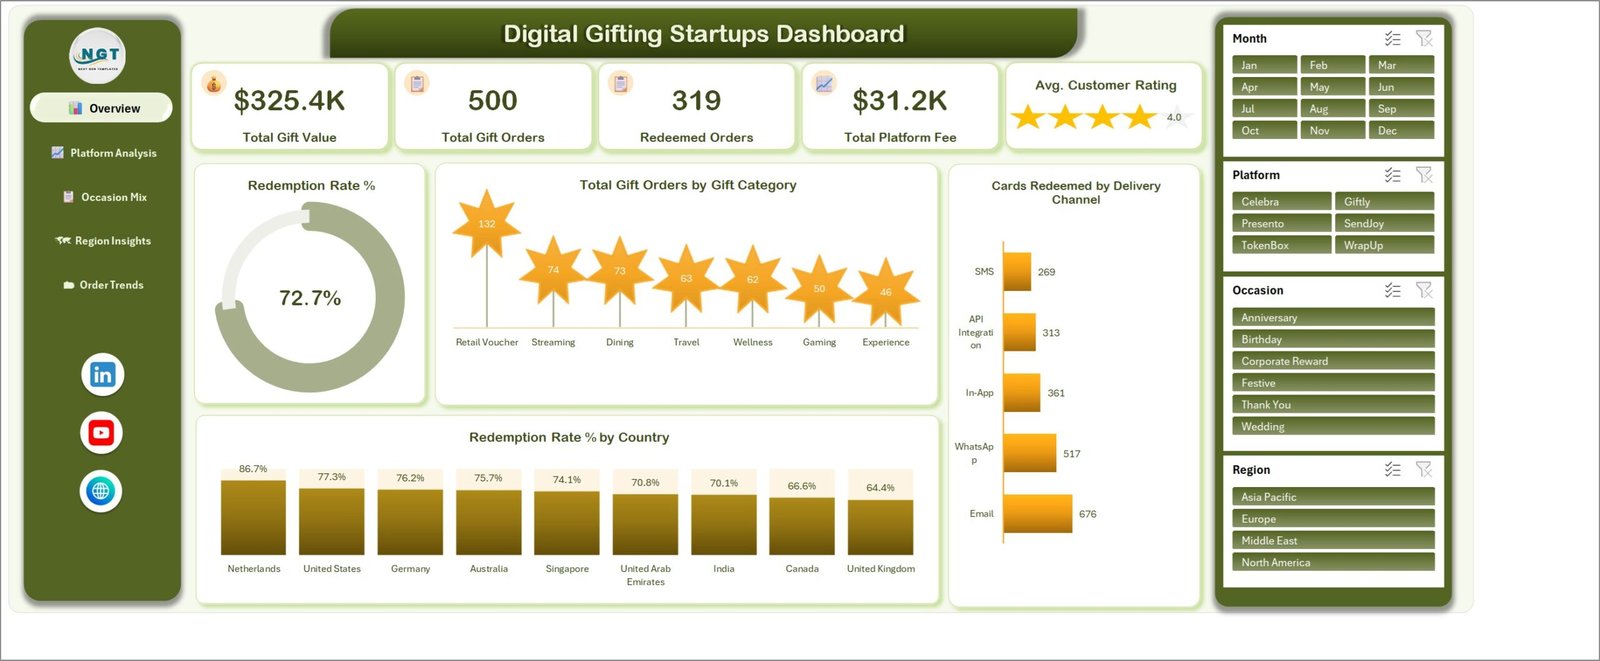
This is the analytical Excel Dashboard – five navigable report pages driven by slicers. It is not a KPI scorecard with a month picker and traffic lights, and it is not a one-page tracker. If you want the scorecard format instead, the KPI Dashboard and KPI Scorecard lines are separate templates and are linked further down.
Key Features of the Digital Gifting Startups Dashboard in Excel
- Five KPI cards on the Overview – Total Gift Value ($325.4K), Total Gift Orders (500), Redeemed Orders (319), Total Platform Fee ($31.2K) and Avg. Customer Rating (4.0 shown as a five-star gauge).
- A redemption gauge, not a guess – the Redemption Rate % donut reads 72.7%, computed from 2,136 cards redeemed against 2,940 cards issued rather than from order counts, which is the number that actually predicts breakage revenue.
- 21 charts across five pages – gift category, delivery channel, platform, occasion, country, region, customer segment, plan type, order status, month and quarter cuts, each named for the metric it plots.
- Four slicers repeated on every page – Month, Platform, Occasion and Region. Click Giftly plus Corporate Reward and all five pages re-cut together; the slicers are cloned onto each sheet so you never scroll back to filter.
- Unit economics built in – Gift Value, Discount Amount, Platform Fee, Processing Cost and Marketing Cost are separate columns, so Net Platform Margin is a real subtraction and not a made-up percentage. Margin totals $13.0K on the sample data.
- Left-hand page navigation – Overview, Platform Analysis, Occasion Mix, Region Insights and Order Trends, one click each.
- 500-row Data sheet in 30 columns – order ID, date, platform, country, region, gift category, delivery channel, occasion, customer segment, plan type, order status, cards issued, cards redeemed, five money columns, delivery time, customer rating, plus calculated Month, Year, Quarter and order-value-band helper columns.
- Support sheet – holds the pivot layer that feeds the charts, so the report pages stay clean and you can audit any number back to source.
What’s Inside the Digital Gifting Startups Dashboard in Excel
Page 1 – Overview. Five KPI cards, the Redemption Rate % donut, Total Gift Orders by Gift Category (Retail Voucher 132, Streaming 74, Dining 73, Travel 63, Wellness 62, Gaming 50, Experience 46), Cards Redeemed by Delivery Channel (Email 676, WhatsApp 517, In-App 361, API Integration 313, SMS 269) and Redemption Rate % by Country, which spreads from the Netherlands at 86.7% down to the United Kingdom at 64.4%.
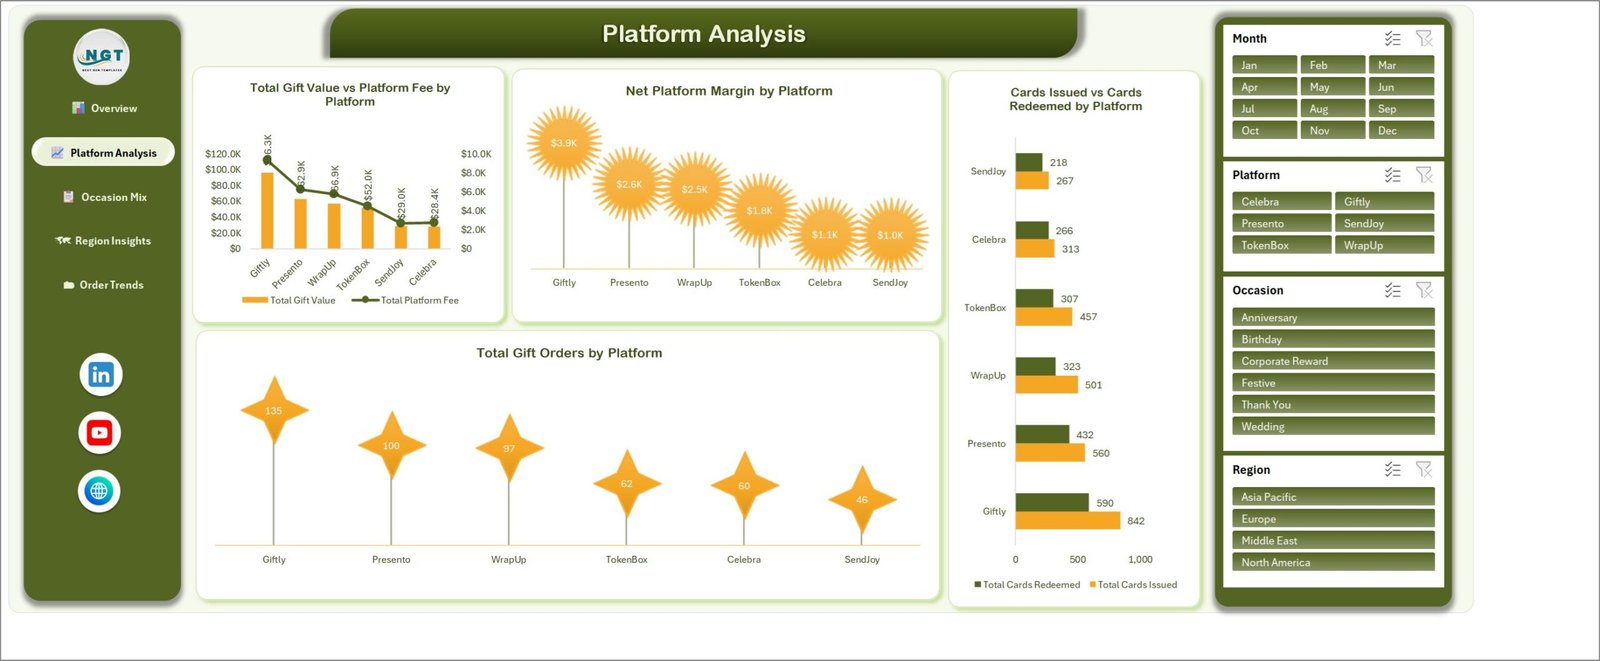
Page 2 – Platform Analysis. Total Gift Value vs Platform Fee by Platform on a dual axis, Net Platform Margin by Platform (Giftly $3.9K, Presento $2.6K, WrapUp $2.5K, TokenBox $1.8K, Celebra $1.1K, SendJoy $1.0K), Total Gift Orders by Platform (135 / 100 / 97 / 62 / 60 / 46) and Cards Issued vs Cards Redeemed by Platform, which is where you see Giftly issue 842 cards and redeem 590.
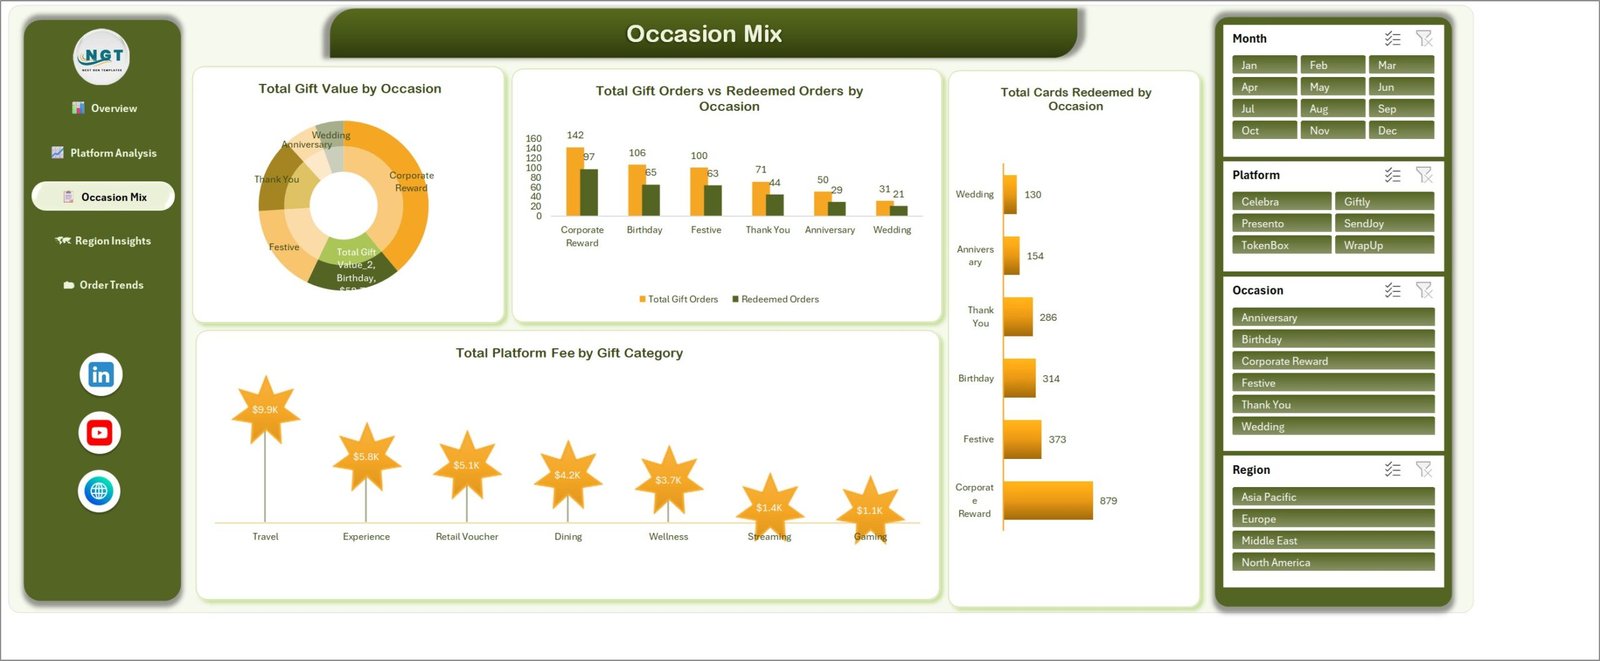
Page 3 – Occasion Mix. Total Gift Value by Occasion as a donut, Total Gift Orders vs Redeemed Orders by Occasion (Corporate Reward 142 ordered / 97 redeemed, then Birthday, Festive, Thank You, Anniversary and Wedding), Total Cards Redeemed by Occasion where Corporate Reward alone accounts for 879 of the 2,136 cards, and Total Platform Fee by Gift Category, led by Travel at $9.9K.
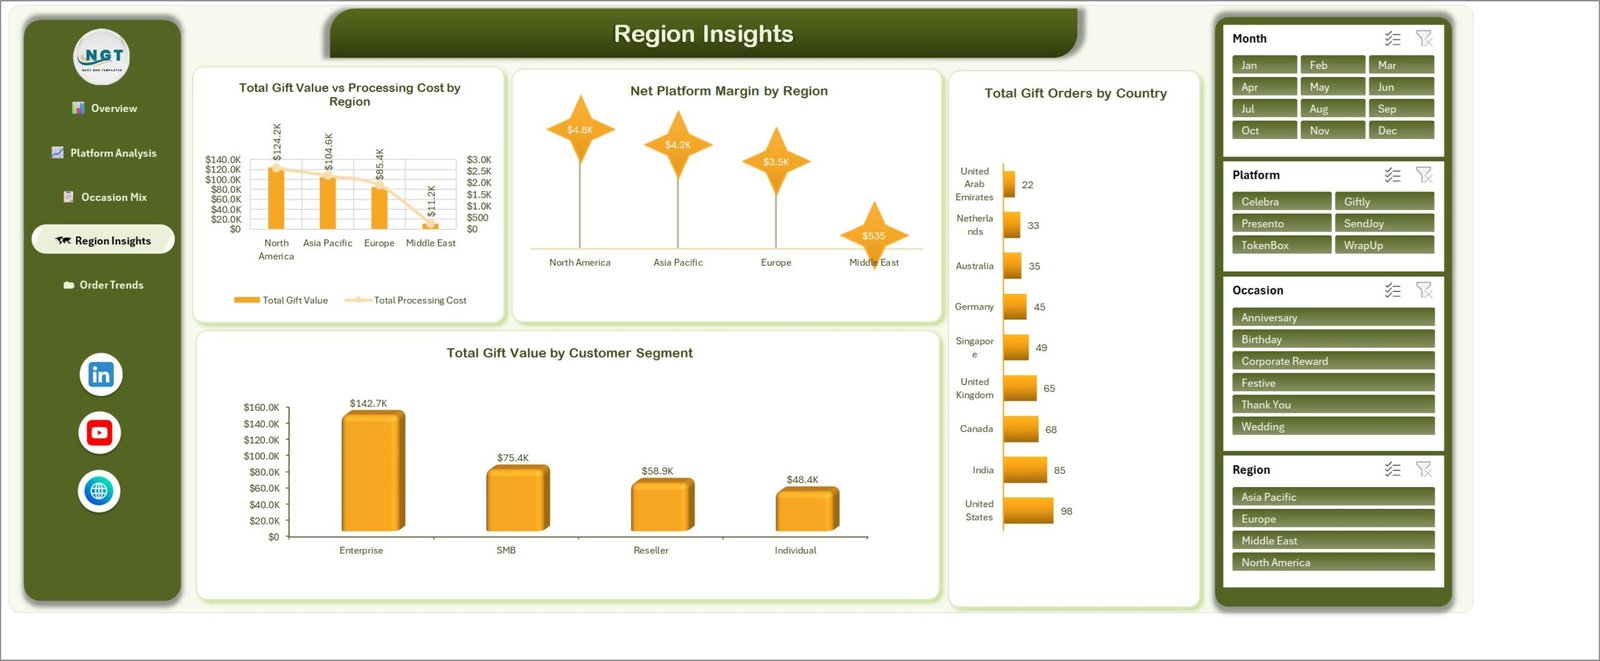
Page 4 – Region Insights. Total Gift Value vs Processing Cost by Region (North America $124.2K, Asia Pacific $104.6K, Europe $85.4K, Middle East $11.2K), Net Platform Margin by Region, Total Gift Orders by Country for all nine markets, and Total Gift Value by Customer Segment – Enterprise $142.7K, SMB $75.4K, Reseller $58.9K, Individual $48.4K.
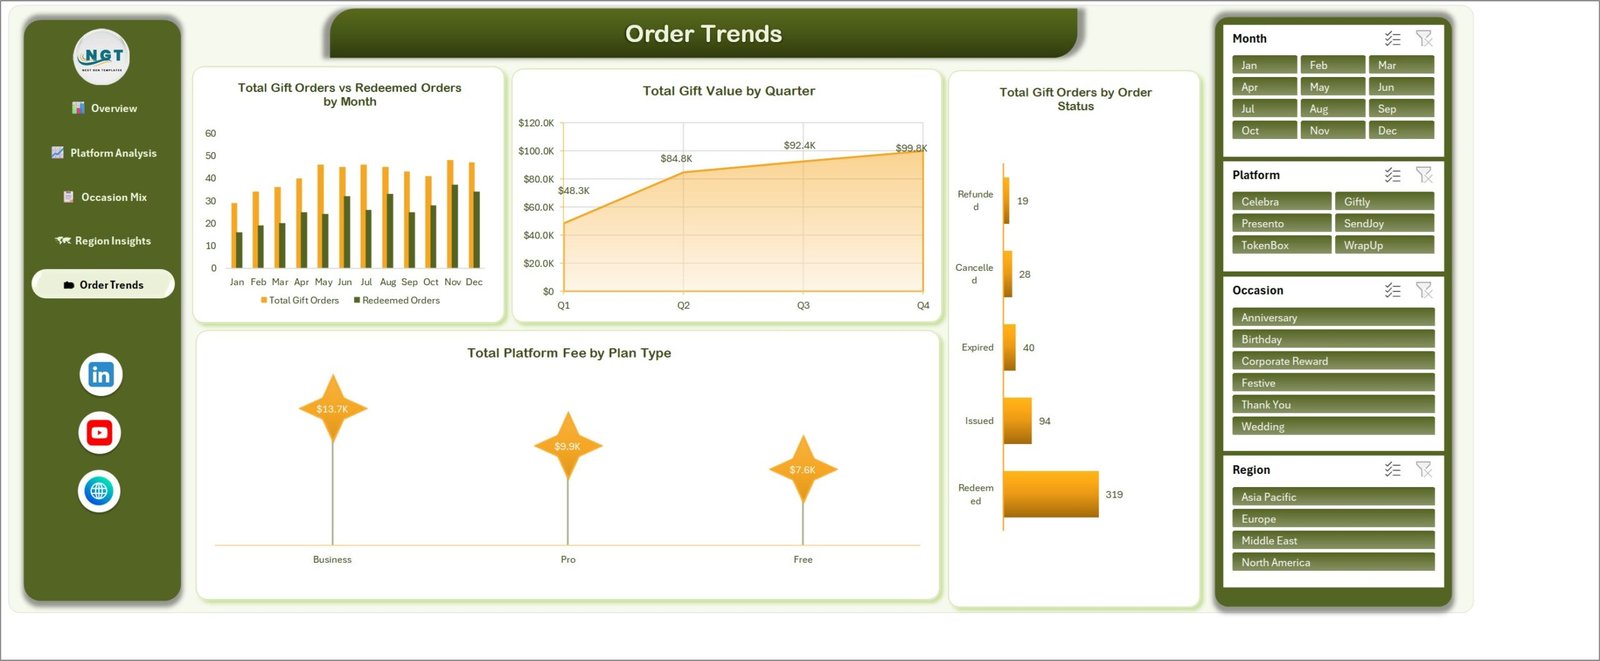
Page 5 – Order Trends. Total Gift Orders vs Redeemed Orders by Month for all twelve months, Total Gift Value by Quarter as an area chart (Q1 $48.3K rising to Q4 $99.8K), Total Gift Orders by Order Status (Redeemed 319, Issued 94, Expired 40, Cancelled 28, Refunded 19) and Total Platform Fee by Plan Type (Business $13.7K, Pro $9.9K, Free $7.6K).
Digital Gifting Startups Dashboard in Excel vs. Google Sheets vs. Paid Analytics SaaS – Where This Fits
| This Excel dashboard | Google Sheets build | Looker Studio / Mixpanel plan | |
|---|---|---|---|
| Cost | $17.99 once | Free tool, days of your build time | $70-$300+ per month |
| Platform | Excel 2016 or later, Microsoft 365, desktop | Browser | Browser, vendor-hosted |
| Setup time | Paste your orders, Refresh All – about 15 minutes | 1-3 days to build the pivots and charts | Days of connector and schema work |
| Real-time team collaboration | Via OneDrive or SharePoint co-authoring | Yes, native | Yes |
| Mobile access | Excel mobile app, read and filter | Yes | Yes |
| Customisable fields | All 30 columns, add your own | Full, but you build it | Limited to the vendor’s schema |
| Share with a link | Yes, once stored in OneDrive | Yes | Yes, seat-limited |
| Year-1 cost at 5 users | $17.99 | $0 plus your build time | $4,200-$18,000 |
| Card-level redemption maths | Cards issued vs redeemed, per platform and occasion | Only if you model it yourself | Needs a custom event schema |
| Works with no internet | Yes | No | No |
Who This Template Is For – and Who It’s Not For
It fits founders and operators at e-gift card platforms, corporate gifting startups, rewards and incentive marketplaces, and any business that issues digital vouchers and earns a platform fee on them. It suits a team of 1-30 people that has outgrown a raw export but is not ready to pay for a BI seat per head. Digital Gifting Startups Dashboard in Excel
It is not for you if you need live API sync from Stripe or your card issuer – this is a paste-and-refresh workbook, not a pipeline. It is not a fulfilment or inventory system for physical gift boxes; try the Gift Shops Dashboard in Excel for retail gifting instead. And if you want a single-page month-picker scorecard with traffic lights rather than five analytical pages, this is the wrong format. Digital Gifting Startups Dashboard in Excel
How to Use the Digital Gifting Startups Dashboard in Excel
- Unzip the download and open Digital Gifting Startups Dashboard in Excel.xlsx. Enable editing – there are no macros to enable.
- Open the Data sheet. The table is named TblData and runs B3:AE503. Delete the 500 sample rows and paste your own orders under the same 30 headers.
- Keep the four calculated columns (Month, Year, Quarter, Order Value Band) – they fill down automatically from Order Date.
- Go to Data > Refresh All. All 26 pivot tables and 21 charts update, and the KPI cards recalculate.
- Use the Month, Platform, Occasion and Region slicers on the right of any page to cut the whole report. The clear-filter icon at the top of each slicer resets it.
- Rename platforms, occasions and gift categories to match your own catalogue – the charts pick up the new labels on the next refresh.
- Print or export any page to PDF with File > Export; each page is laid out to fit one landscape sheet.
Real-World Use Cases
Meera, founder of a 9-person corporate gifting platform. She filters to Occasion = Corporate Reward and sees 142 orders producing 879 redeemed cards – by far the heaviest redemption of any occasion. That tells her the corporate bulk-issue flow, not the consumer birthday flow, is where support load and breakage assumptions actually live, and she reprices the enterprise tier accordingly.
Daniel, growth lead at an e-gift marketplace. Redemption Rate % by Country runs from 86.7% in the Netherlands to 64.4% in the United Kingdom. He crosses that with Cards Redeemed by Delivery Channel – Email 676 against SMS 269 – and runs a channel test in the two weakest markets rather than spending on new acquisition.
Priya, finance manager at a rewards startup. She lives on Platform Analysis. Total Gift Value vs Platform Fee by Platform plus Net Platform Margin by Platform shows Giftly carrying the largest volume but SendJoy returning only $1.0K of margin, so the take-rate conversation with the smallest partner finally has a number attached to it. Digital Gifting Startups Dashboard in Excel
Frequently Asked Questions
Which Excel versions does this work in?
Excel 2016, 2019, 2021 and Microsoft 365 on Windows or Mac. It uses standard pivot tables, slicers and charts – no Power Pivot, no Power Query, no macros, so nothing is blocked by a corporate macro policy.
Can I add more than 500 rows?
Yes. TblData is a proper Excel table, so pasting beyond row 503 extends it automatically and every pivot picks the new rows up on the next Refresh All. Tens of thousands of rows are fine.
Do I have to keep the sample platforms and occasions?
No. Overwrite Giftly, Presento, WrapUp, TokenBox, Celebra and SendJoy with your own partner names, and the same for occasions and gift categories. The slicers and every chart label rebuild from your data.
Is the redemption rate based on orders or cards?
Cards. The gauge divides cards redeemed by cards issued, which is why it reads 72.7% while redeemed orders are 319 of 500. Both views are in the file – order-level redemption sits on the Occasion Mix and Order Trends pages.
Is this the same as your KPI Dashboard or KPI Scorecard templates?
No. This is the analytical five-page Excel Dashboard line. The KPI Dashboard and KPI Scorecard lines are separate products with a month picker, MTD/YTD columns and traffic-light targets. Different layout, different job – many customers own both.
What exactly is in the download?
A single ZIP containing the .xlsx workbook and an Excel Dashboard user manual PDF. Instant download after checkout, no subscription, no licence key.
Can I use it for client work?
Yes, for your own business or your clients’ reporting. You may not resell or redistribute the template file itself.
About the Author
Built by PK – Microsoft Certified Professional with 15+ years of Excel, Google Sheets, and Power BI experience. Founder of NextGenTemplates, reaching 300K+ subscribers across YouTube channels. Every template is hand-built and tested before release.
Explore Related Templates
- Gift Shops Dashboard in Excel – the physical-retail counterpart, for stores rather than platforms.
- Airline Loyalty Programs Dashboard in Excel – the same issue-and-redeem economics applied to points.
- Fashion E-commerce KPI Dashboard in Excel – the scorecard format, if you want targets and traffic lights.
- Gift Tracker Data Entry System in Excel – a form-driven entry tool to capture gift records before they reach this dashboard.
- Cybersecurity Startups Dashboard in Excel – same five-page startup analytics layout, different vertical.
- Browse the full Excel Dashboard category or every MS Excel template.
Download the Digital Gifting Startups Dashboard in Excel today – $17.99 instead of $29.99, one payment, instant download, and a user manual in the same ZIP. Paste your orders, press Refresh All, and have a board-ready gifting report in about fifteen minutes.
Last updated: 1 September 2026.
Watch the demo video:
Compatibility and Requirements
- Works in Microsoft Excel desktop (Excel 2016 or later, or Microsoft 365).
- The four slicers (Month, Platform, Occasion and Region) filter all five report pages. Microsoft explains them in Use slicers to filter data.
Related Digital Gifting and Startup Dashboards
- Digital Gifting Startups Dashboard in Power BI: the same gifting analysis as a Power BI report
- Digital Comic Startups Dashboard in Excel: the same startup dashboard layout for digital comics
- Digital Curriculum Startups Dashboard in Excel: the same layout for digital curriculum startups
- Digital Marketing Campaign Dashboard in Excel: campaign results next to your gifting numbers
Browse all Excel sales and marketing templates.


























Reviews
There are no reviews yet.