

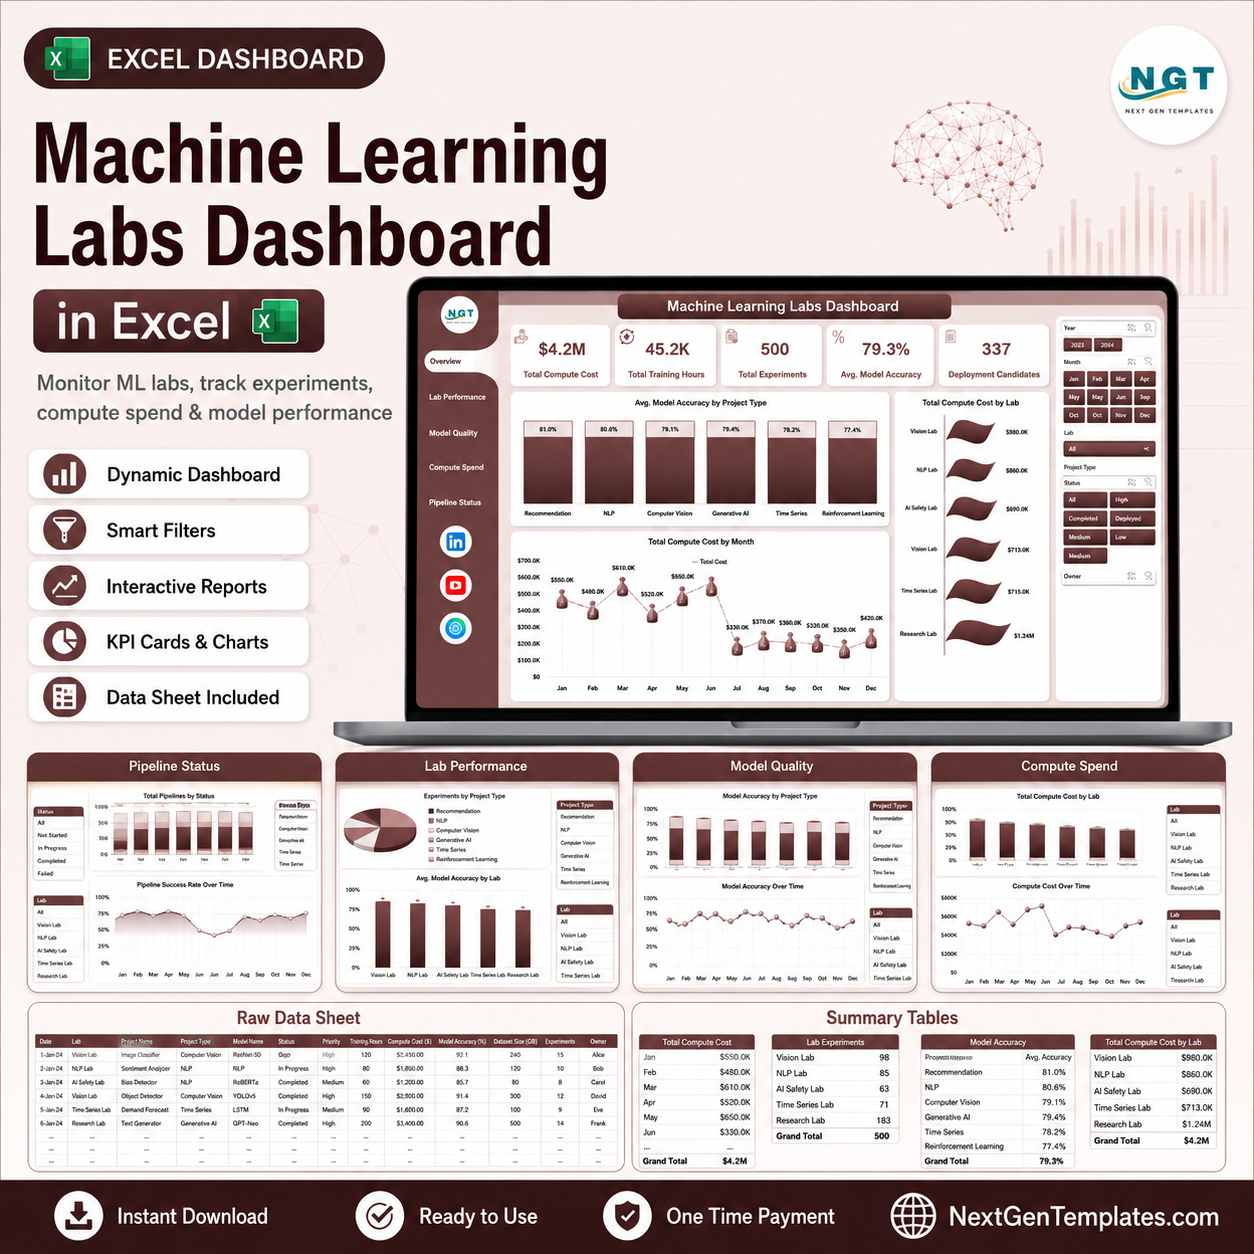



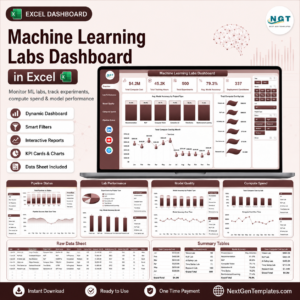
The Machine Learning Labs Dashboard in Excel helps AI lab managers monitor 5 executive KPI cards, 5 analysis pages, 17 chart views, slicers, and a pivot-driven support model in one editable workbook. For a one-time $17.99 sale price, research leads, data science managers, ML platform owners, and innovation teams can track compute cost, training hours, experiments, model accuracy, failed runs, completion rate, lab performance, teams, platforms, priorities, and deployment candidates without paying for a monthly BI or lab operations SaaS tool. Setup takes under 10 minutes: replace the sample data, click Data > Refresh All, and review the refreshed dashboard.
Instant download. One-time payment. No subscription. No per-user fees. Lifetime access.
Key Features of Machine Learning Labs Dashboard in Excel
- 5 KPI cards for Total Compute Cost, Total Training Hours, Total Experiments, Avg. Model Accuracy, and Deployment Candidates.
- 5 dashboard pages for Overview, Lab Performance, Model Quality, Compute Spend, and Pipeline Status.
- 17 chart views covering accuracy, compute cost, training hours, experiments, satisfaction, failed runs, completion rate, project type, lab, team, model family, platform, priority, status, and month.
- Interactive slicers help users filter the dashboard quickly without rebuilding reports.
- Structured Data Sheet lets users paste or update machine learning lab records in the same format.
- Support Sheet with pivot tables powers the dashboard dynamically and can be hidden after setup.
- No macros required because the workbook uses native Excel tables, charts, slicers, and pivot tables.
What’s Inside the Machine Learning Labs Dashboard in Excel
1. Overview Page
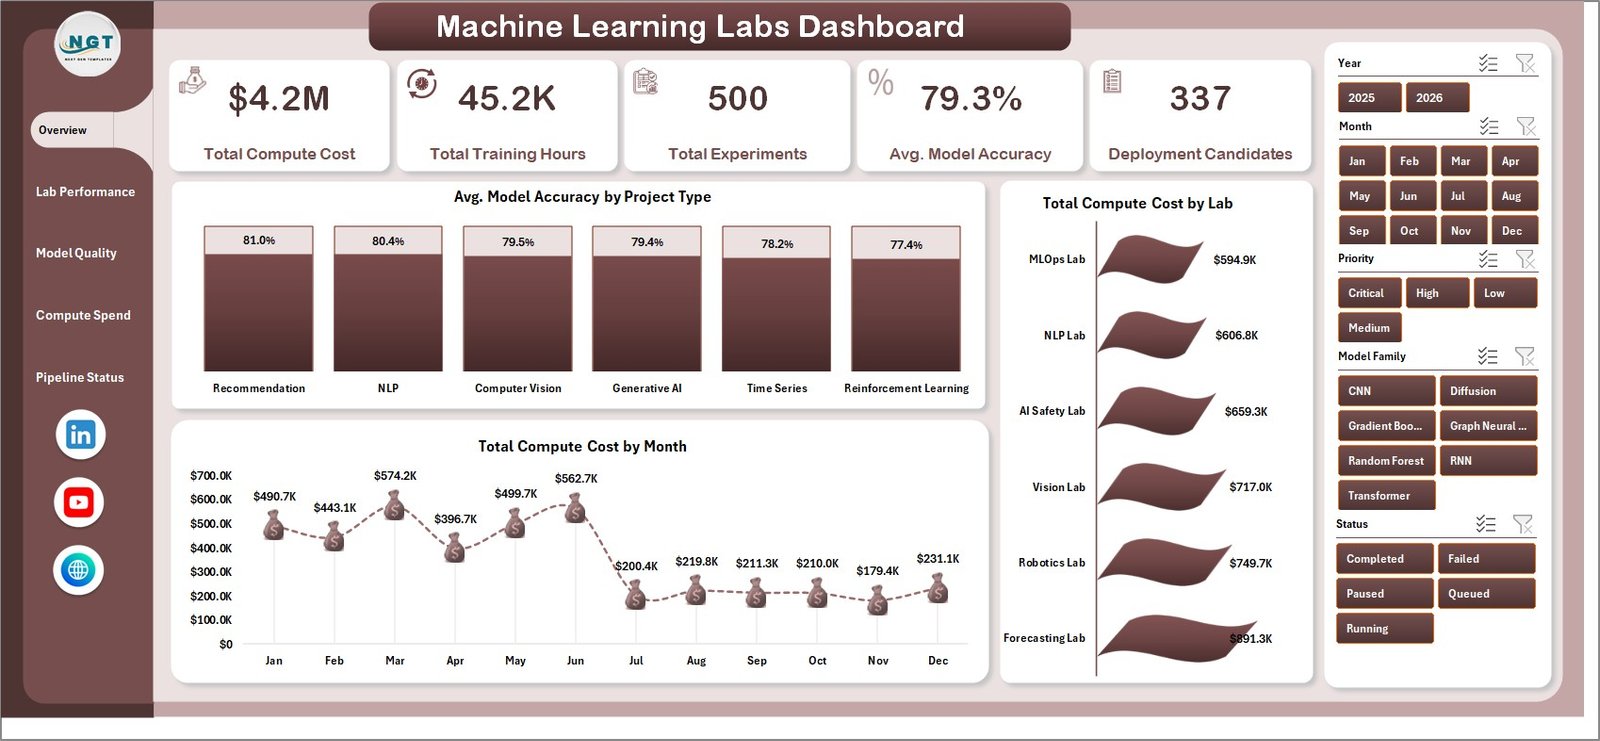
The Overview Page gives leadership a fast summary of lab scale, model quality, infrastructure usage, and deployment readiness. The cards show Total Compute Cost, Total Training Hours, Total Experiments, Avg. Model Accuracy, and Deployment Candidates.
Avg. Model Accuracy by Project Type: This chart compares model quality across project categories. It helps teams see whether classification, forecasting, NLP, computer vision, or other project types are producing stronger accuracy.
Total Compute Cost by Month: This trend chart shows how infrastructure spend moves across reporting periods. It helps managers spot cost spikes tied to intensive training cycles or new experiment waves.
Total Compute Cost by Lab: This chart compares spend across labs. It helps leadership identify high-cost labs and review whether that spend is aligned with experiment volume and deployment outcomes.
2. Lab Performance
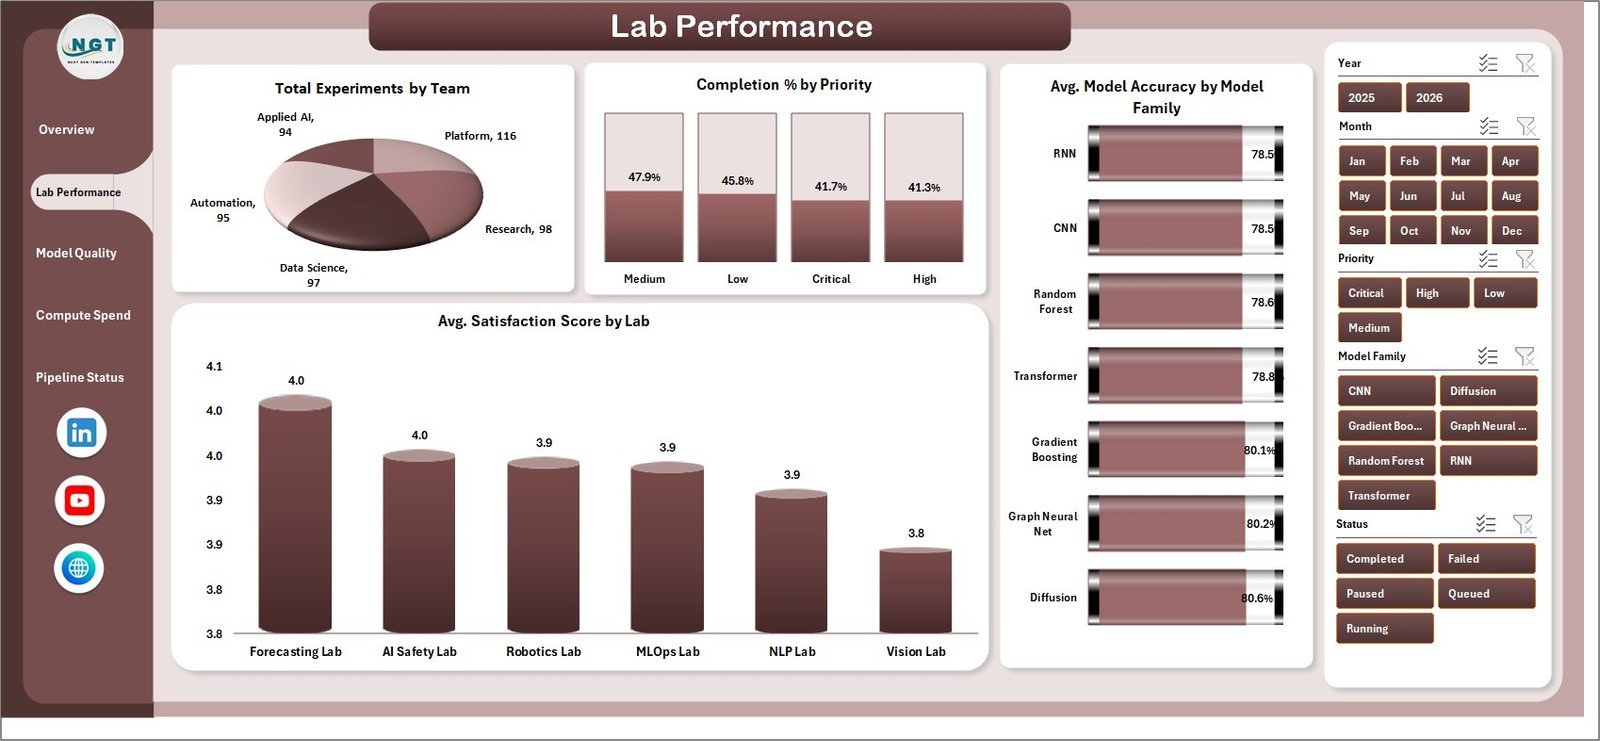
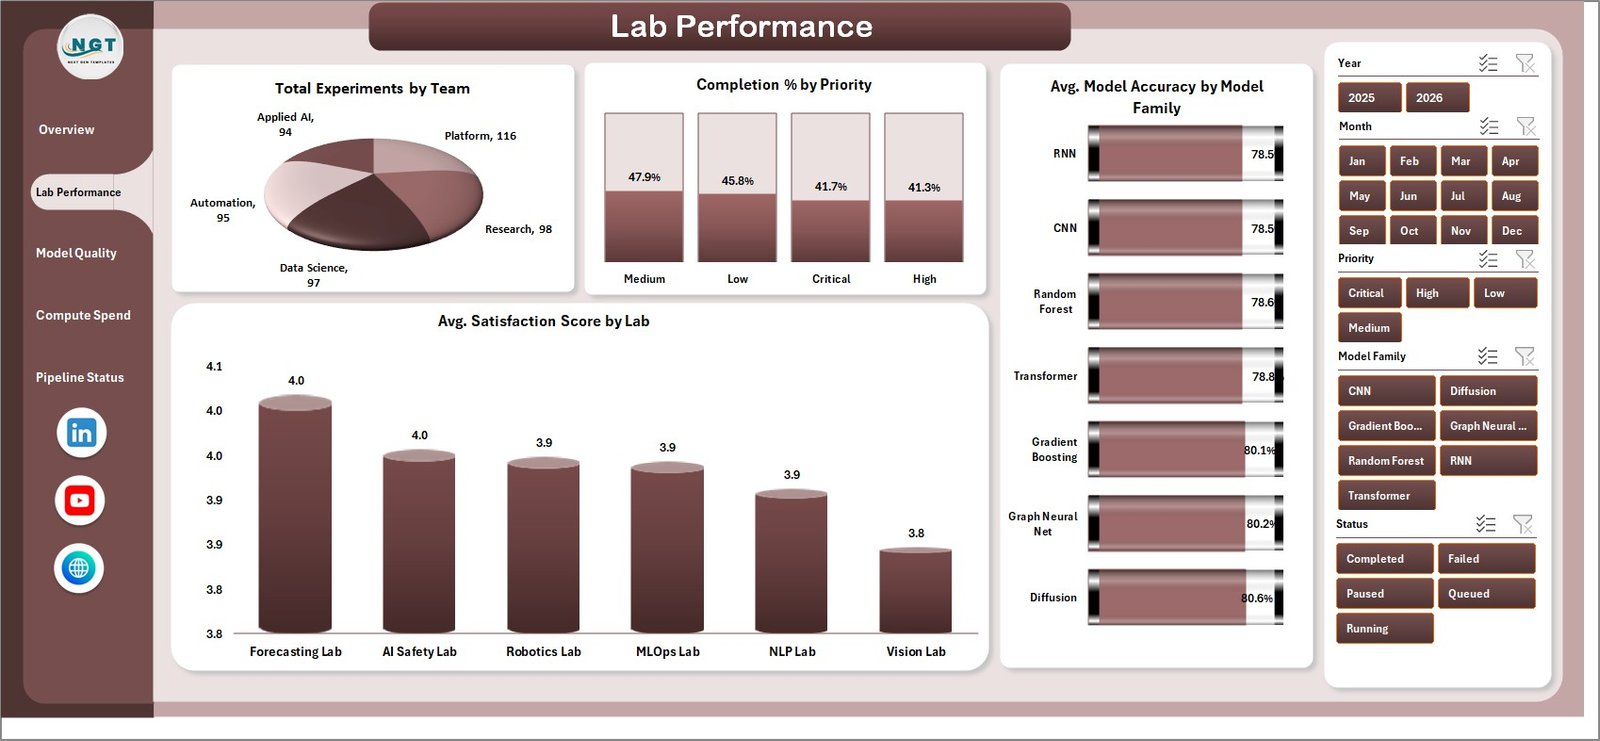
The Lab Performance tab compares team execution, priority completion, lab satisfaction, and model-family accuracy. It includes Total Experiments by Team, Completion % by Priority, Avg. Satisfaction Score by Lab, and Avg. Model Accuracy by Model Family.
3. Model Quality
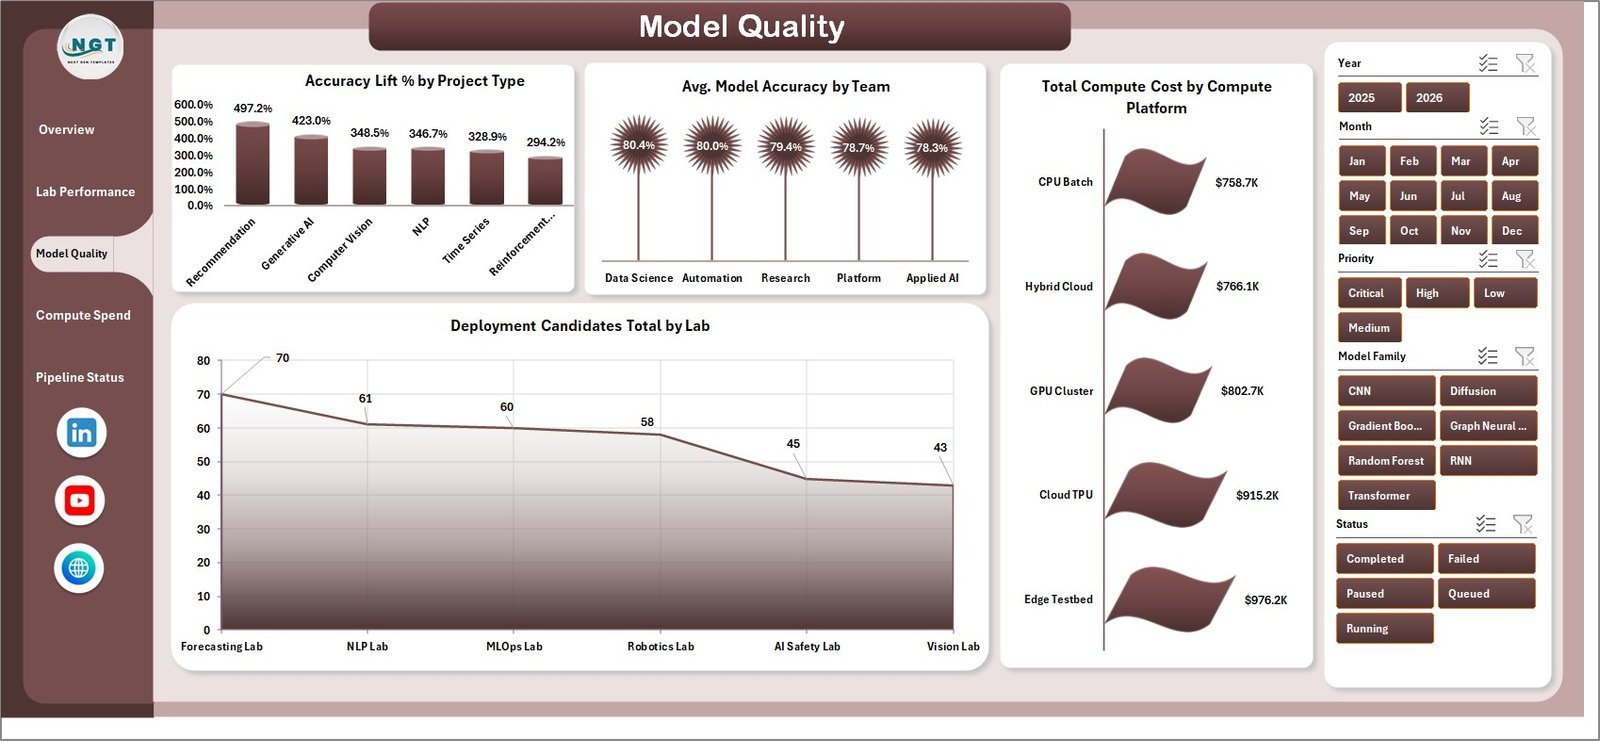
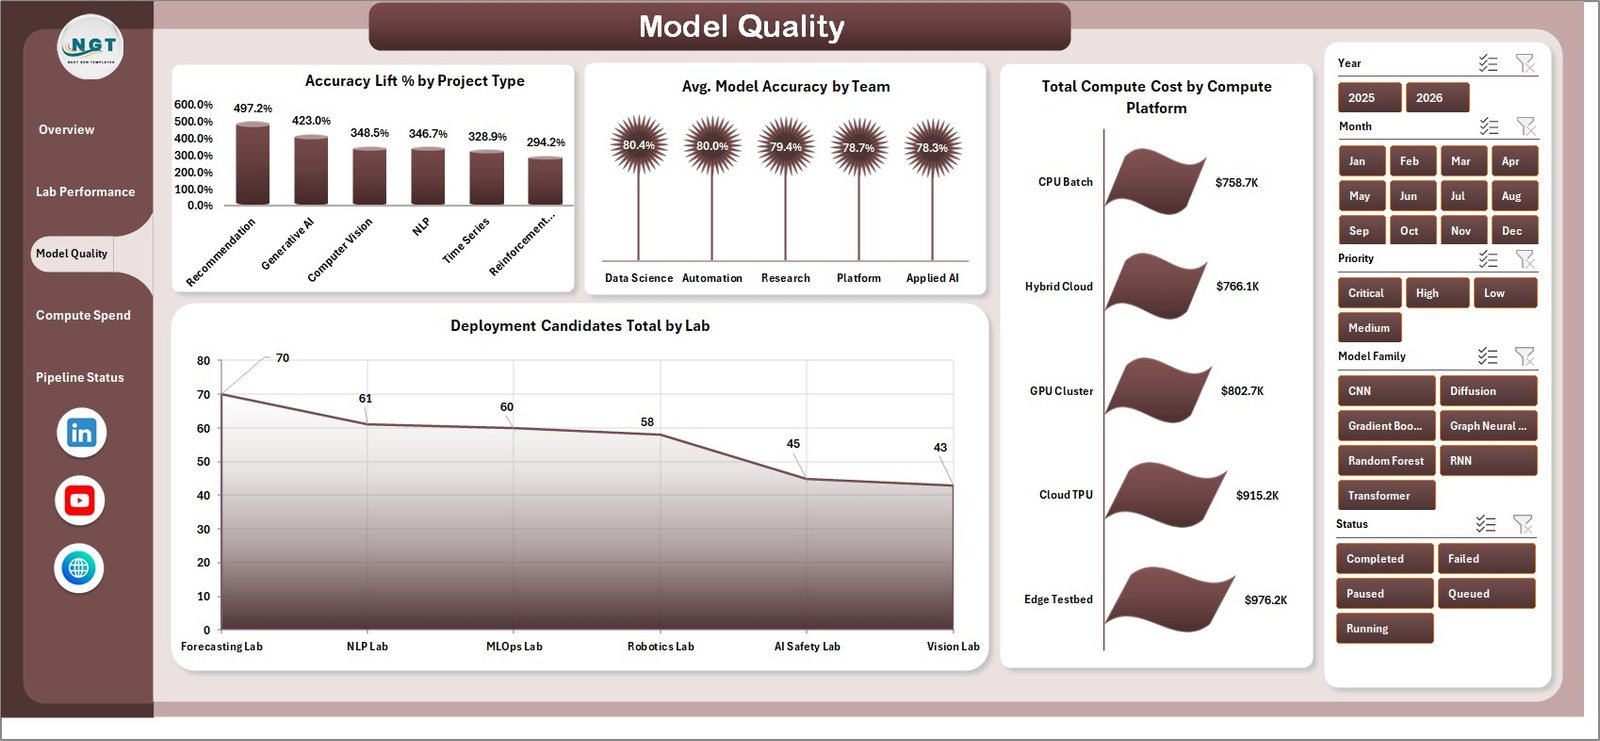
The Model Quality page helps teams understand whether projects are improving model results and producing deployable work. It includes Accuracy Lift % by Project Type, Avg. Model Accuracy by Team, Deployment Candidates Total by Lab, and Total Compute Cost by Compute Platform.
4. Compute Spend
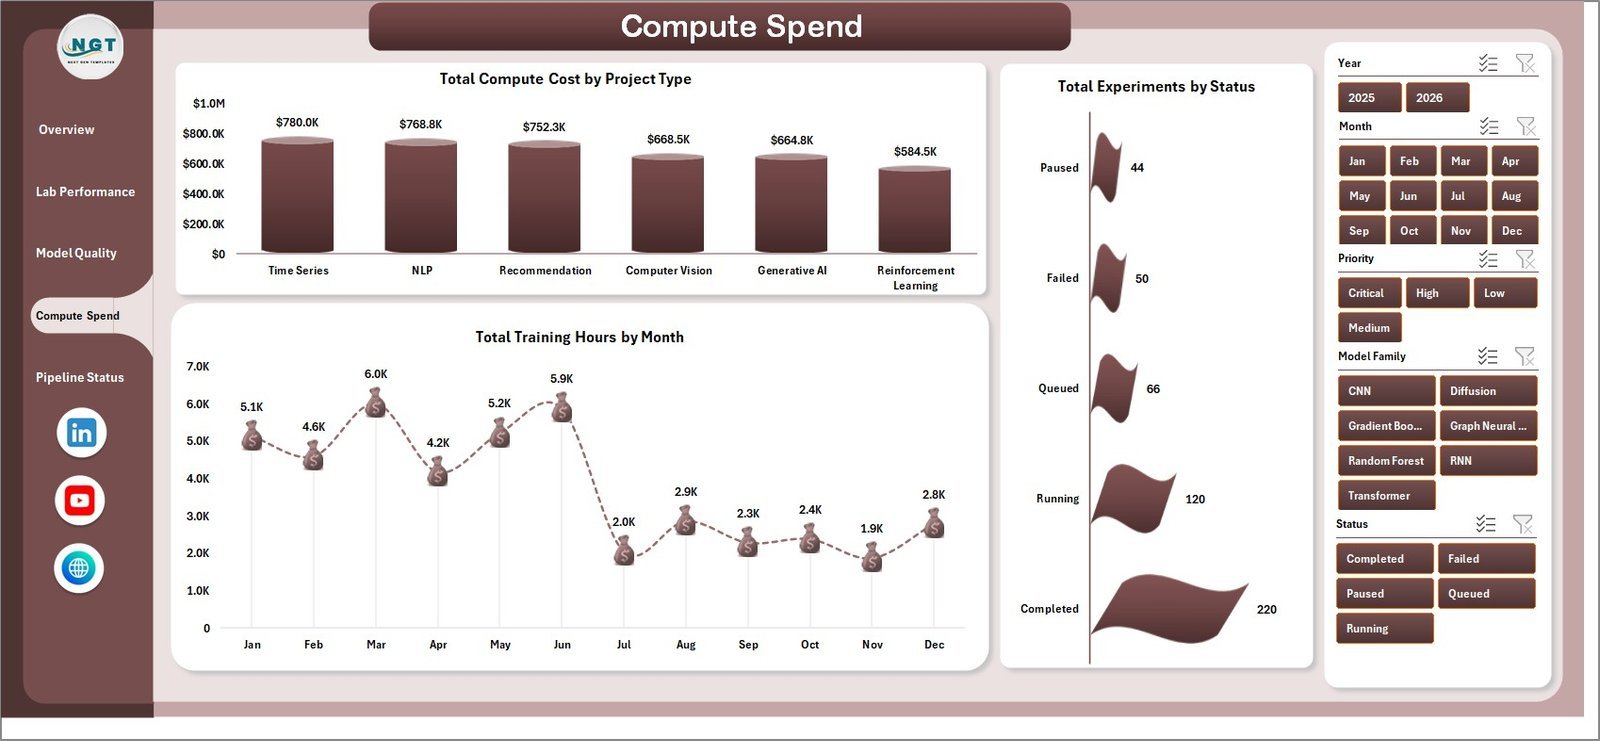
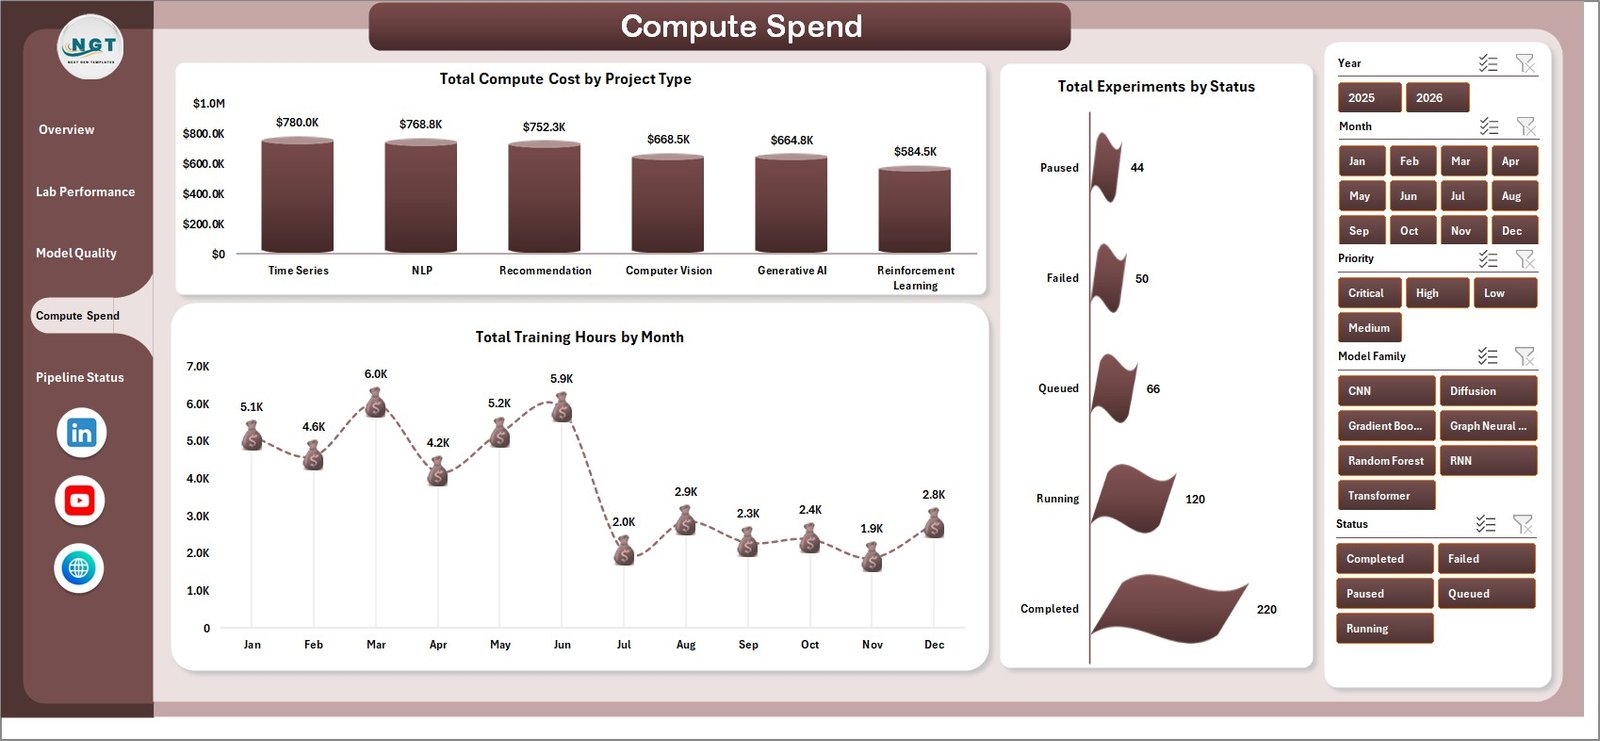
The Compute Spend page is built for finance, platform, and ML operations review. It includes Total Compute Cost by Project Type, Total Training Hours by Month, and Total Experiments by Status, making it easier to connect cost with output.
5. Pipeline Status
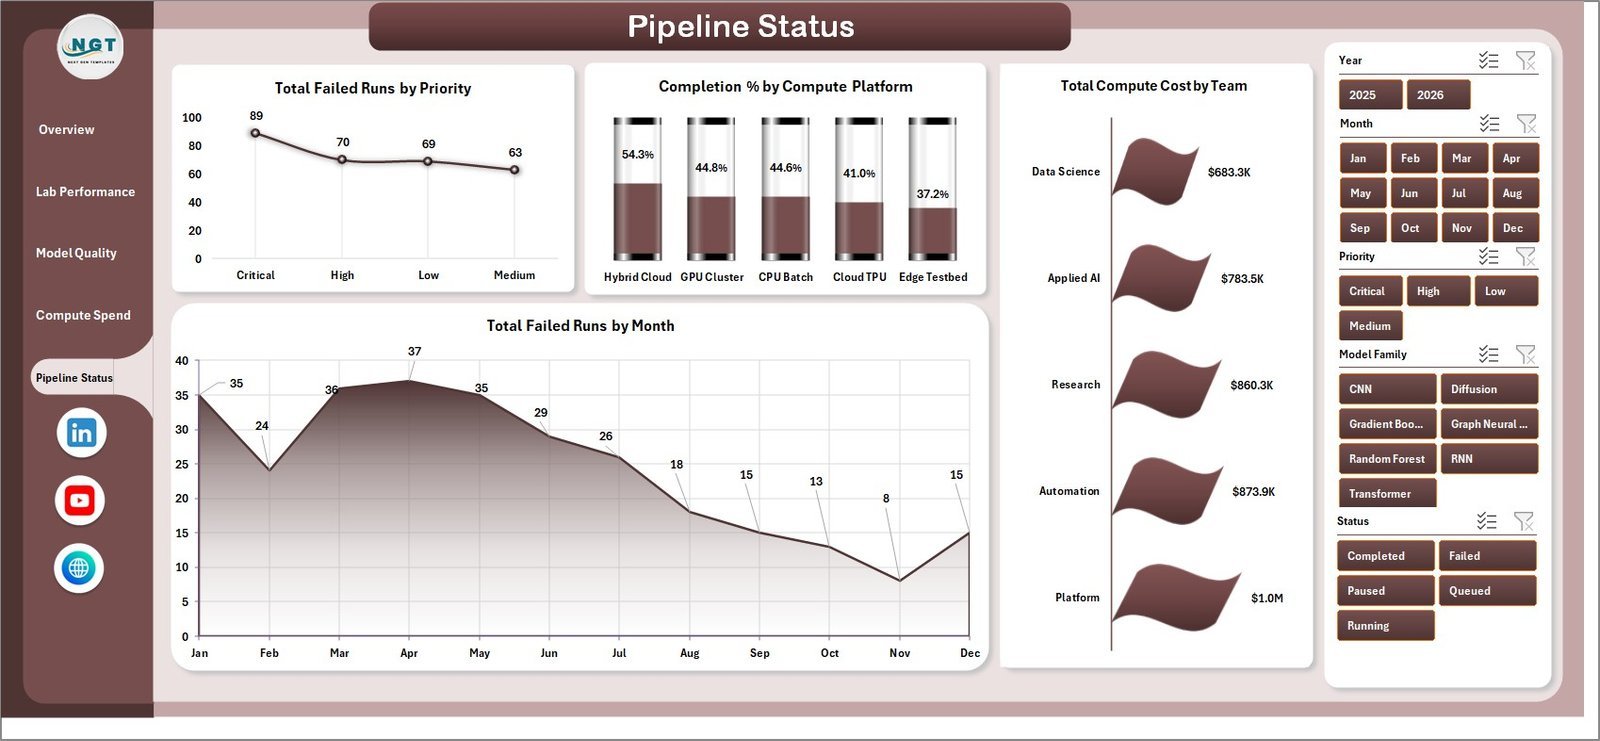
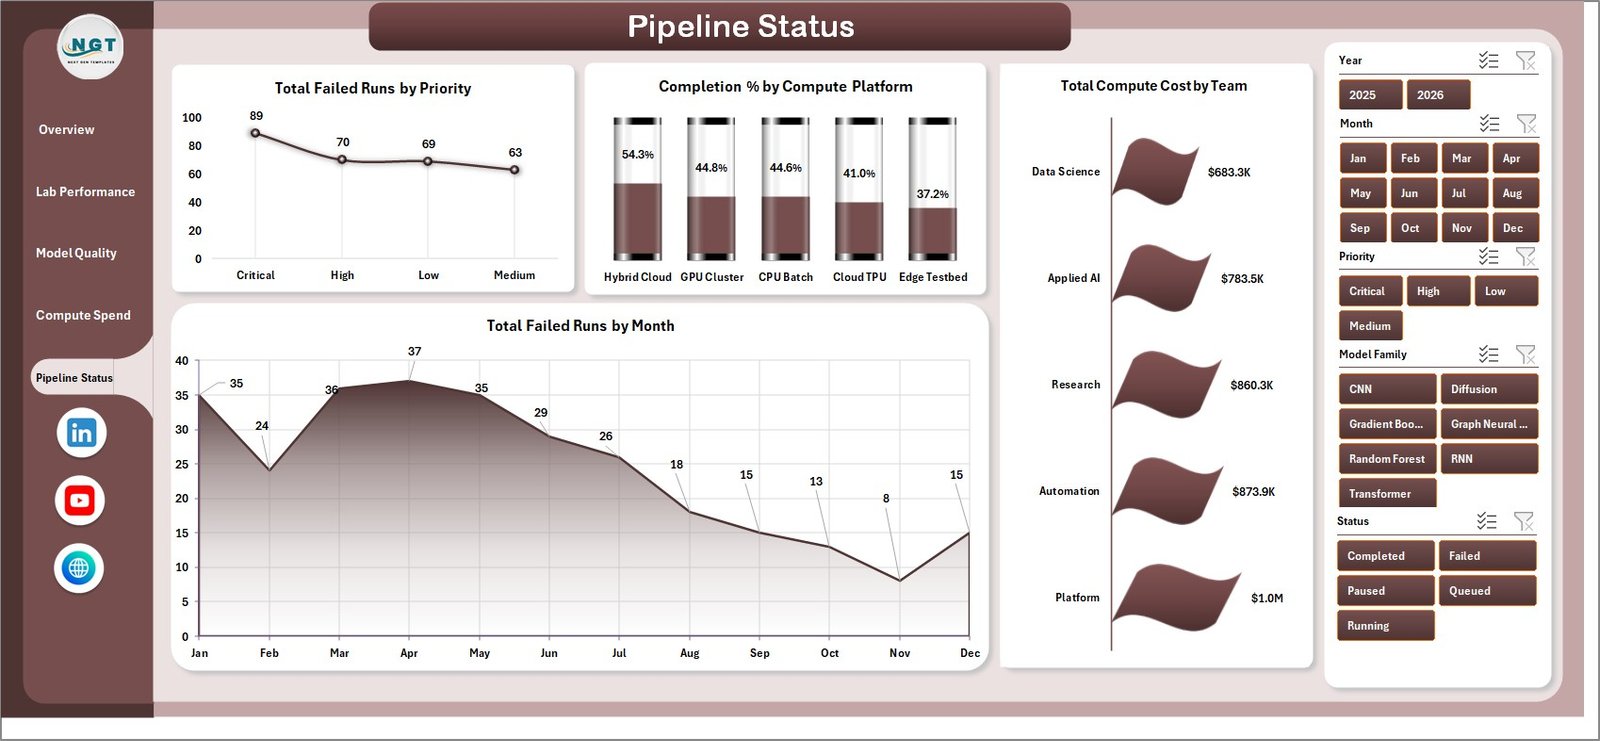
The Pipeline Status tab focuses on operational risk and execution health. It includes Total Failed Runs by Priority, Completion % by Compute Platform, Total Failed Runs by Month, and Total Compute Cost by Team.
6. Data Sheet Tab
The Data Sheet is where users add machine learning lab records in the same column format. Keep the structure intact, paste new records, and refresh the workbook to update every card, chart, slicer, and pivot.

7. Support Sheet
The Support Sheet contains the pivot tables that create the dashboard dynamically. After changing the Data Sheet, go to the Excel Ribbon, open the Data tab, and click Refresh All. You can keep this sheet hidden during normal use.

Machine Learning Labs Dashboard in Excel vs. Google Sheets vs. Paid CRM/SaaS – Where This Fits
| Feature | This Excel Dashboard | Google Sheets Alternative | Paid ML Ops or SaaS Alternative |
|---|---|---|---|
| Cost | $17.99 one-time | Low tool cost, but requires build time | $50-$500+ per user per month |
| Platform | Microsoft Excel | Browser spreadsheet | Vendor cloud app |
| Setup time | Under 10 minutes | 30-90 minutes if built manually | Days or weeks of configuration |
| Real-time team collaboration | Possible with OneDrive or SharePoint | Native collaboration | Usually available by paid seats |
| Mobile access | Excel mobile with limits | Google Sheets mobile | Usually available |
| Customizable fields | Fully editable workbook | Editable but formulas can break | Limited by vendor settings |
| Share with link | Possible with OneDrive or SharePoint | Native link sharing | Login controlled |
| Year-1 cost at 5 users | $17.99 total | Low tool cost plus build time | $3,000-$30,000+ |
| ML lab reporting depth | Experiment, accuracy, spend, pipeline, and lab analysis included | Must be built | Depends on vendor module |
Who This Template Is For – and Who It’s Not For
This template is for machine learning lab managers, AI research leads, data science team heads, ML platform teams, innovation hubs, academic research labs, and consultants who need a practical Excel reporting layer for experiment and compute tracking.
It is not a replacement for a live experiment tracking platform, model registry, feature store, code repository, automated deployment pipeline, or cloud billing system. If you need API sync, lineage, CI/CD, or governance workflows, use this workbook as a reporting dashboard rather than the core ML platform.
How to Use the Machine Learning Labs Dashboard in Excel
- Download and unzip the Excel dashboard file.
- Open the workbook in Microsoft Excel 2016 or later.
- Go to the Data Sheet and replace the sample records with your own lab data.
- Keep the same column structure so the pivots continue to work.
- Click Data > Refresh All in the Excel Ribbon.
- Use the slicers to filter by lab, team, priority, model family, project type, month, status, and compute platform.
Real-World Use Cases
Anika, ML operations lead, reviews compute cost, training hours, failed runs, and completion percentage before the weekly platform review.
Rahul, data science manager, uses the Lab Performance and Model Quality pages to compare teams, model families, accuracy lift, and deployment candidates.
Maria, research director, checks monthly compute spend and experiment status before deciding where to allocate GPU budget for the next cycle.
Frequently Asked Questions
What does this dashboard track?
It tracks compute cost, training hours, experiments, model accuracy, deployment candidates, completion percentage, satisfaction score, accuracy lift, failed runs, status, priority, labs, teams, platforms, project types, and model families.
Do I need macros?
No. The dashboard is built with native Excel tables, pivot tables, charts, and slicers.
How do I refresh the dashboard?
Update the Data Sheet, then use Data > Refresh All in Excel. The Support Sheet pivots and dashboard charts refresh together.
Can I customize the fields?
Yes. You can edit the workbook, but keep a backup before changing pivot source fields, calculated columns, or chart structures.
Is this suitable for AI research labs?
Yes. It is suitable for academic labs, enterprise AI teams, consulting groups, and innovation units that track structured experiment data.
Does it connect directly to cloud platforms?
No direct connector is included. Export or prepare your data, paste it into the Data Sheet, and refresh the workbook.
About the Author
Built by PK – Microsoft Certified Professional with 15+ years of Excel, Google Sheets, and Power BI experience. Founder of NextGenTemplates, reaching 300K+ subscribers across YouTube channels. Every template is hand-built and tested before release.
Explore Related Templates
- Machine Learning Labs KPI Dashboard in Excel – KPI-focused ML lab performance tracking.
- Machine Learning Labs KPI Dashboard in Power BI – Power BI version for ML KPI monitoring.
- Data Science and Analytics KPI Dashboard in Excel – analytics team KPI reporting.
- Browse Excel Dashboard templates.
Ready to turn machine learning lab data into clear Excel reports? Download the Machine Learning Labs Dashboard in Excel and start tracking experiments, model quality, compute spend, and pipeline status today.
Watch the step-by-step video tutorial:
Compatibility and Requirements
- Works in Microsoft Excel desktop (Excel 2016 or later, or Microsoft 365).
- The dashboard uses slicers to filter by lab, team, priority, model family, project type, month, status and compute platform. Microsoft explains them in Use slicers to filter data.
Related Machine Learning and Data Science Templates
- Machine Learning Labs Dashboard in Power BI: the same lab dashboard in Power BI
- AI and Machine Learning KPI Scorecard in Excel: a scorecard view of AI and ML metrics
- AI & Machine Learning KPI Dashboard in Excel: a KPI-focused Excel dashboard for AI teams
- AI & Machine Learning KPI Dashboard in Google Sheets: the Google Sheets edition
Browse all Excel IT templates.
















Reviews
There are no reviews yet.