


Generative video looks like a software business until the compute bill arrives. Revenue per project is easy to report; what decides AI Video Generation Firms Dashboard in Excel whether the firm survives is the gap between that revenue and what the render actually cost, plus how many of those generated videos a client accepted rather than sent back. The AI Video Generation Firms Dashboard in Excel puts both on the same pages: 5 dashboard pages, 20 charts, page-synced slicers on Year, Month, Firm, Region and Client Type, and a sample dataset of 500 projects and 65,500 generated videos across 8 firms, 7 video categories, 4 output resolutions, 4 model tiers and 5 client types. Revenue against compute cost, profit margin per firm, approval rate against videos generated, render minutes by resolution, on-time delivery by region. Built by PK, a Microsoft Certified Professional with 15+ years in Excel and Power BI and 300K+ subscribers across two YouTube channels. Unzip, open in Excel, paste your own export over the sample data, refresh, and every page follows. No macros, no add-in, no subscription.
Key Features of the AI Video Generation Firms Dashboard in Excel
- Compute cost beside revenue, everywhere. Total Revenue vs Total Compute Cost appears by month, by quarter and by firm. In a generative business this is the pairing that matters – a firm can grow revenue and lose money on exactly the projects that grew it. AI Video Generation Firms Dashboard in Excel
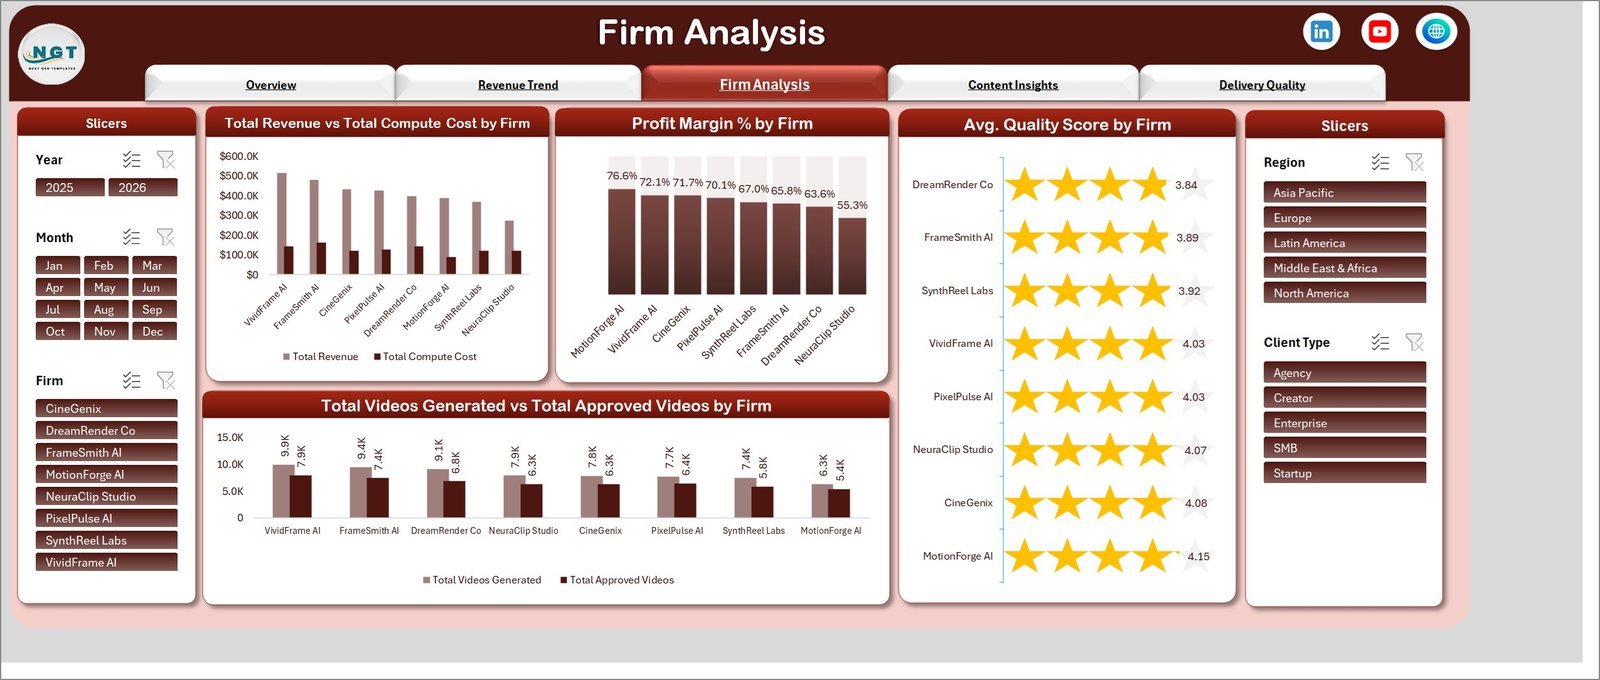
- Profit margin per firm, calculated. Profit Margin % by Firm ranks all eight from best to worst on the numbers rather than on reputation. In the sample data the spread runs from roughly 55% to 77%, which is the difference between a good business and a marginal one.
- Approval rate, not just output. Total Videos Generated vs Total Approved Videos by Firm sets what was produced against what a client accepted. A high generation count with a low approval rate is compute spent twice.
- Quality score as a star rating. Avg Quality Score by Firm and Avg Quality Score vs Approval Rate % by Client Type, so quality and acceptance are read together rather than separately.
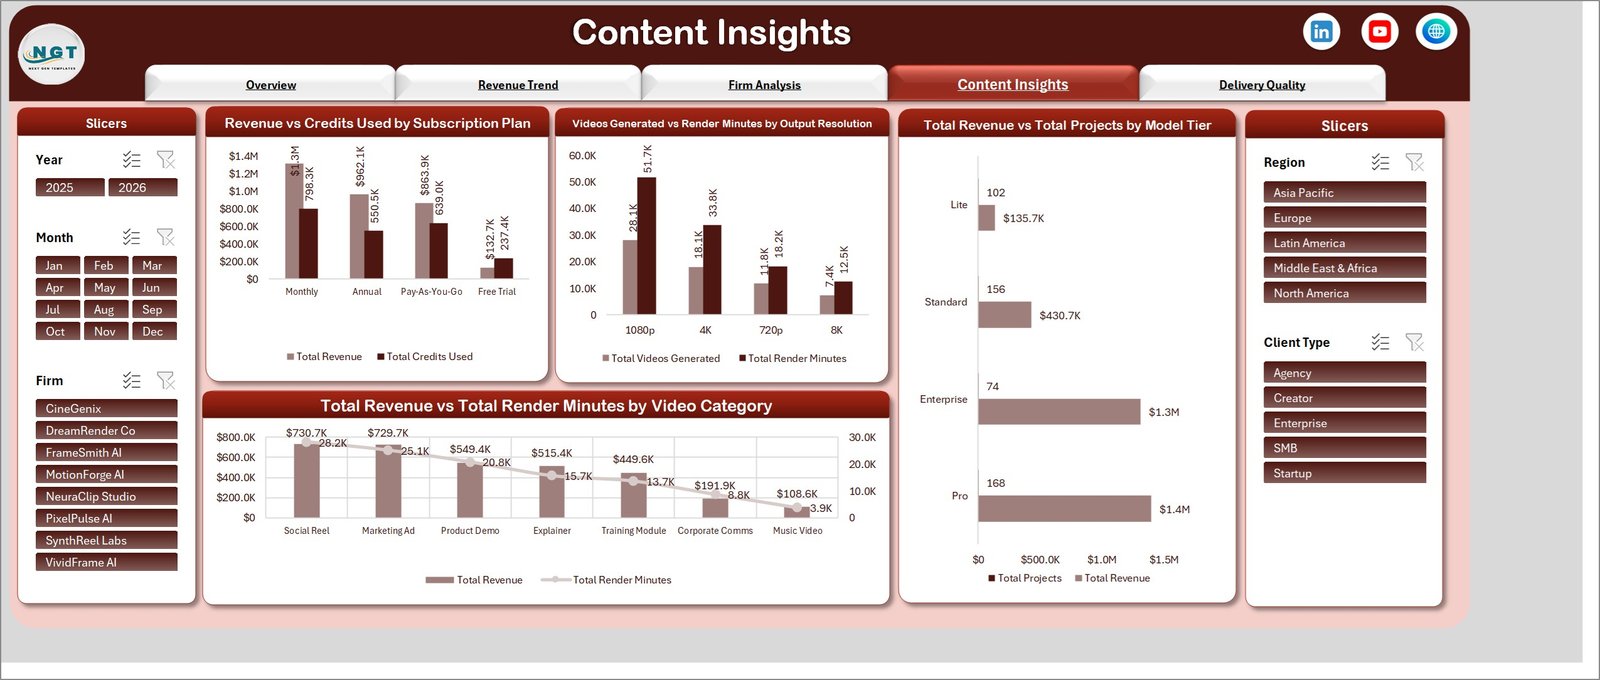
- Render minutes by output resolution. Videos Generated vs Render Minutes across 1080p, 4K, 720p and 8K. Higher resolutions consume render time out of all proportion to their volume, and this is the chart that makes the case for a resolution policy.
- Model tier economics. Total Revenue vs Total Projects by Model Tier across Lite, Standard, Pro and Enterprise, so you can see which tier earns per project rather than in aggregate.
- Subscription plan analysis. Revenue vs Credits Used across Monthly, Annual, Pay-As-You-Go and Free Trial – including how much credit the free tier consumes.
- Video category performance. Total Revenue vs Total Render Minutes across Social Reel, Marketing Ad, Product Demo, Explainer, Training Module, Corporate Comms and Music Video.
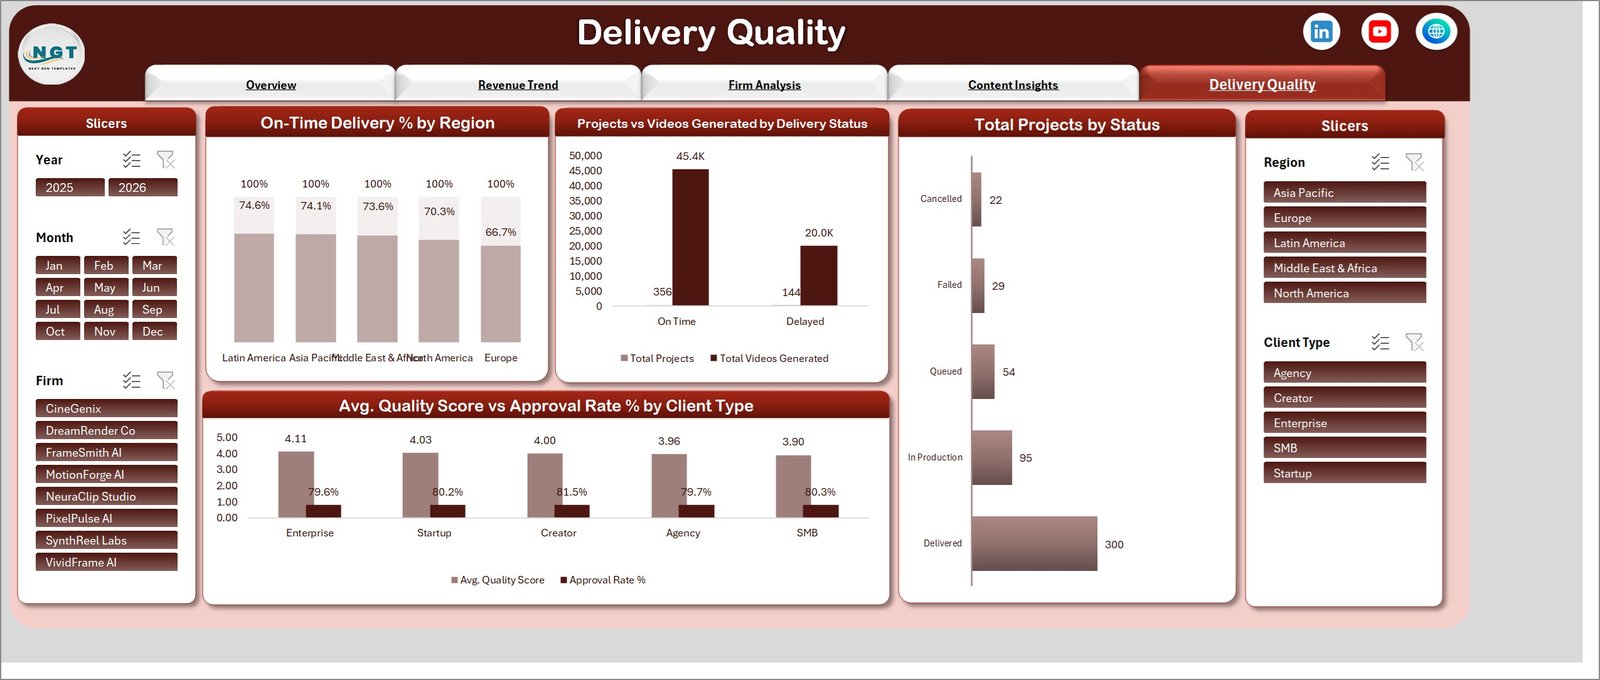
- Delivery discipline. On-Time Delivery % by Region, Projects vs Videos Generated by Delivery Status, and Total Projects by Status across Delivered, In Production, Queued, Failed and Cancelled.
- Client type comparison. Enterprise, Agency, SMB, Startup and Creator on revenue, gross profit, quality and approval rate.
- Page-synced slicers. Year, Month and Firm on the left; Region and Client Type on the right. Every page carries the same set, so a filter means the same thing wherever you are. AI Video Generation Firms Dashboard in Excel
What’s Inside the AI Video Generation Firms Dashboard
Five dashboard pages behind a navigation strip, plus the data and support sheets that feed them AI Video Generation Firms Dashboard in Excel
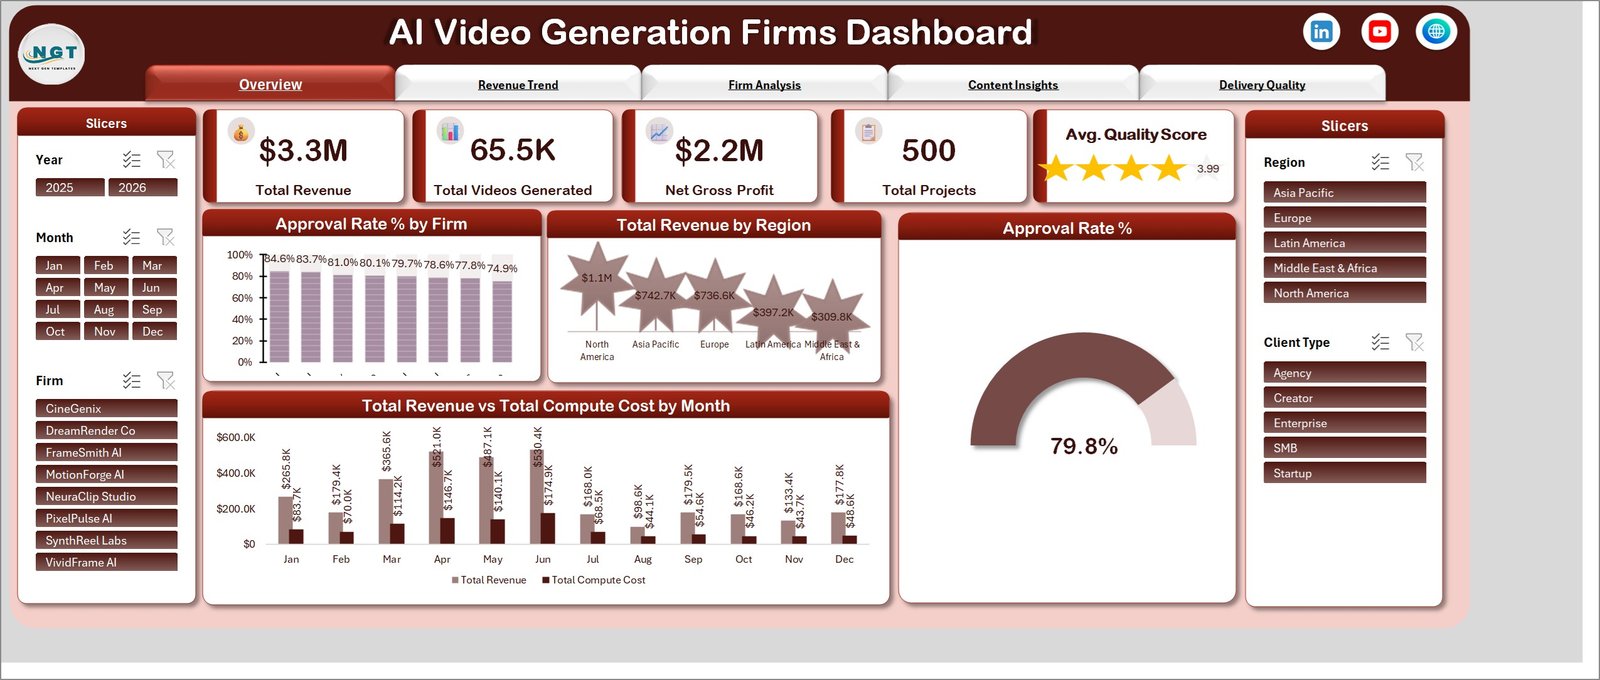
1. Overview. Total Revenue, Total Videos Generated, Net Gross Profit, Total Projects and Avg Quality Score as KPI cards, with Approval Rate % by Firm, Total Revenue by Region, an overall Approval Rate % gauge, and Total Revenue vs Total Compute Cost by Month.
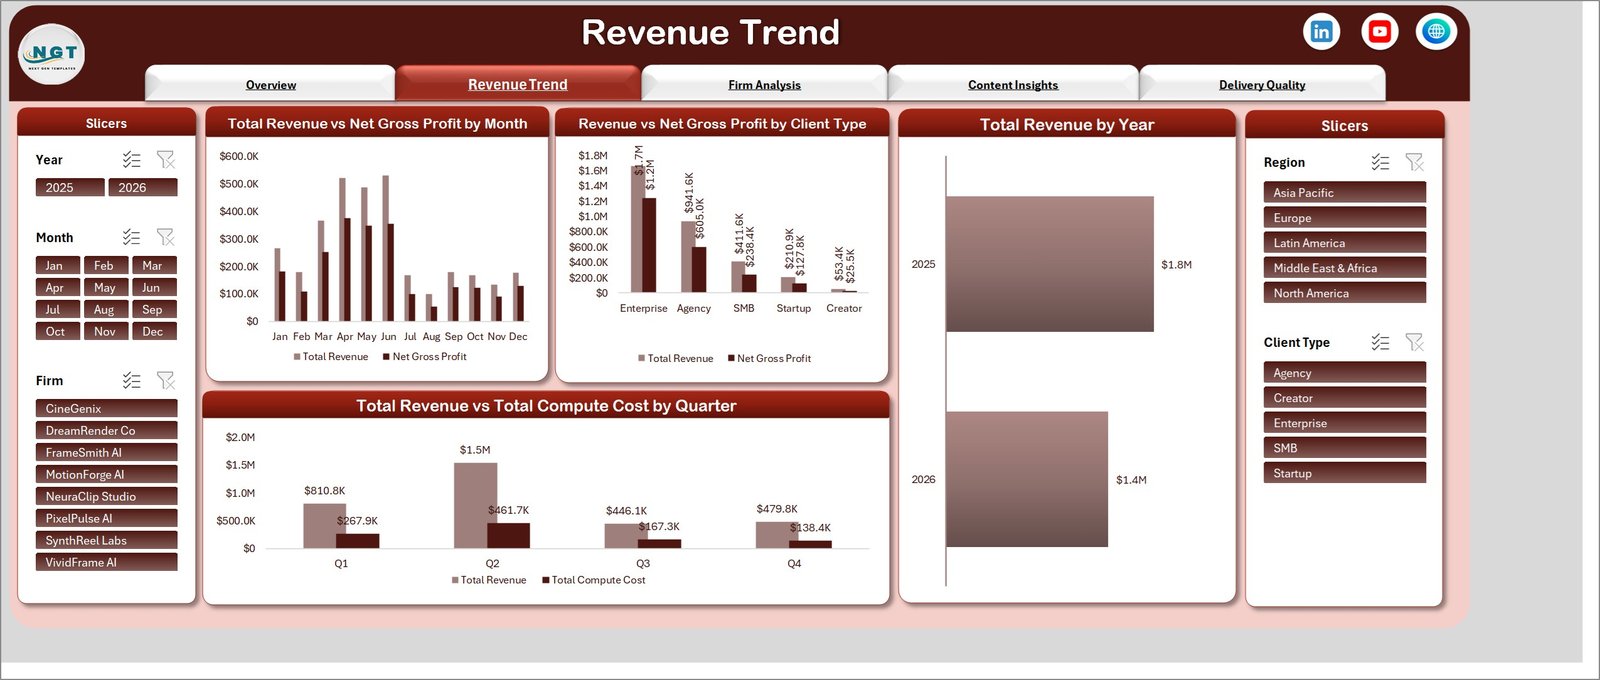
2. Revenue Trend. Total Revenue vs Net Gross Profit by Month, Revenue vs Net Gross Profit by Client Type, Total Revenue by Year, and Total Revenue vs Total Compute Cost by Quarter. The client-type chart is the one to study: enterprise work carries the largest absolute margin, but the gap between revenue and profit narrows sharply as you move down to creator accounts.
3. Firm Analysis. Total Revenue vs Total Compute Cost by Firm, Profit Margin % by Firm, Avg Quality Score by Firm as star ratings, and Total Videos Generated vs Total Approved Videos by Firm. Four views of the same eight competitors, which is enough to rank them honestly.
4. Content Insights. Revenue vs Credits Used by Subscription Plan, Videos Generated vs Render Minutes by Output Resolution, Total Revenue vs Total Projects by Model Tier, and Total Revenue vs Total Render Minutes by Video Category. This is the page that connects what customers ask for to what it costs to produce.
5. Delivery Quality. On-Time Delivery % by Region, Projects vs Videos Generated by Delivery Status, Total Projects by Status, and Avg Quality Score vs Approval Rate % by Client Type.
Behind the pages sit the data sheet holding one row per project and a support sheet carrying the pivot tables the charts read. Replace the sample rows with your own export, keep the headers, refresh, and all five pages update together.
AI Video Generation Firms Dashboard vs. a Google Sheets Build vs. a BI Platform – Where This Fits
| This Excel dashboard | A Google Sheets build | A BI platform deployment | |
|---|---|---|---|
| Cost | 17.99 once | Free, plus your build time | Licence plus an analyst’s time |
| Platform | Microsoft Excel, desktop | Google Sheets, any browser | Vendor web app |
| Setup time | Under 30 minutes with your export | 2 to 4 days for five pages | Weeks, including a data model |
| Real-time team collaboration | Through OneDrive co-authoring | Yes, native sharing | Per paid seat |
| Mobile access | Limited | Yes, free Sheets app | Yes |
| Customizable metrics | Yes – every pivot and chart is editable | Yes, if you build them | Yes, with development effort |
| Compute cost against revenue | Built in, four ways | Build it yourself | Only if the cost data is modelled |
| Compares several firms in one view | Yes – it reads a data sheet | Yes | Yes |
| Works offline | Yes | No | No |
| Time to a first usable answer | The same afternoon | A few days | Weeks |
The honest position: a BI platform will scale further and refresh automatically. This workbook earns its place when you need the answer this week rather than next quarter, when the compute-cost data lives in a finance export rather than a warehouse, or when an investor wants a self-contained file rather than a dashboard login.
Who This Template Is For – and Who It’s Not For
A good fit if you are: running or investing in a generative video studio and need unit economics rather than headline revenue; a founder preparing a board pack that has to show margin after compute; an analyst benchmarking several AI video vendors on the same measures; an agency owner deciding which model tier and resolution to standardise on; a consultant sizing the AI video market with structured comparison data.
Not the right tool if you are: looking for live pipeline monitoring – this is a weekly or monthly reporting workbook; expecting the data to be supplied, since it ships with sample data and you bring your own; or running a single-person operation with a handful of projects, where the pattern will not be visible in any chart AI Video Generation Firms Dashboard in Excel
How to Use the AI Video Generation Firms Dashboard
- Unzip the download and open the workbook in Microsoft Excel. Nothing to install and no macros to enable.
- Read the sample data first. Five pages of a working two-year picture show you what each chart is meant to say before you replace anything.
- Export your project data and paste it onto the data sheet, keeping the existing column headers so the pivots and charts stay connected. Compute cost per project is the field most firms have to go and find – it is worth the effort, because half this dashboard depends on it.
- Refresh all (Data, then Refresh All) so every pivot picks up the new rows.
- Check the Overview page. Total revenue, videos generated and project count will tell you within seconds whether the import landed correctly.
- Start with Profit Margin % by Firm. It is the fastest way to see whether the ranking you assumed matches the one the numbers produce.
- Then look at render minutes by resolution. If 4K and 8K are consuming render time out of proportion to their share of output, you have a pricing or policy decision rather than an engineering one.
- Use the slicers to compare like with like. Filter to one client type or one region and every chart on the page moves together.
Real-World Use Cases
Finding the unprofitable client tier. Revenue vs Net Gross Profit by Client Type showed enterprise work at roughly 1.7M revenue against 1.2M profit, while creator accounts sat at a fraction of the volume with a proportionally thinner margin. The studio kept the creator tier as a funnel but stopped treating it as a revenue line.
Setting a resolution policy. Videos Generated vs Render Minutes by Output Resolution showed 1080p carrying the largest volume, while 4K consumed render minutes far out of proportion to its share. The result was a surcharge on 4K and above rather than a flat per-video price.
Benchmarking eight competitors. Profit Margin % by Firm spread from about 55% to 77% on comparable revenue. Cross-referencing with approval rate showed the lowest-margin firm also had the weakest approval rate – the same problem showing up twice, and a clear signal about where the compute was going.
Frequently Asked Questions
Which version of Excel do I need?
Excel 2016 or later on Windows, or Microsoft 365. The workbook uses ordinary pivot tables, charts and slicers.
Are there macros?
No. It is a plain .xlsx workbook, so there is no macro warning and nothing for a corporate policy to block.
Does it come with real market data?
No. It ships with a realistic sample dataset of 500 projects so every chart works out of the box, but the firm names and figures are illustrative. Replace them with your own project export or your own research AI Video Generation Firms Dashboard in Excel
What data do I need to supply?
One row per project with revenue, compute cost, videos generated, approved videos, render minutes, quality score, firm, client type, region, subscription plan, model tier, output resolution, video category, delivery status and date. Compute cost is the field most teams have to dig for, and the one that makes the dashboard worth having AI Video Generation Firms Dashboard in Excel.
Can I add my own firms, tiers or video categories?
Yes. They are values in your data, not hard-coded lists. Paste in your rows, refresh the pivots, and the charts and slicers pick up whatever names you use AI Video Generation Firms Dashboard in Excel
Can I use it in Google Sheets?
Uploading it to Sheets will convert the data but the slicer and chart formatting will not survive intact. It is built for Excel.
Can I change the colours to match my brand?
Yes. The workbook uses standard Excel chart formatting and a single accent colour, so a theme change takes a few minutes rather than a rebuild.
About the Author
Built by PK – Microsoft Certified Professional with 15+ years of Excel, Google Sheets, and Power BI experience. Founder of NextGenTemplates, reaching 300K+ subscribers across YouTube channels. Every template is hand-built and tested before release.
Explore Related Templates
- AI Chatbot Providers Dashboard in Excel – the same vendor-comparison shape for conversational AI.
- AI Chatbot Providers Dashboard in Power BI – with drillthrough and tooltips.
- SaaS Development Dashboard in Excel – for the software side of an AI business.
- Sentiment Analysis Startups Dashboard in Power BI – another AI-sector market view.
- Startup Founder Pack – twelve templates for running the business behind the product.
- Browse every Excel dashboard or the full MS Excel template catalogue.
Get Your Copy
Paste in your last two years of projects and open the Firm Analysis page. If your margin ranking disagrees with your revenue ranking, the compute cost is telling you something worth knowing. If anything does not work as described, contact us and we will put it right. AI Video Generation Firms Dashboard in Excel
Last updated: 12 August 2026.
























Reviews
There are no reviews yet.