Green Building Certification Dashboard in Power BI helps sustainability managers, green building consultants, construction teams, facility leaders, real estate portfolio analysts, and ESG reporting teams track certified projects, building area, energy saved, utility savings, waste diversion, audit score, and certification cost in one ready-to-use Power BI report. According to the International Energy Agency, buildings account for around 30% of global final energy consumption and 26% of global energy-related emissions, so certification tracking is no longer a side report. This template gives you a focused reporting system for LEED, BREEAM, WELL, Green Globes, and similar certification programs without a recurring SaaS fee.
Open the .pbix file in Power BI Desktop, connect or replace the sample data with your own project records, refresh the report, and use slicers to analyze performance by region, level, body, status, building type, consultant, phase, city, year, month, and quarter.
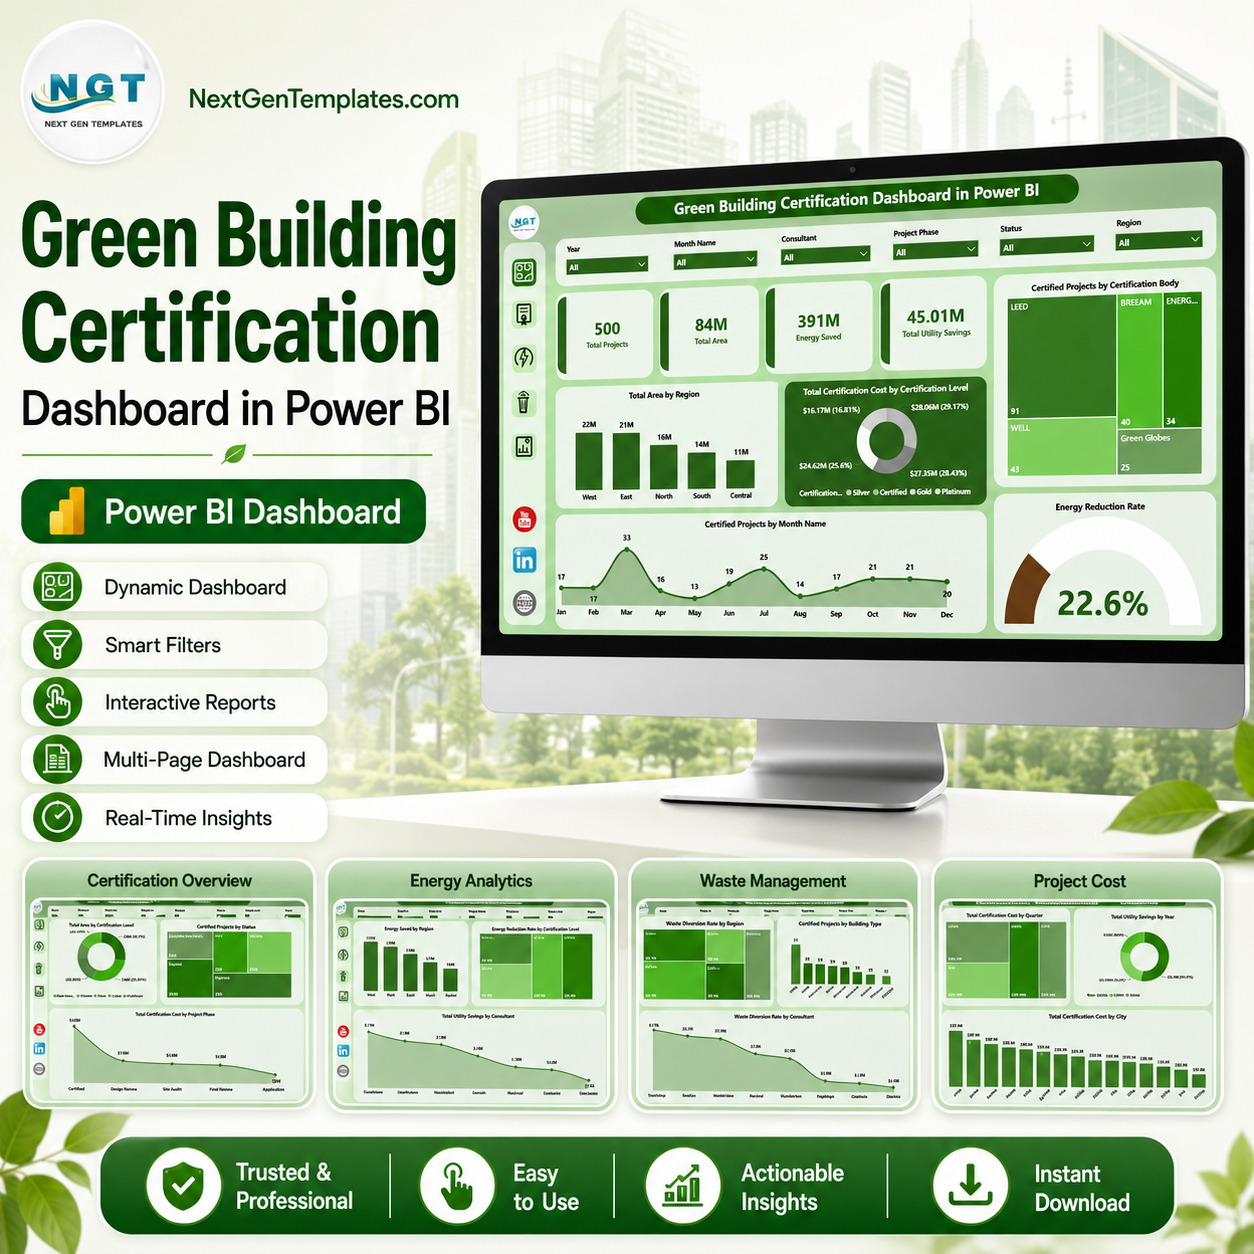
Key Features of Green Building Certification Dashboard in Power BI
- 5 Power BI report pages for Overview, Certification, Energy View, Waste View, and Project Cost analysis.
- Executive KPI cards for Total Projects, Total Area, Energy Saved, and Total Utility Savings.
- Interactive slicers so users can filter the dashboard quickly by available project, date, location, certification, phase, status, and consultant fields.
- Certification analysis by certification level, project status, certification body, project phase, region, and month.
- Energy and utility tracking for energy saved, energy reduction rate, utility savings, and consultant-level performance.
- Waste performance views for waste diversion rate by region, building type, certification body, and consultant.
- Cost and audit score insights by quarter, year, consultant, and city.
- Editable PBIX report so advanced users can adjust visuals, measures, data model fields, and branding in Power BI Desktop.
What’s Inside the Green Building Certification Dashboard in Power BI
1. Overview Page
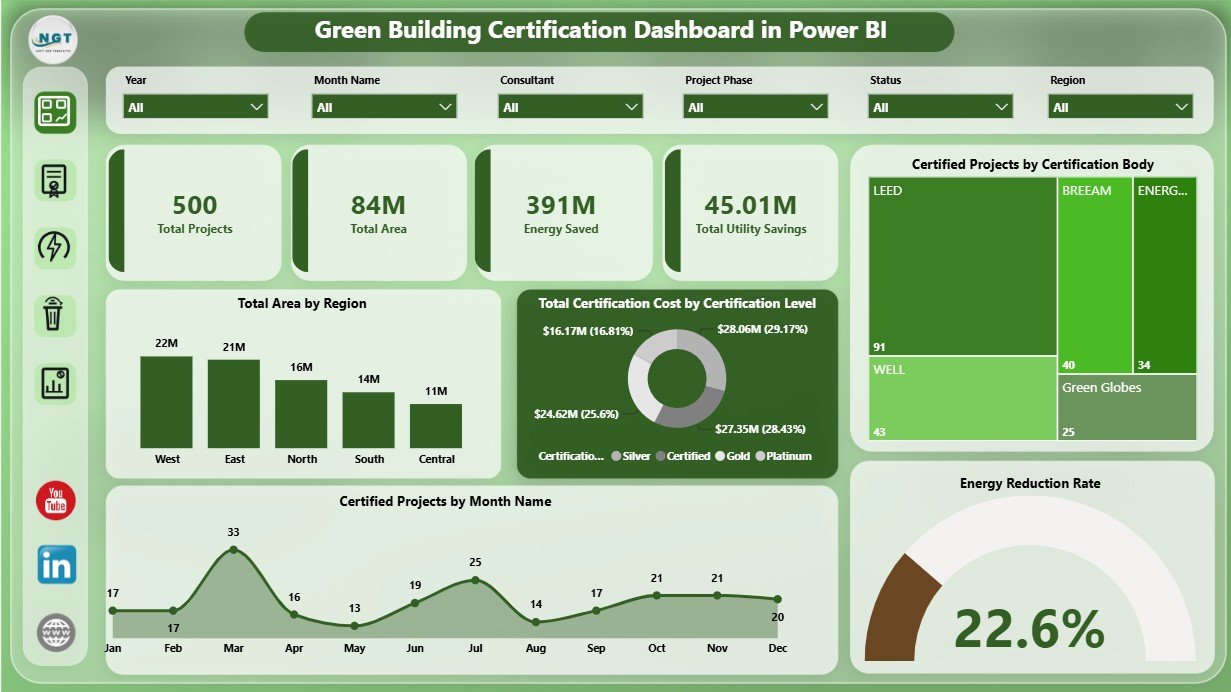
The Overview page gives leaders a fast certification snapshot through cards for Total Projects, Total Area, Energy Saved, and Total Utility Savings. These cards help teams see portfolio scale, environmental impact, and financial benefit before drilling into detailed pages.
Total Area by Region shows where certified square footage is concentrated and helps compare regional certification coverage. Total Certification Cost by Certification Level explains how spend changes across certification tiers, which is useful for budget and ROI discussions.
Certified Projects by Certification Body compares the certification programs or governing bodies used across the portfolio. Certified Projects by Month Name shows certification timing and makes seasonal or reporting-period patterns easier to see. Energy Reduction Rate highlights whether projects are producing measurable efficiency gains.
2. Certification Page
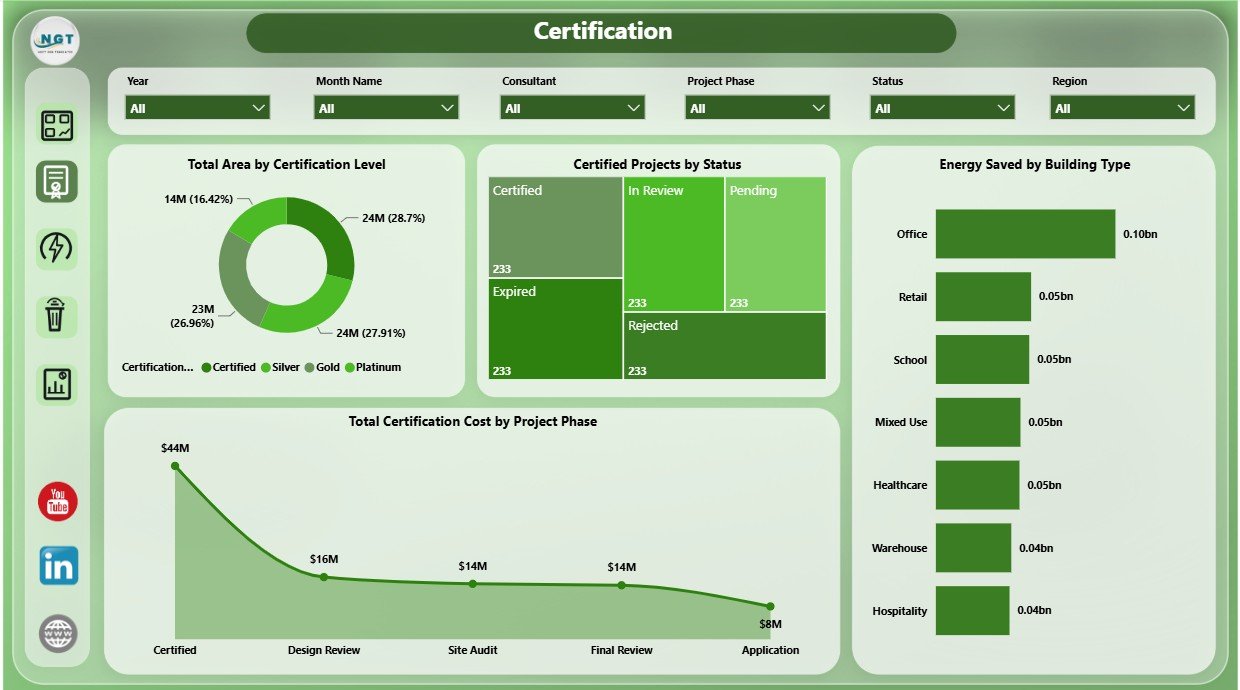
The Certification page focuses on status, project phase, building type, and certification tier. Total Area by Certification Level shows how much space has reached each level, while Certified Projects by Status separates completed, pending, in-progress, and other status groups.
Energy Saved by Building Type helps compare efficiency impact across offices, campuses, industrial buildings, residential assets, or any other building groups in the data. Total Certification Cost by Project Phase shows where cost is concentrated across planning, design, audit, documentation, construction, or completion phases.
3. Energy View Page
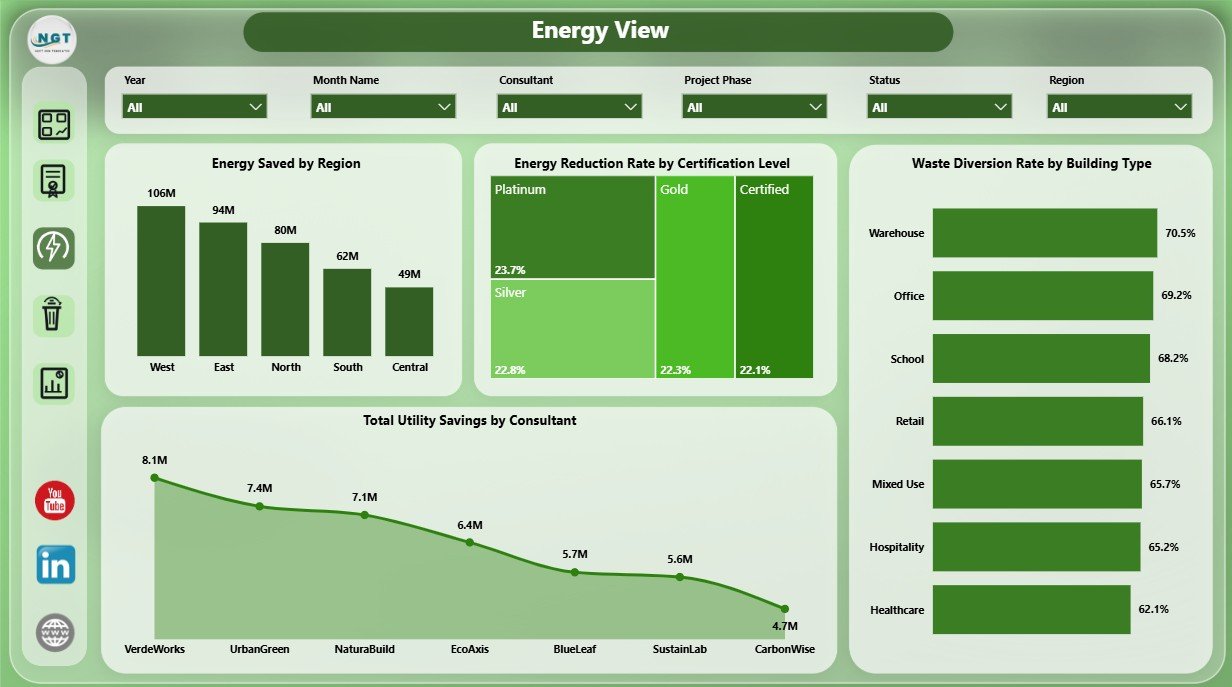
The Energy View page helps users analyze the impact of green building work on energy and cost outcomes. Energy Saved by Region compares efficiency impact across territories, while Energy Reduction Rate by Certification Level shows whether higher levels are linked with stronger energy reduction.
Waste Diversion Rate by Building Type connects energy and waste performance across building groups. Total Utility Savings by Consultant helps teams compare consultant contribution to measurable savings.
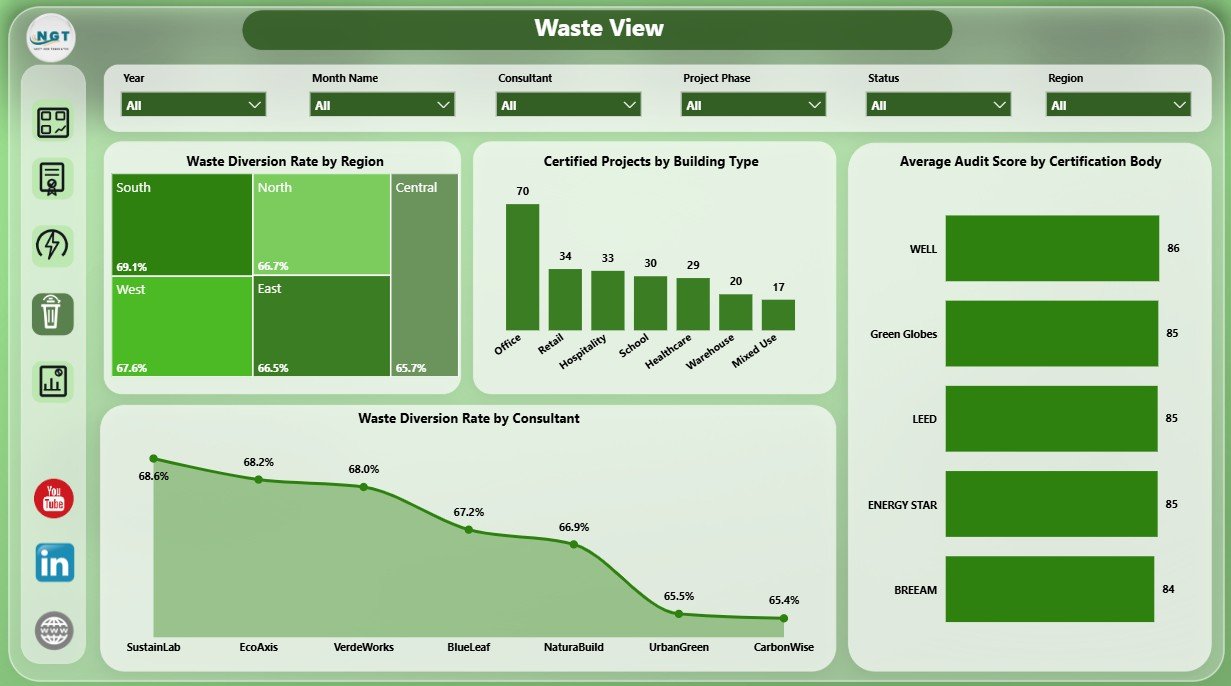
4. Waste View Page
The Waste View page supports circularity and construction waste review. Waste Diversion Rate by Region compares landfill-diversion performance by location. Certified Projects by Building Type shows where certification activity is concentrated across asset groups.
Average Audit Score by Certification Body helps compare quality outcomes by certification route. Waste Diversion Rate by Consultant highlights consultant-level performance and makes follow-up coaching easier.
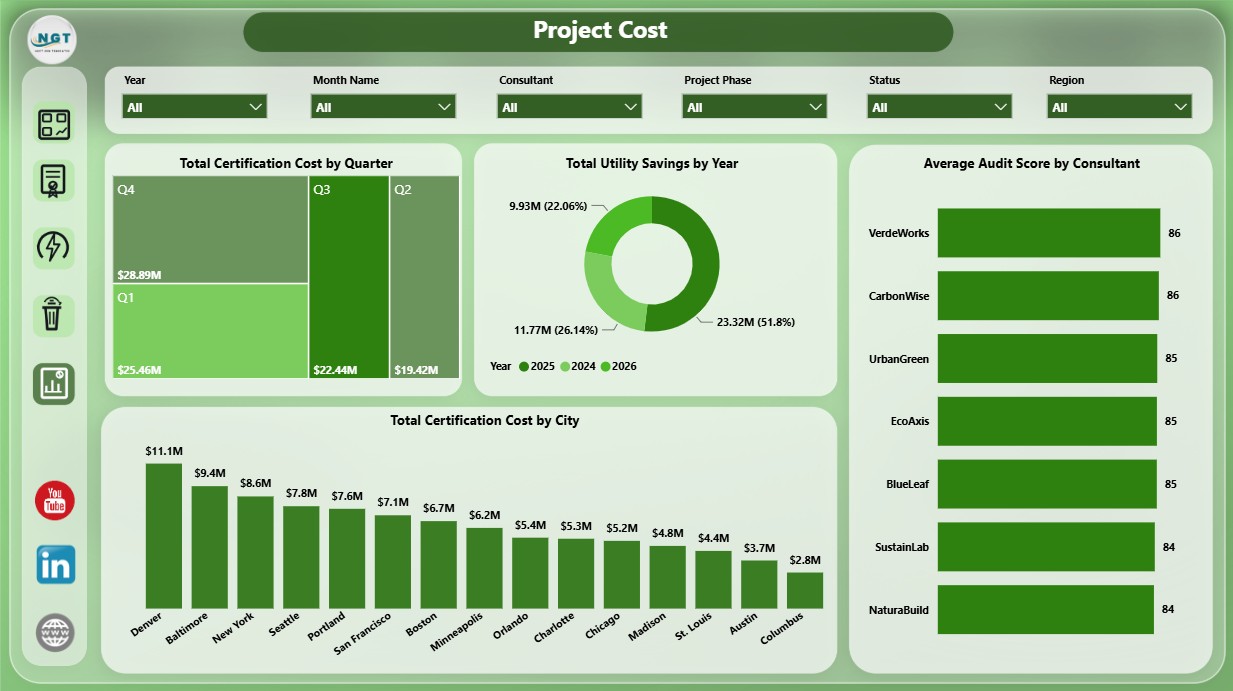
5. Project Cost Page
The Project Cost page is built for spend, savings, and quality review. Total Certification Cost by Quarter shows how spend changes during the year. Total Utility Savings by Year helps teams understand whether green building investments are producing measurable savings over time.
Average Audit Score by Consultant compares consultant quality outcomes, while Total Certification Cost by City identifies cities with the highest certification spend.
Green Building Certification Dashboard in Power BI vs. Tableau vs. Paid ESG SaaS – Where This Fits
| Feature | This Power BI Dashboard | Tableau Alternative | Paid ESG SaaS |
|---|---|---|---|
| Cost | $17.99 one-time | License plus report build time | Monthly or annual subscription |
| Platform | Power BI Desktop | Tableau Desktop or Tableau Cloud | Vendor cloud platform |
| Setup time | Open PBIX, connect or replace data, refresh | Requires model and visual design | Implementation and onboarding |
| Real-time team collaboration | Available through Power BI Service if configured | Available through Tableau Cloud | Usually built in |
| Mobile access | Available after publishing to Power BI Service | Available after publishing | Usually included |
| Customizable fields | Editable report, fields, visuals, and measures | Editable with Tableau skills | Limited by vendor permissions |
| Share with link | Possible through Power BI permissions | Possible through Tableau permissions | Usually role-based login |
| Year-1 cost at 5 users | $17.99 plus any Microsoft licensing | Usually much higher | Often hundreds or thousands |
| Certification-specific analysis | Included across 5 report pages | Must be built or customized | Depends on module |
Who This Template Is For – and Who It’s Not For
This template is for sustainability managers, green building consultants, ESG analysts, construction project managers, facility leaders, architects, engineering consultants, and real estate portfolio teams that need a repeatable Power BI dashboard for certification reporting.
It is not a live building management system, carbon accounting platform, IoT sensor database, LEED submission portal, or automated certification workflow. It works best when you already have project-level certification data and want a clean Power BI reporting layer.
How to Use the Green Building Certification Dashboard in Power BI
- Download and unzip the product file.
- Open the .pbix file in Power BI Desktop.
- Review the sample source structure and replace or connect your own green building certification data.
- Refresh the report so cards, charts, slicers, and pages update.
- Use slicers to filter by region, certification level, body, status, building type, consultant, phase, city, date, and other available fields.
- Start with the Overview page, then use Certification, Energy View, Waste View, and Project Cost pages for deeper review.
Real-World Use Cases
Asha, Sustainability Manager: reviews total projects, certified area, energy saved, and utility savings before monthly ESG leadership meetings.
Daniel, Green Building Consultant: compares audit score, waste diversion, and utility savings by consultant to identify best practices across projects.
Maria, Real Estate Portfolio Analyst: filters the report by city and certification level to explain cost, area, and savings performance to executives.
Frequently Asked Questions
What does this Power BI dashboard track?
It tracks green building certification projects, total area, energy saved, utility savings, certification cost, status, certification body, region, city, consultant, building type, phase, waste diversion rate, audit score, quarter, year, and month.
Do I need Power BI Desktop?
Yes. Open and edit the PBIX file in Power BI Desktop. Online sharing may require Microsoft licensing if you publish it to Power BI Service.
Can I use this for LEED or BREEAM tracking?
Yes. The dashboard is suitable for LEED, BREEAM, WELL, Green Globes, and similar green building certification programs when your data follows the template structure.
Can I customize the report?
Yes. You can edit visuals, fields, slicers, measures, colors, report pages, and data connections in Power BI Desktop.
Is this a subscription?
No. It is a one-time purchase from NextGenTemplates. Any separate Microsoft licensing depends on how you choose to share the report.
About the Author
Built by PK – Microsoft Certified Professional with 15+ years of Excel, Google Sheets, and Power BI experience. Founder of NextGenTemplates, reaching 300K+ subscribers across YouTube channels. Every template is hand-built and tested before release.
Explore Related Templates
Explore more Power BI templates and Power BI Dashboard templates. You may also like the Green Building Certification Dashboard in Excel, Green Building KPI Dashboard in Power BI, and Office Sustainability Dashboard in Power BI.
Download the Green Building Certification Dashboard in Power BI and start reviewing certification progress, cost, energy, waste, and savings in a clean Power BI report.
Last updated: June 18, 2026.
Watch the step-by-step video tutorial:


Reviews
There are no reviews yet.