

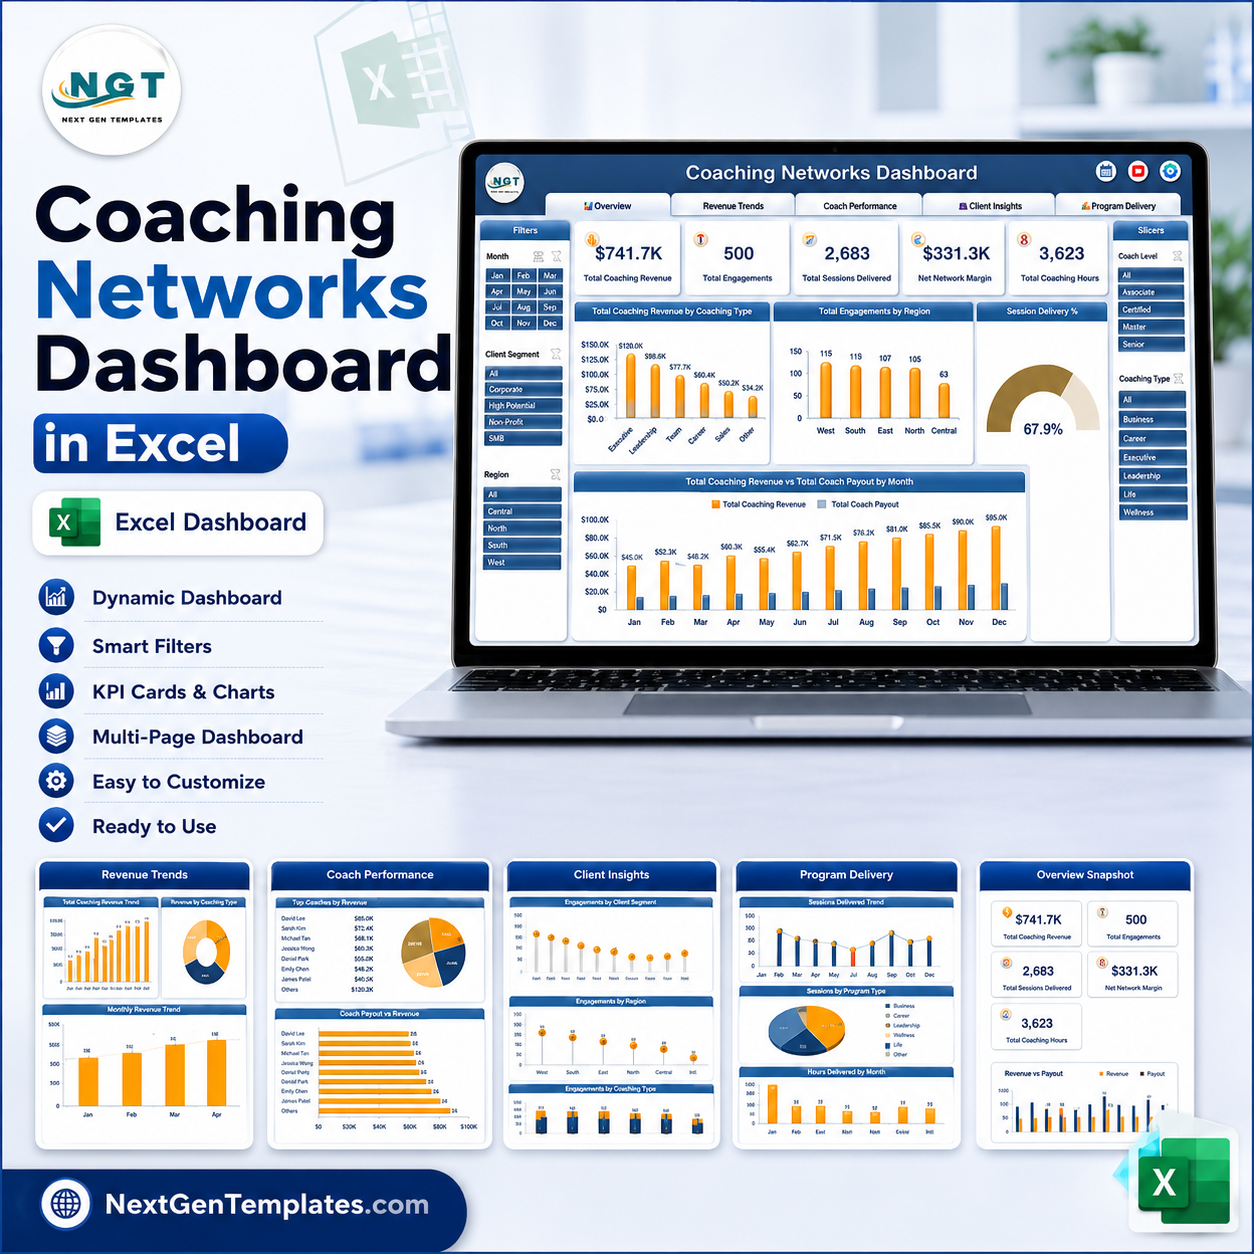
The Coaching Networks Dashboard in Excel turns a flat log of coaching engagements into a five-page analytical report. The sample workbook ships with 500 engagements covering $741.7K of coaching revenue, 2,683 delivered sessions and 3,623 coaching hours, spread across 6 coaching types, 4 coach levels, 4 client segments and 5 regions. Five slicers – Month, Client Segment, Region, Coach Level and Coaching Type – are synced across every page, so a single click re-filters all 20 charts at once. There are no macros, no add-ins and no monthly fee: it is a standard .xlsx that opens in Excel 2016 or later, Microsoft 365 and Excel for Mac. Replace the sample rows with your own and every card, chart and slicer follows.
This is the analytical dashboard for a coaching network – it profiles where revenue, margin and delivery capacity actually sit. If you want a month-picker scorecard with traffic lights and target-versus-actual rows instead, that is a different template family; see the KPI dashboards linked at the end of this page.
Key Features of the Coaching Networks Dashboard in Excel
- Five KPI cards on the Overview page – Total Coaching Revenue, Total Engagements, Total Sessions Delivered, Net Network Margin and Total Coaching Hours, each restated the moment a slicer changes.
- Two slicer rails per page – Month, Client Segment and Region on the left; Coach Level and Coaching Type on the right. All five are page-synced, so filtering on Coach Performance carries through to Program Delivery.
- Revenue and payout side by side – monthly, quarterly and regional views plot Total Coaching Revenue against Total Coach Payout, which is what makes the Net Network Margin figure readable rather than abstract.
- Coach league tables – Top 10 Total Coaching Revenue by Coach and Top 10 Total Engagements by Coach, so the two rankings can be compared for coaches who bill well but carry few clients.
- A session delivery gauge – the 67.9% reading on the sample data is simply 2,683 sessions delivered against 3,949 booked, cross-checkable on the Program Delivery page.
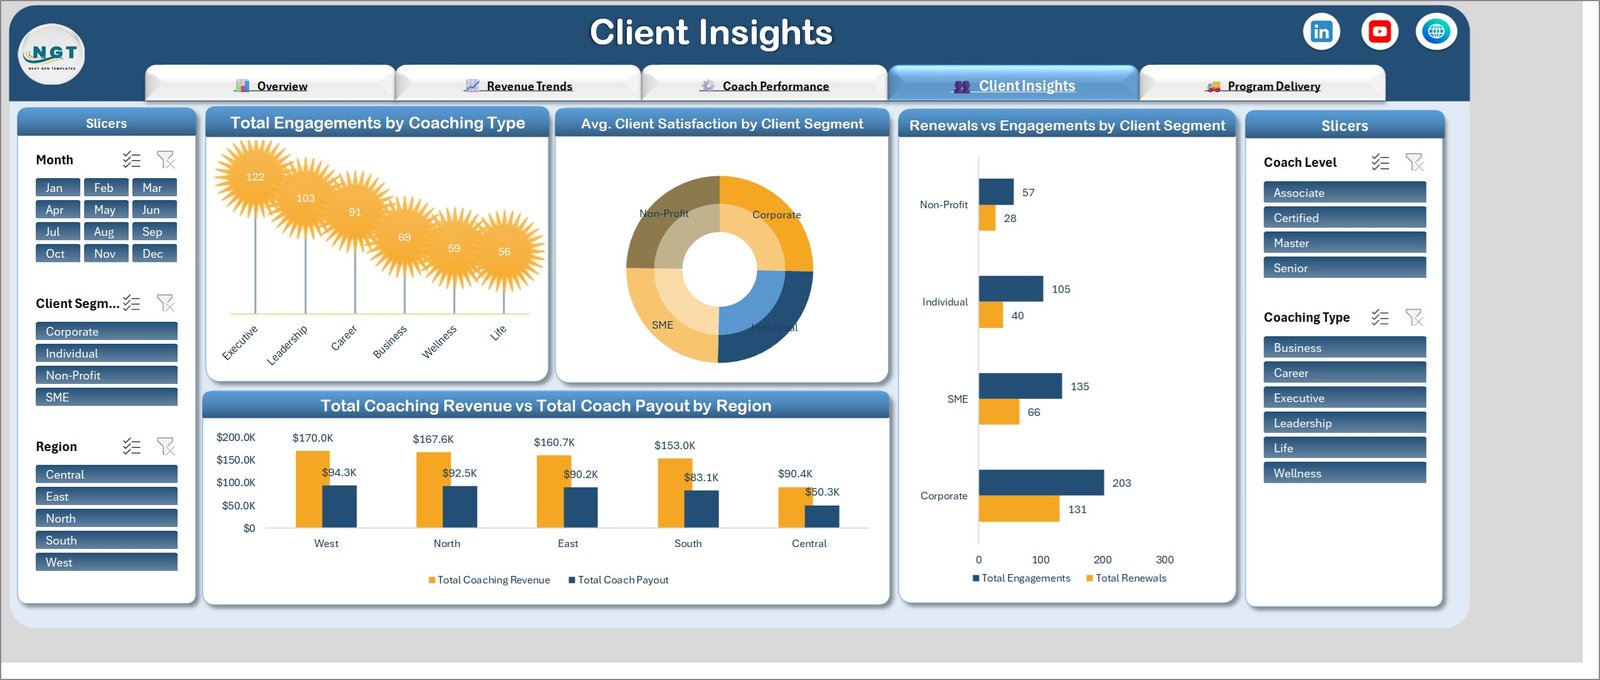
- Renewals against engagements – a paired bar chart by client segment that shows the retention gap per segment rather than a single blended renewal rate.
- Native pivot-table engine – every chart is driven by a pivot on a Support sheet, so adding rows and refreshing is the whole maintenance routine.
What’s Inside the Coaching Networks Dashboard in Excel
Overview
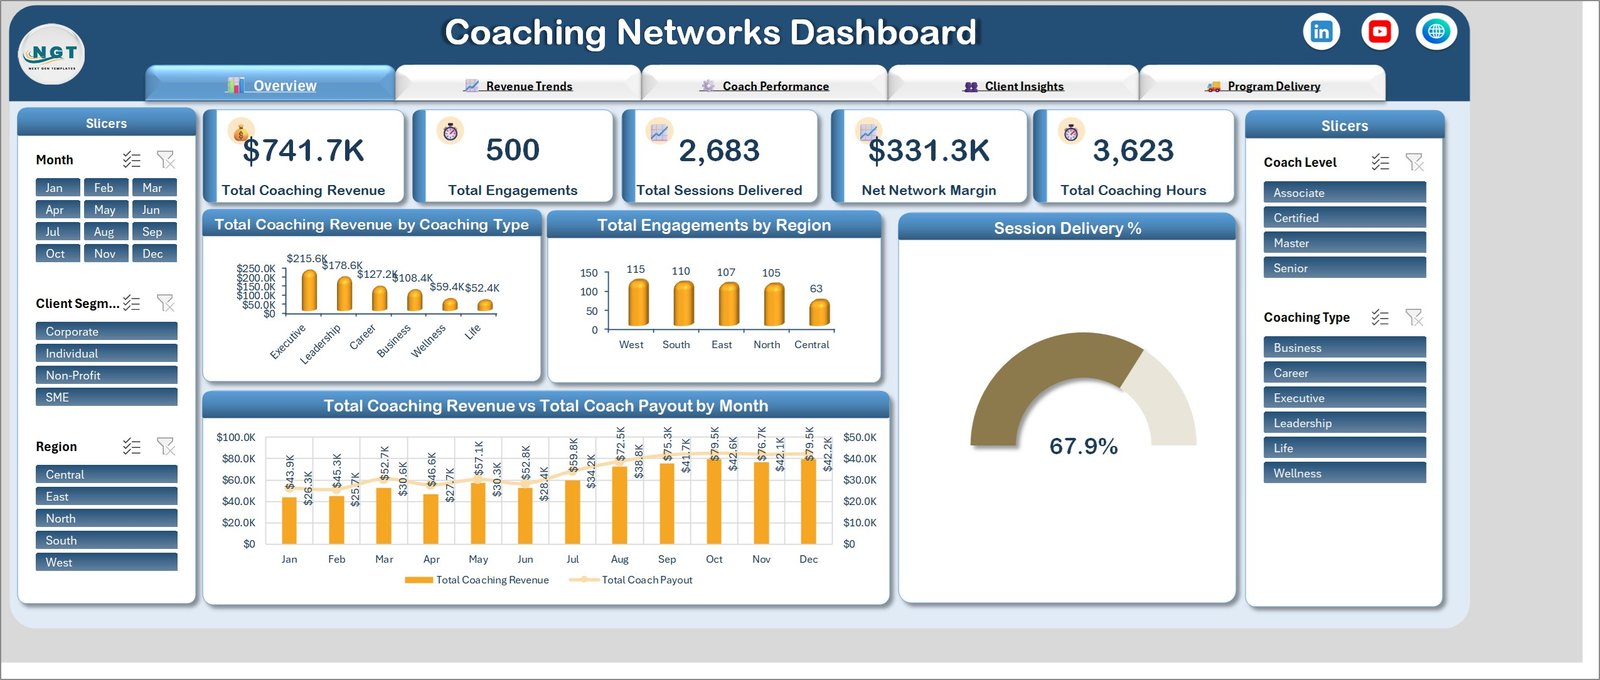
The landing page: five KPI cards across the top, then Total Coaching Revenue by Coaching Type (Executive $215.6K, Leadership $178.6K, Career $127.2K, Business $108.4K, Wellness $59.4K, Life $52.4K), Total Engagements by Region, a Session Delivery % gauge, and a full-width Total Coaching Revenue vs Total Coach Payout by Month combination chart.
Revenue Trends
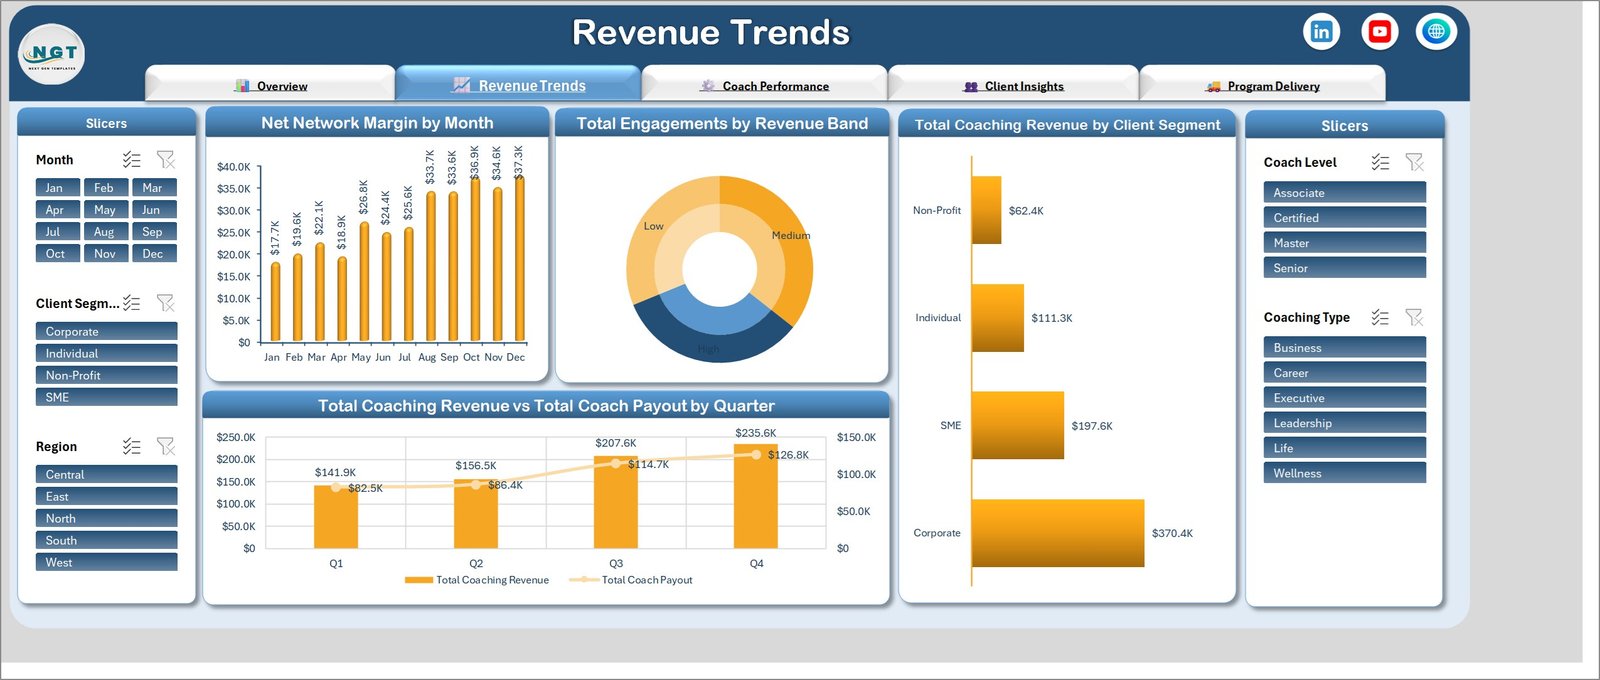
Net Network Margin by Month climbs from $17.7K in January to $37.3K in December on the sample data. Beside it, Total Engagements by Revenue Band splits the book into Low, Medium and High, and Total Coaching Revenue by Client Segment ranks Corporate $370.4K, SME $197.6K, Individual $111.3K and Non-Profit $62.4K. A quarterly revenue-versus-payout chart runs along the bottom.
Coach Performance
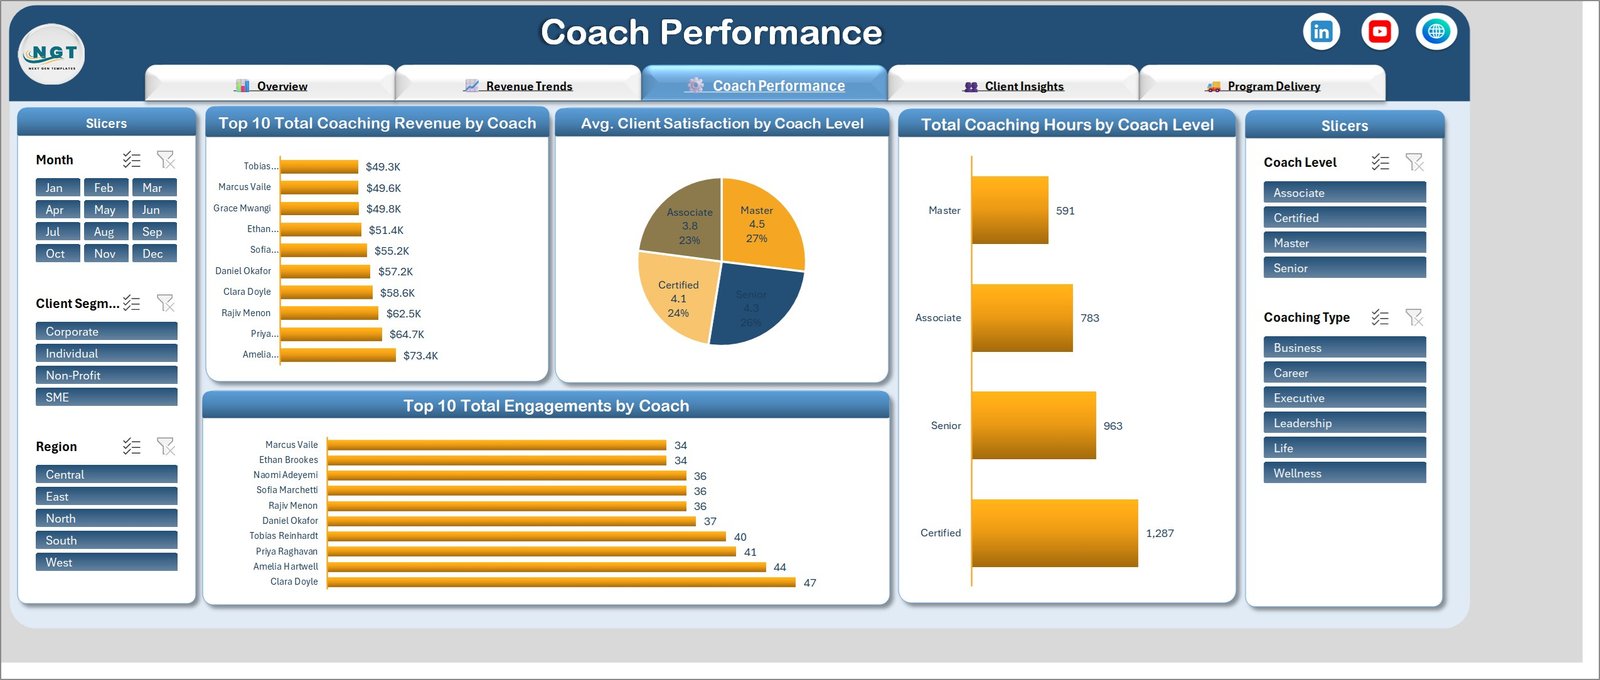
Top 10 Total Coaching Revenue by Coach and Top 10 Total Engagements by Coach sit one above the other, so a coach who bills $73.4K on 44 engagements is easy to separate from one who bills $49.3K on 40. Avg. Client Satisfaction by Coach Level reports 4.5 for Master, 4.3 for Senior, 4.1 for Certified and 3.8 for Associate, and Total Coaching Hours by Coach Level shows where the delivery load sits – Certified coaches carry 1,287 of the 3,623 hours.
Client Insights
Total Engagements by Coaching Type, Avg. Client Satisfaction by Client Segment, and Renewals vs Engagements by Client Segment – where Corporate shows 203 engagements against 131 renewals and Non-Profit shows 57 against 28. Underneath, Total Coaching Revenue vs Total Coach Payout by Region compares all five regions on one axis.
Program Delivery
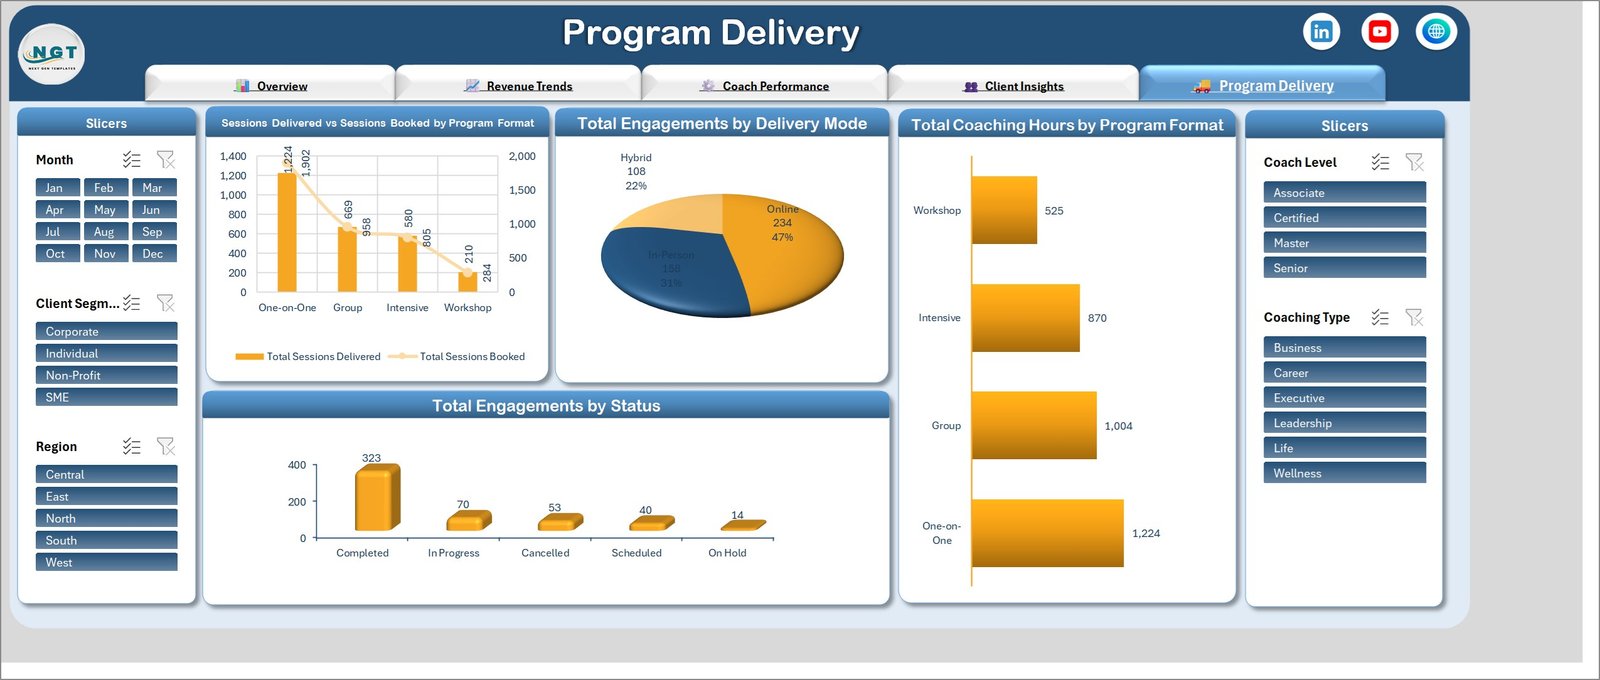
Sessions Delivered vs Sessions Booked by Program Format is the operational page: One-on-One 1,224 delivered against 1,902 booked, Group 669 against 958, Intensive 580 against 805, Workshop 210 against 284. Total Engagements by Delivery Mode splits Online 234, In-Person 158 and Hybrid 108; Total Coaching Hours by Program Format and Total Engagements by Status complete the page.
Coaching Networks Dashboard in Excel vs. Google Sheets vs. Paid Coaching Platforms – Where This Fits
| This Excel dashboard | Google Sheets build | Paid coaching platform | |
|---|---|---|---|
| Cost | One payment, no renewal | Free tool, your build time | Roughly $20-$80 per coach per month |
| Platform | Excel 2016+, Microsoft 365, Excel for Mac | Browser | Vendor web app |
| Setup time | Paste your rows and refresh | Days of formula and chart work | Onboarding plus data migration |
| Real-time team collaboration | Via OneDrive or SharePoint co-authoring | Yes, native | Yes, native |
| Mobile access | Excel mobile app, view-oriented | Yes | Yes |
| Customizable fields | Any column you add becomes a pivot field | Yes, if you rebuild the pivots | Limited to the vendor’s schema |
| Share with a link | Yes, via cloud storage | Yes | Yes |
| Year-1 cost at 5 users | The purchase price, once | Your time | Commonly $1,200-$4,800 |
| Coach payout vs revenue view | Built in on three pages | Build it yourself | Usually a paid billing add-on |
| Your data leaves your machine | No | Stored in Google Drive | Stored on vendor servers |
Who This Template Is For – and Who It’s Not For
A good fit if you: run a coaching network or a multi-coach practice and already keep engagements in a spreadsheet; need to see revenue against coach payout by month, quarter, region and segment; want to compare coaches on billing and on volume; report to partners or a board and need a page you can screenshot.
Not the right template if you: need scheduling, client messaging, contracting or invoicing – this reports on activity, it does not run it; want live sync from a CRM or booking system, since this is a manual paste-and-refresh workbook; need a month-picker KPI scorecard with target-versus-actual traffic lights, which is the separate KPI dashboard family; work in an organisation that forbids client data in local spreadsheets. It also makes no claim about any coaching credential, accreditation or professional standard – the Coach Level values are editable labels you define, not certifications the workbook verifies.
How to Use the Coaching Networks Dashboard in Excel
- Unzip the download and open the .xlsx. Enable editing if Excel shows the protected-view banner – there are no macros to enable.
- Open the Data sheet and read the 500 sample rows to see what each column expects.
- Replace the sample rows with your own engagements, keeping the column headers exactly as they are. Add rows freely; the pivots read the whole table.
- Edit the list values – coaching types, coach levels, client segments, regions, program formats – to match your own network. They flow into the slicers automatically.
- Press Ctrl+Alt+F5 (Data > Refresh All) once. Every pivot, chart, KPI card and slicer rebuilds.
- Click a slicer tile and watch all five pages follow. Use the tab buttons at the top to move between pages.
- Print or export a page to PDF for a partner pack, or take a screenshot straight from the Overview page.
Real-World Use Cases
Rachel, who runs a 22-coach leadership network. Her partners kept asking which coaching type actually earns. Filtering to Executive and Leadership on the Overview page answered it in one click, and the revenue-versus-payout chart showed her the margin behind the headline number rather than just the gross.
Daniel, operations lead at a corporate coaching provider. He uses the Program Delivery page every month. The gap between 1,902 One-on-One sessions booked and 1,224 delivered is the number his capacity planning turns on, and the Status chart tells him how much of the gap is cancellation versus scheduling.
Priya, a practice manager reporting to a non-profit board. She filters to the Non-Profit segment, exports the Client Insights page and puts the renewals-versus-engagements chart straight into the quarterly pack, without rebuilding a chart every time.
Frequently Asked Questions
Does this workbook need macros or an add-in?
No. It is a plain .xlsx built on native pivot tables, pivot charts and slicers. Nothing to enable, and it works in locked-down corporate environments where macros are blocked.
Can I add my own coaches, regions and coaching types?
Yes. Type them into the Data sheet columns and refresh. New values appear as slicer tiles and as chart categories on their own, with no formula editing.
How many engagement rows can it handle?
The sample carries 500 rows. Pivot tables handle tens of thousands comfortably; the practical limit is your machine, not the template.
Is this the same as a Coaching KPI Dashboard?
No. This is the analytical dashboard – it slices and profiles the whole book. A KPI dashboard is a scorecard with a month picker, targets and traffic lights. They answer different questions and are sold separately.
Will it work in Excel for Mac or Excel Online?
Excel for Mac and Excel 2016 or later on Windows are both fine. Excel Online will display the workbook, but slicer behaviour is reduced in the browser, so the desktop app is recommended.
Can I use it for client work?
Yes, across unlimited projects of your own or your clients’. You may not resell or redistribute the template file itself.
Does it calculate coach payouts for me?
No. Coach Payout is a column you supply per engagement. The dashboard sums and compares it against revenue – it does not apply a commission rule or generate a payment.
About the Author
Built by PK – Microsoft Certified Professional with 15+ years of Excel, Google Sheets, and Power BI experience. Founder of NextGenTemplates, reaching 300K+ subscribers across YouTube channels. Every template is hand-built and tested before release.
Explore Related Templates
- Career Counseling Centers Dashboard in Excel – the closest sibling if you also run guidance or placement programmes.
- Leadership Development Dashboard in Excel – programme-side reporting for the leadership coaching you deliver.
- Performance Management Dashboard in Excel – for tracking the outcomes coaching is meant to move.
- HR Analytics Dashboard in Excel – if coaching sits inside a wider people-analytics report.
- Online Certification Providers Dashboard in Excel – the certification and accreditation side of professional development.
Browse more in Excel Dashboards or the wider MS Excel library.
Download the Coaching Networks Dashboard in Excel today, paste in your own engagement log, refresh once, and have a five-page network report ready for your next partner meeting. Instant download, unlimited reuse, no subscription.
Last updated: 18 August 2026


























Reviews
There are no reviews yet.