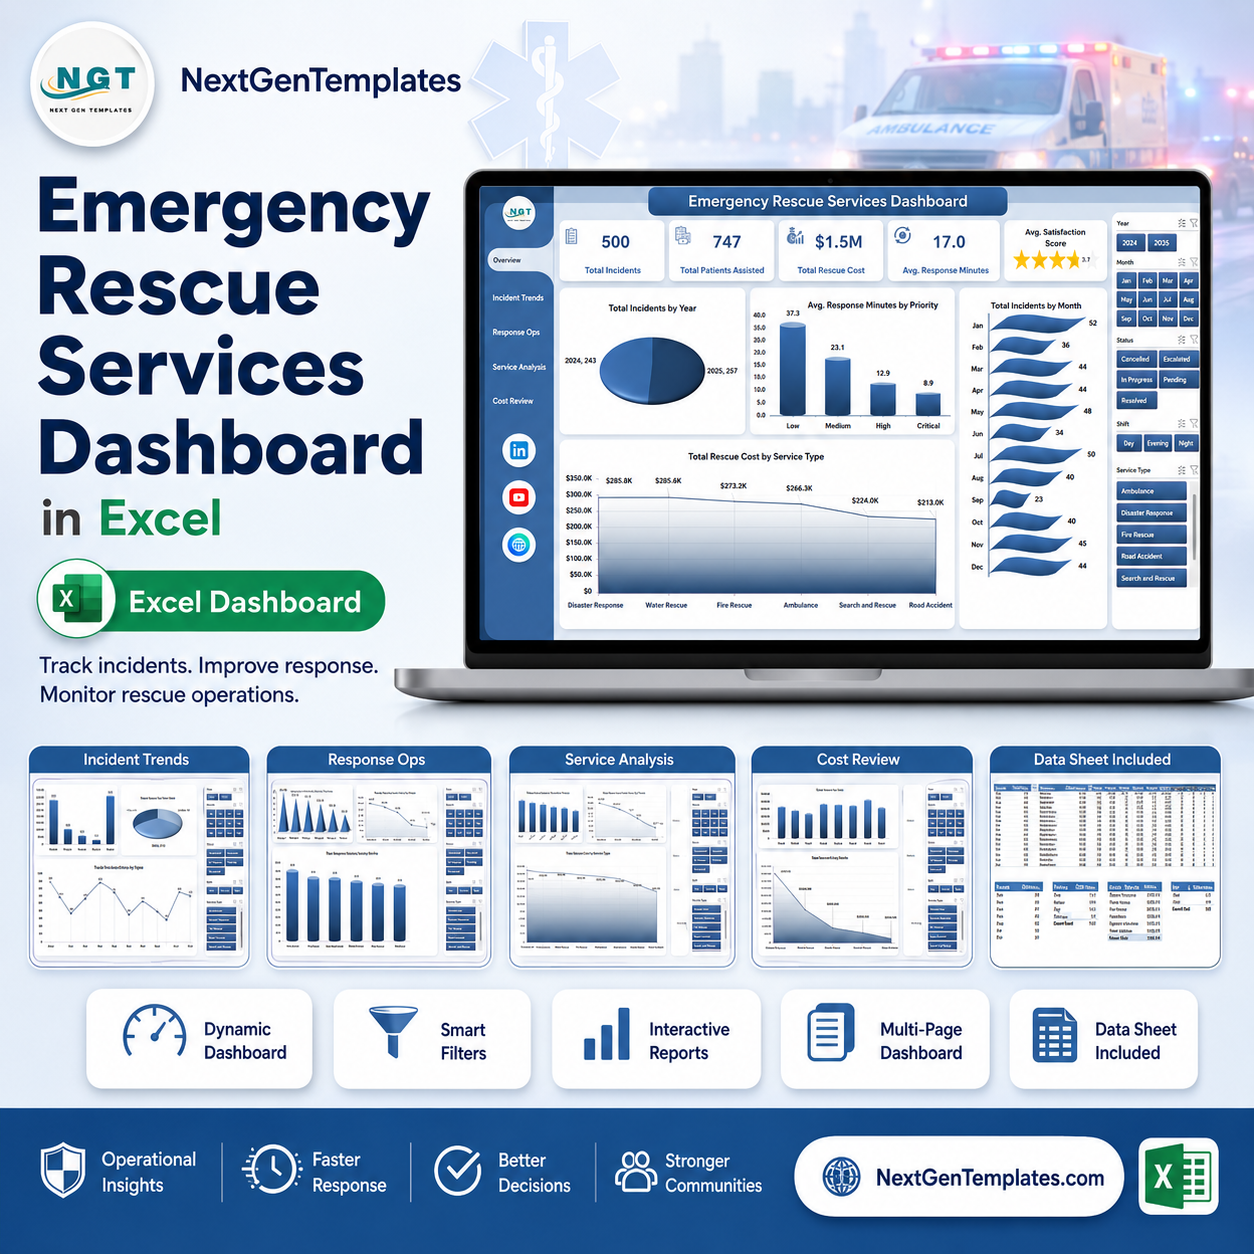


Emergency Rescue Services Dashboard in Excel gives rescue coordinators, EMS leaders, fire departments, dispatch centers, and emergency operations teams a ready-made 7-sheet Excel dashboard for monitoring incidents, patient assistance, response minutes, rescue cost, satisfaction score, escalation patterns, crew workload, and service performance. Instead of rebuilding pivot charts every month, paste your latest data into the Data sheet, click Data > Refresh All, and the full dashboard updates in minutes.
For $17.99 one-time, you get a structured Excel dashboard with 5 KPI cards, 5 analysis pages, multiple slicers, a Data sheet, and a Support sheet that powers the workbook. It is built for teams that want operational visibility without a $39-$199/user/month emergency management SaaS subscription.
Emergency Rescue Services Dashboard in Excel
Key Features of Emergency Rescue Services Dashboard in Excel
- 5 headline KPI cards covering Total Incidents, Total Patients Assisted, Total Rescue Cost, Avg. Response Minutes, and Avg. Satisfaction Score.
- 5 dashboard analysis pages for overview, incident trends, response operations, service analysis, and cost review.
- Multiple slicers to filter the dashboard quickly by fields such as year, month, region, priority, service type, status, shift, crew, vehicle type, and dispatch center.
- Pivot-driven Excel charts so every page updates after you refresh the workbook.
- Dedicated Data sheet where you replace the sample rescue records in the same format.
- Support sheet with pivot tables that can be hidden from end users after setup.
- No subscription or per-user fee; use the file offline in Microsoft Excel.
What’s Inside the Emergency Rescue Services Dashboard in Excel
1. Overview Page
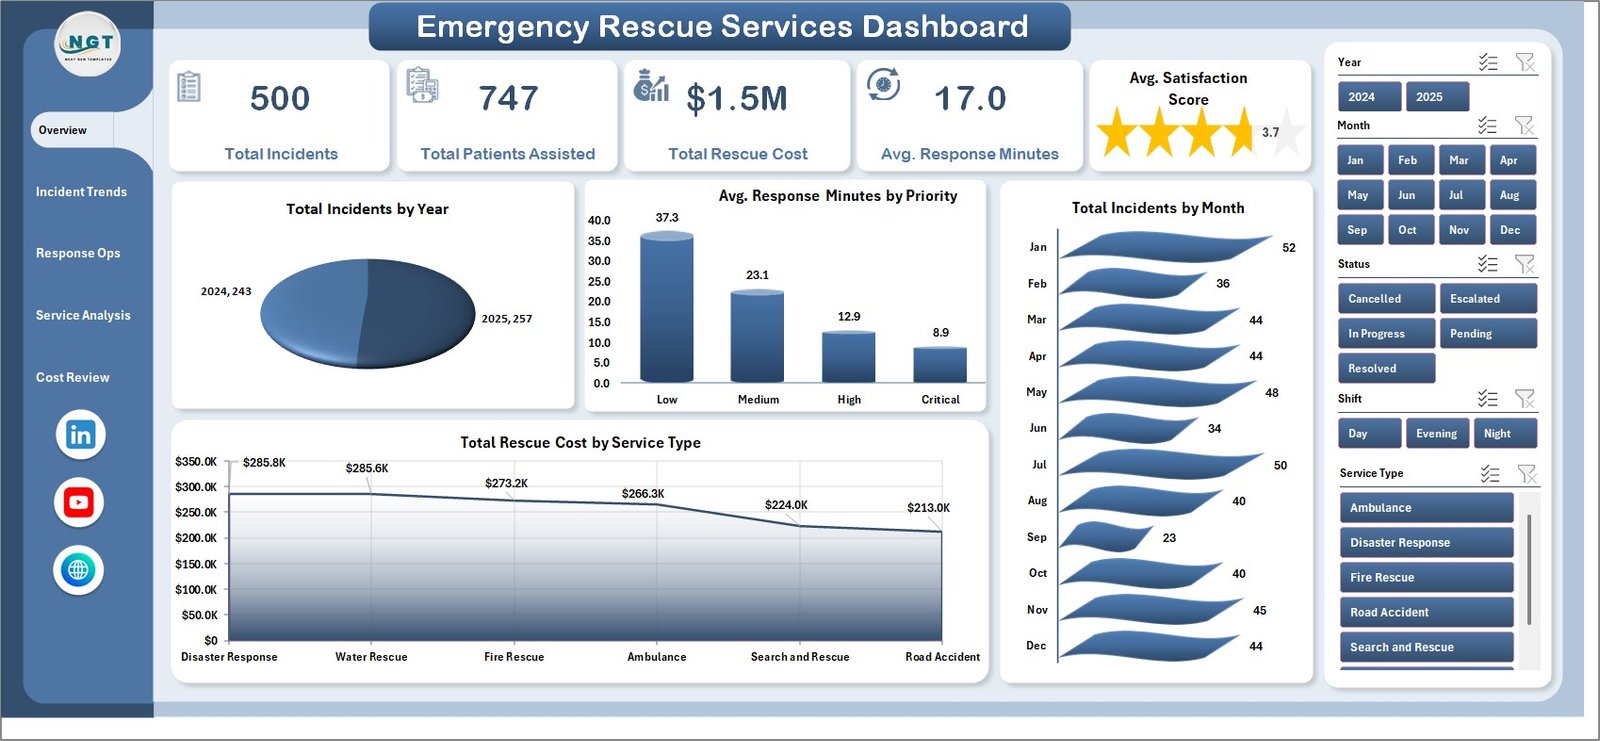
The Overview page starts with five cards: Total Incidents, Total Patients Assisted, Total Rescue Cost, Avg. Response Minutes, and Avg. Satisfaction Score. These cards give leadership a fast operational snapshot before they inspect the detailed charts.
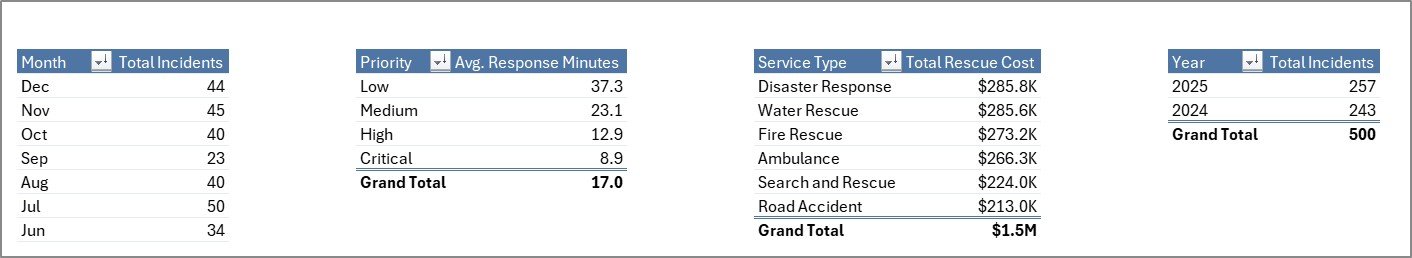
Total Incidents by Year shows incident volume over time so rescue teams can spot year-over-year growth or reductions. Use it for annual reviews, grant reporting, and staffing discussions.
Avg. Response Minutes by Priority compares average response speed for priority levels. It helps managers see whether high-priority cases are receiving faster dispatch and arrival attention.
Total Incidents by Month shows seasonal demand patterns across the year. This is useful for scheduling crews, vehicles, and peak-period readiness.
Total Rescue Cost by Service Type breaks cost across medical rescue, fire rescue, water rescue, road rescue, and other service groups. It helps budget owners understand where rescue spending is concentrated.
2. Incident Trends
The Incident Trends page analyzes Total Incidents by Status, Avg. Response Minutes by Shift, Avg. Response Minutes by Region, and Total Patients Assisted by Month. It is designed for tracking backlog, shift performance, regional response differences, and patient assistance trends.
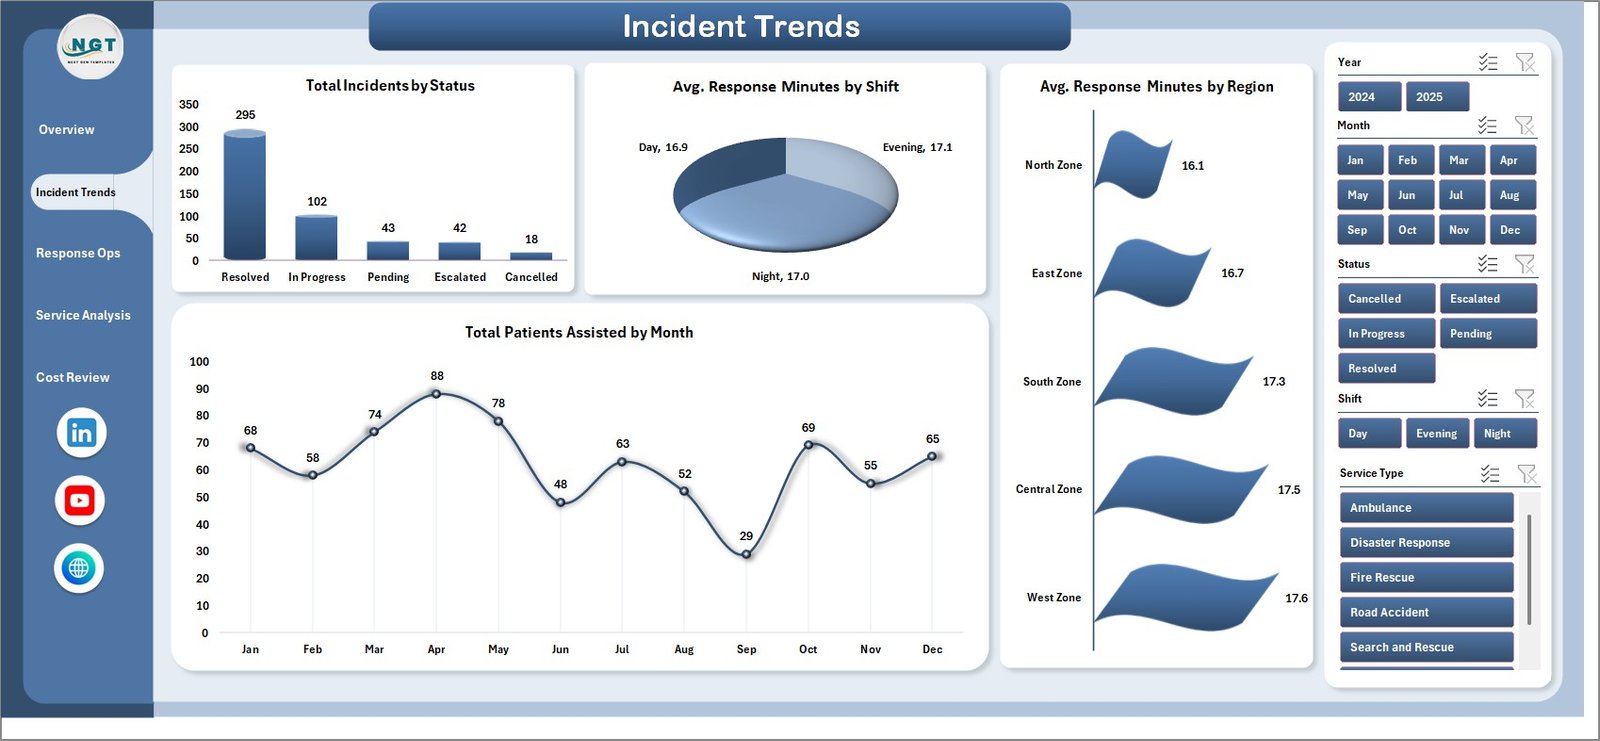
Incident Trends
3. Response Ops
The Response Ops page reviews Total Incidents by Dispatch Center, Avg. Resolution Minutes by Crew, Total Incidents by Service Type, and Total Incidents by Vehicle Type. This page is helpful for dispatch managers who need to compare centers, crews, service demand, and vehicle utilization.
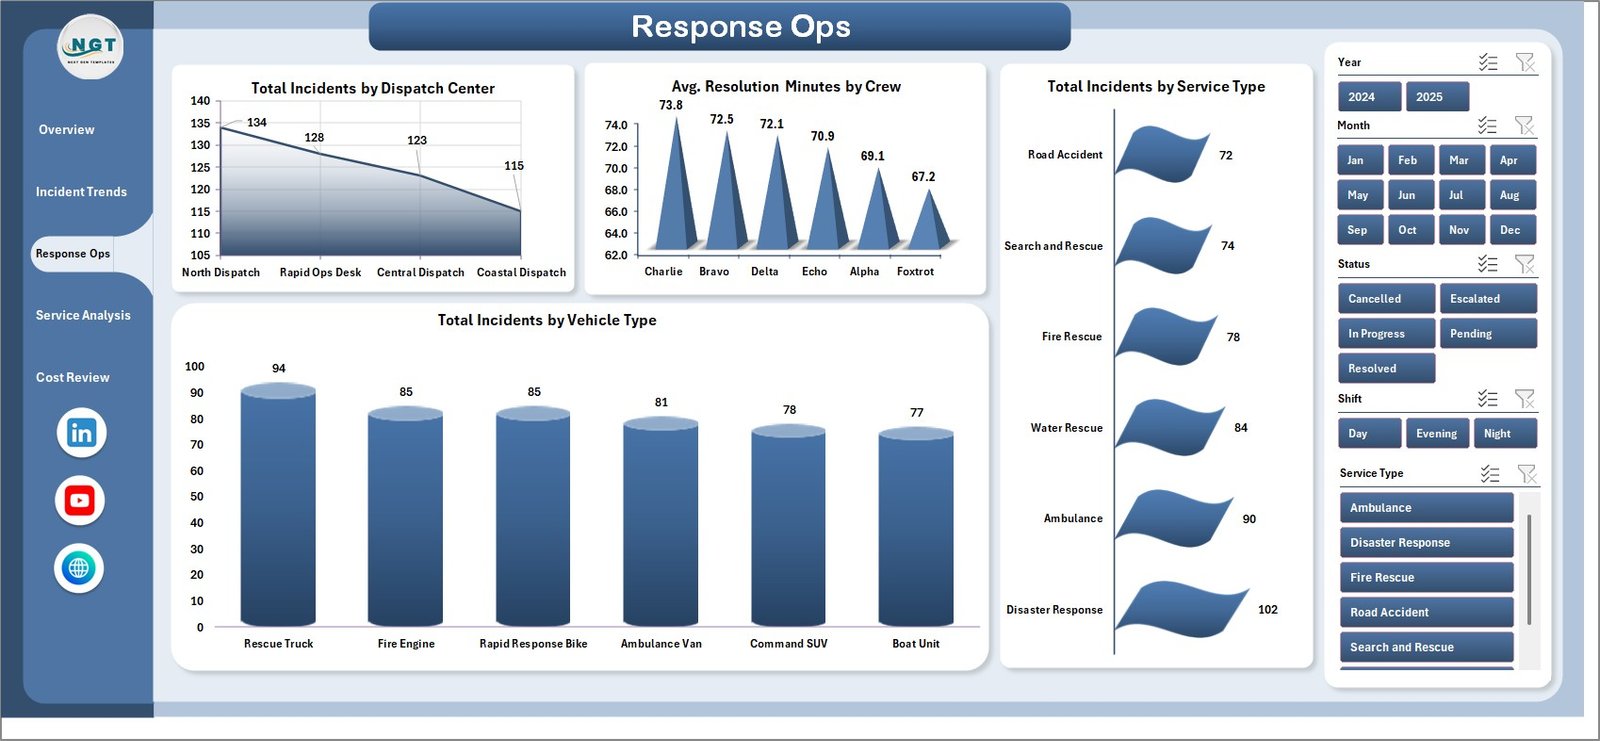
Response Ops
4. Service Analysis
The Service Analysis page covers Total Rescue Cost by Incident Category, Escalated Incidents by Priority, Total Rescue Cost by Region, and Avg. Response Minutes by City. Use it to identify expensive incident categories, priority escalation pressure, regional cost differences, and city-level response gaps.
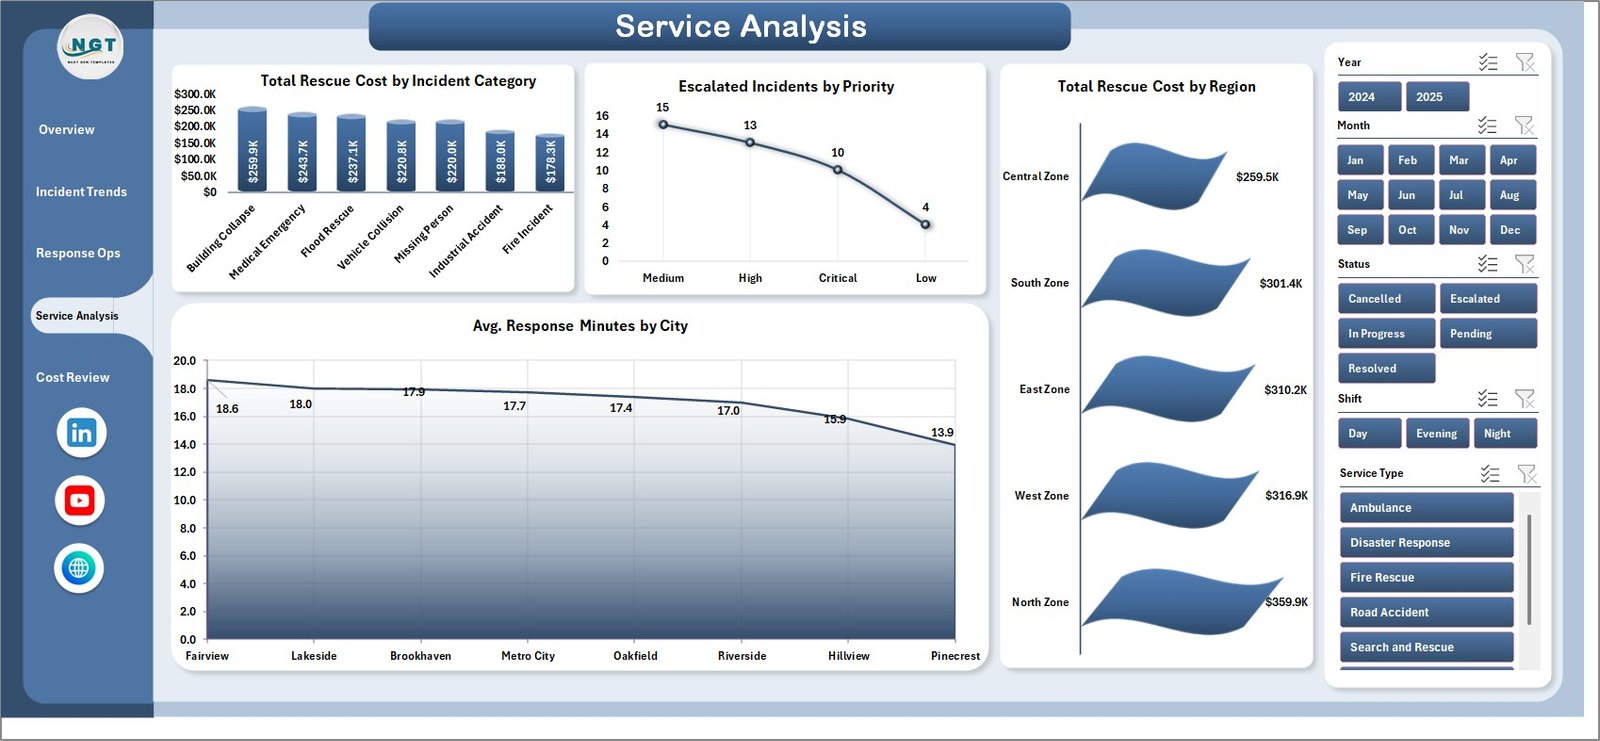
Service Analysis
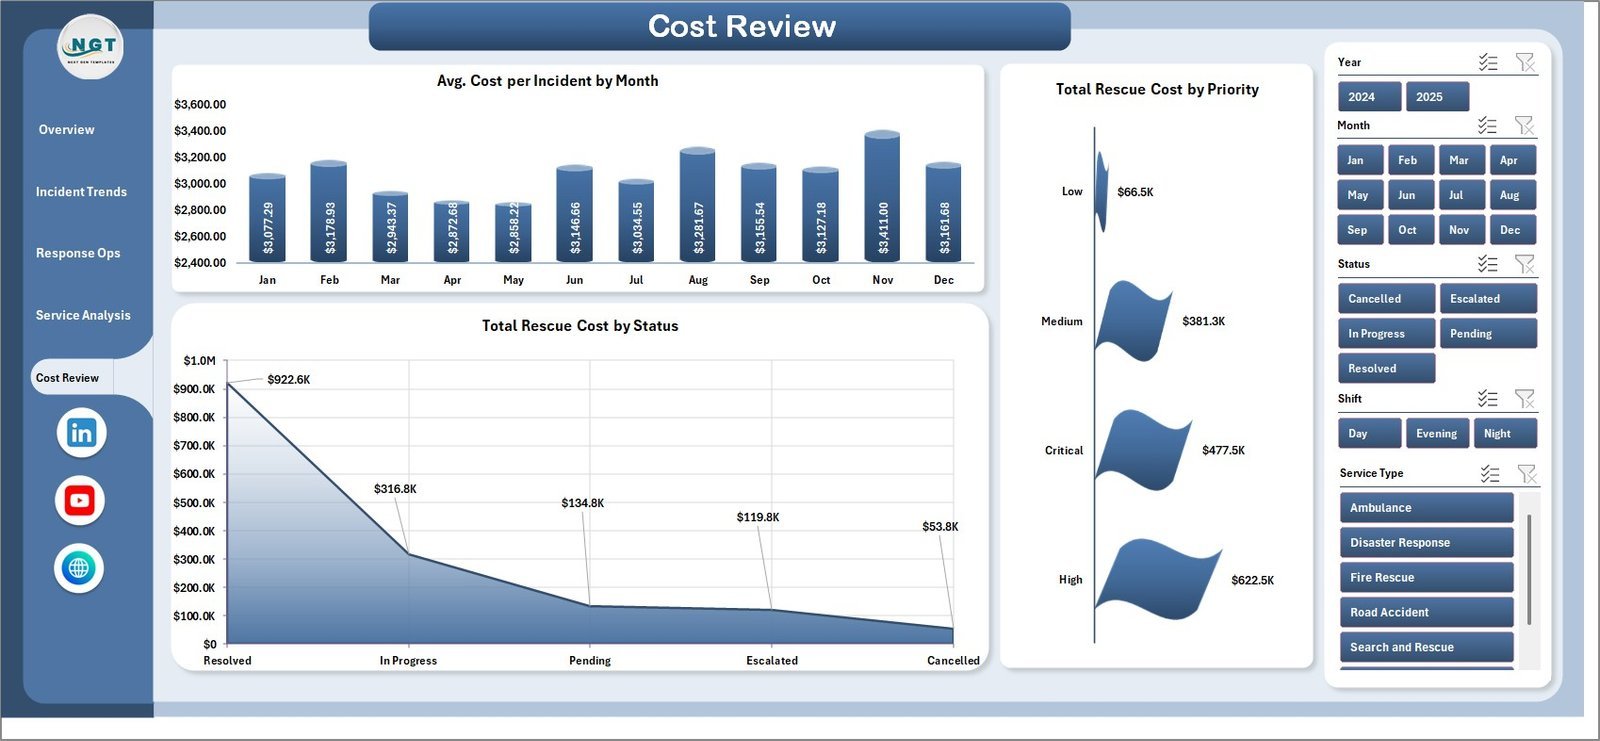
5. Cost Review
The Cost Review page focuses on Avg. Cost per Incident by Month, Total Rescue Cost by Status, and Total Rescue Cost by Priority. It helps finance and operations teams understand monthly cost efficiency, cost tied to open or closed incidents, and the budget impact of high-priority rescue work.

Cost Review
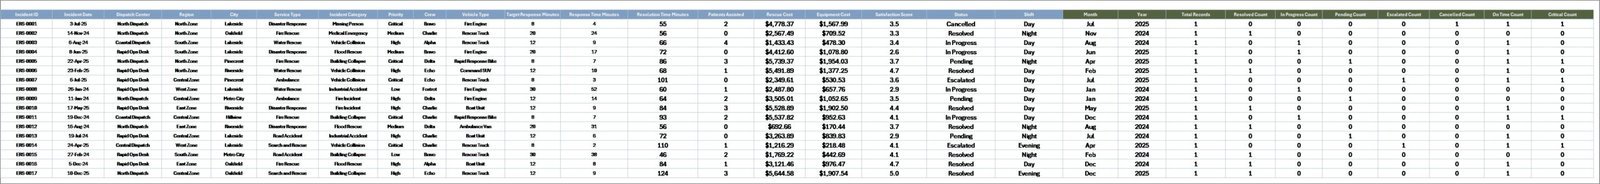
6. Data Sheet Tab
The Data sheet is where you add or replace the sample rescue services records in the same column format. Keep the headers unchanged, enter your own incident, patient, service, cost, region, priority, and response data, then refresh the workbook.

Data Sheet tab
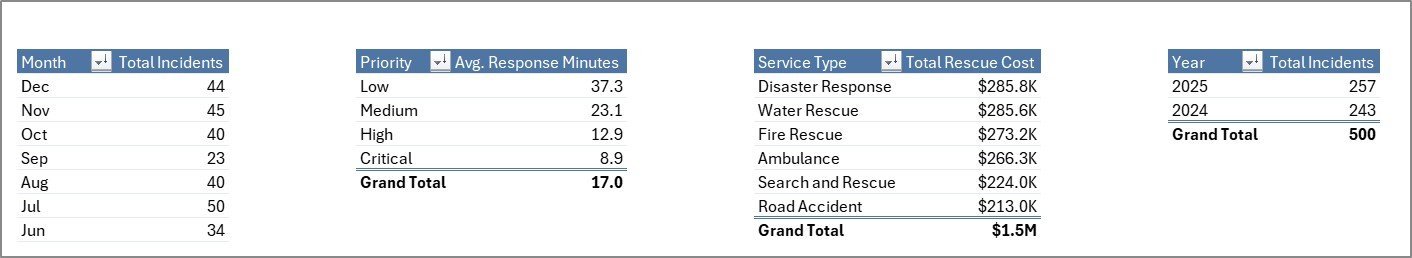
7. Support Sheet
The Support sheet contains the pivot tables used to create the entire dashboard dynamically. After updating the Data sheet, go to the Excel ribbon, click Data > Refresh All, and every pivot table, chart, slicer, and KPI card will refresh. You can keep this sheet hidden for normal users.
Support sheet tab
Emergency Rescue Services Dashboard in Excel vs. Google Sheets vs. Paid Emergency SaaS – Where This Fits
| Feature | This Excel Dashboard | Google Sheets Alternative | Paid SaaS |
|---|---|---|---|
| Cost | $17.99 one-time | Low-cost template or DIY | $39-$199/user/month |
| Platform | Microsoft Excel | Browser-based Sheets | Cloud portal |
| Setup time | Under 10 minutes | 10-30 minutes | 2-8 weeks onboarding |
| Custom fields | Fully editable workbook | Editable sheet | Vendor-controlled schema |
| Offline use | Yes | Limited | No |
| Year-1 cost at 5 users | $17.99 | $0-$50 plus build time | $2,340-$11,940 |
Who This Template Is For – and Who It’s Not For
Best for: rescue service managers, EMS coordinators, fire and rescue departments, disaster response teams, dispatch center analysts, public safety reporting teams, emergency operations consultants, and healthcare-adjacent response units that already use Excel.
Not for: teams needing live CAD dispatch, real-time GPS tracking, two-way SMS alerting, mobile responder apps, or regulated role-based evidence trails. Use a specialist emergency response platform for those workflows.
How to Use the Emergency Rescue Services Dashboard in Excel
- Download and unzip the file.
- Open the workbook in Microsoft Excel.
- Go to the Data sheet and replace the sample rows with your own records in the same structure.
- Click Data > Refresh All from the Excel ribbon.
- Use the dashboard slicers to filter by service, priority, region, month, status, crew, dispatch center, or vehicle type.
- Hide the Support sheet before sharing the file with managers or clients.
Real-World Use Cases
Rescue operations chief: reviews response time by priority, escalated incidents, and monthly patient assistance before the weekly command meeting.
Dispatch center manager: compares incidents by dispatch center and crew resolution minutes to balance workload across teams.
Emergency services finance analyst: uses the Cost Review page to explain rescue cost by status, priority, month, and service type.
Frequently Asked Questions
Does this dashboard require macros?
No. The dashboard is pivot-table driven and uses standard Excel refresh behavior.
Can I replace the sample data?
Yes. Replace the Data sheet records in the same format, then refresh all pivots and charts.
Which Excel version should I use?
Use Microsoft Excel 2016, 2019, 2021, or Microsoft 365 on Windows or macOS for best results.
Can I add more rows?
Yes. Add new rows in the Data sheet while keeping the same headers and structure.
Is this a dispatch system?
No. It is an analytics and reporting dashboard, not a live dispatch, alerting, or field response system.
Can I hide the Support sheet?
Yes. The Support sheet can remain hidden after setup because it contains the pivot tables behind the dashboard.
About the Author
Built by PK – Microsoft Certified Professional with 15+ years of Excel, Google Sheets, and Power BI experience. Founder of NextGenTemplates, reaching 300K+ subscribers across YouTube channels. Every template is hand-built and tested before release.
Explore Related Templates
Explore Emergency Management Report in Excel, Public Safety Report in Excel, Crisis Response KPI Dashboard in Power BI, Compliance and Audit Dashboard in Excel, and Road Safety Services KPI Dashboard in Excel. Browse more Excel Dashboard Templates.
Click here to read the detailed blog post
Add the Emergency Rescue Services Dashboard in Excel to your toolkit today. One-time payment, instant download, lifetime access, and no subscription.
Last updated: June 8, 2026


Reviews
There are no reviews yet.