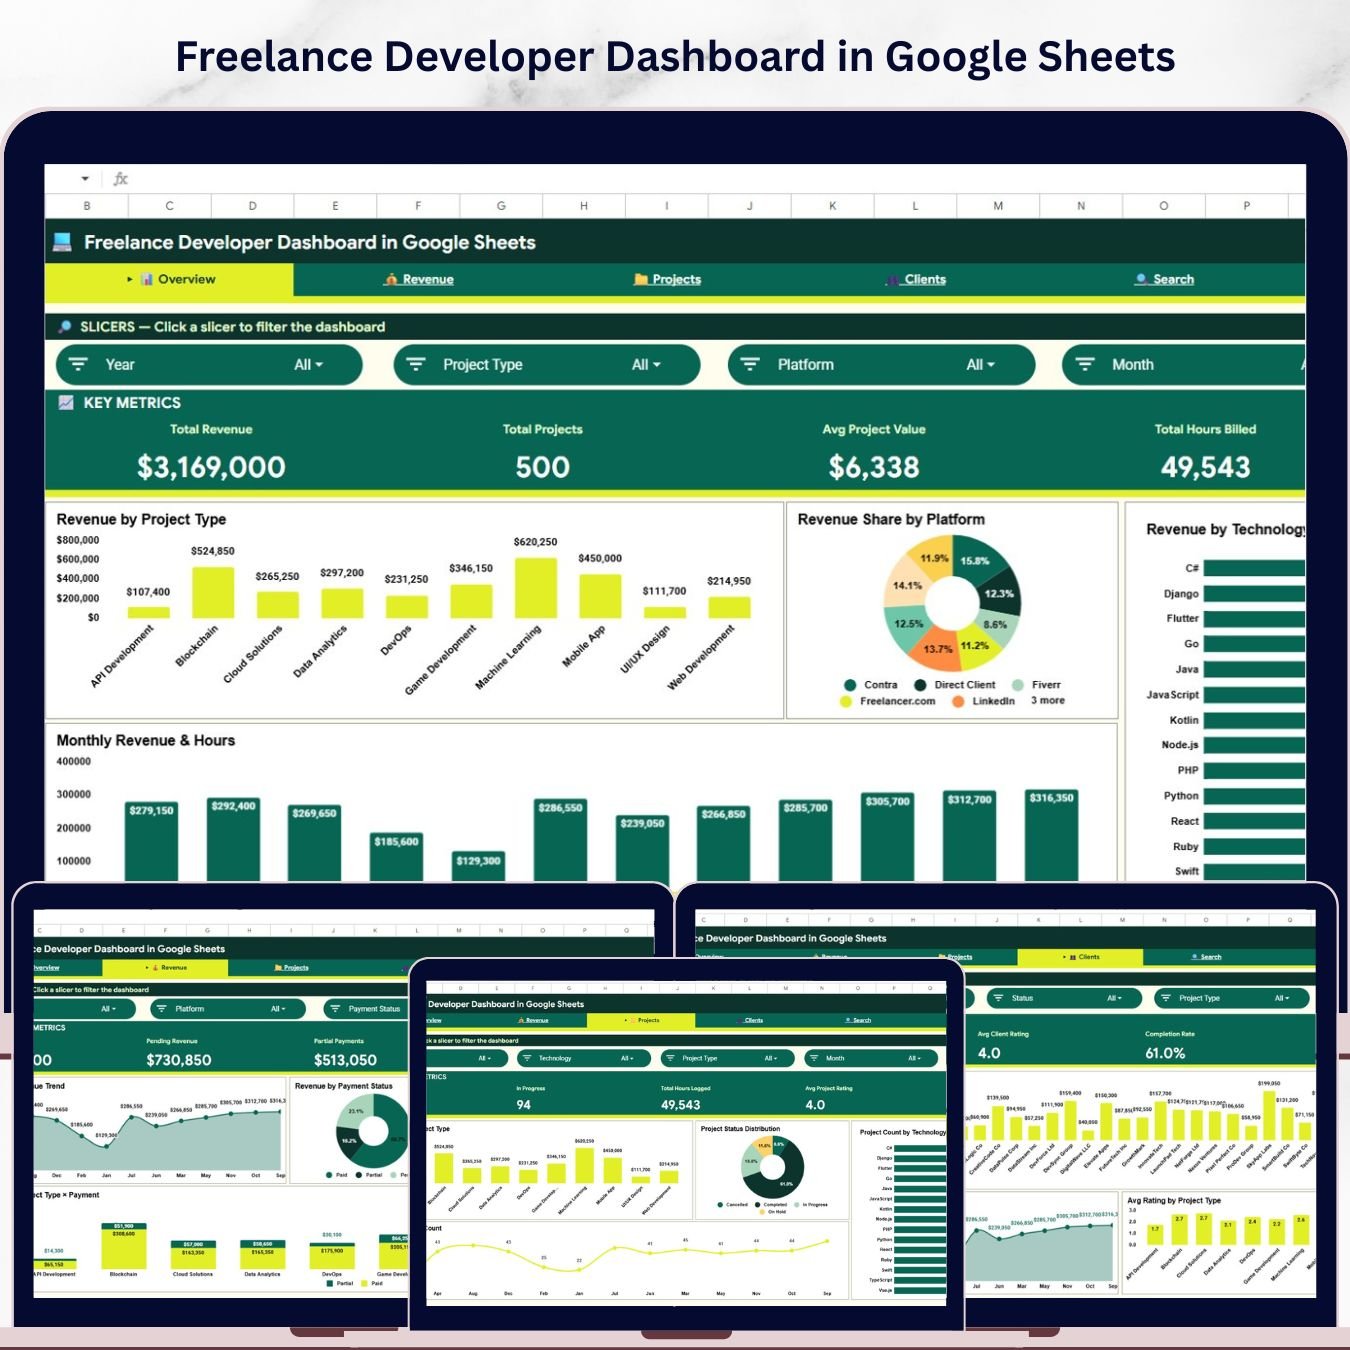
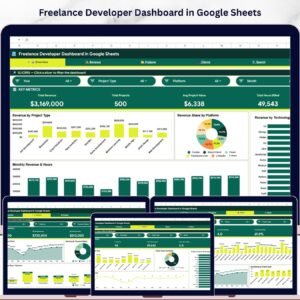
The Freelance Developer Dashboard in Google Sheets tracks 4 headline KPIs across 6 interactive pages, with 16 pre-built charts covering Revenue, Projects, Clients, Technology stack performance, and Platform analytics. Slicer-driven filters let you isolate any project subset in one click — setup takes under 10 minutes, just paste your data and every chart and KPI card rebuilds automatically.
🌍 Join 8,400+ teams in 40+ countries using NextGenTemplates to replace costly SaaS tools with one-time-purchase Google Sheets Dashboard templates.
✅ Instant download · One-time payment · No subscription · No per-user fees · Lifetime access
🔑 Key Features of Freelance Developer Dashboard in Google Sheets
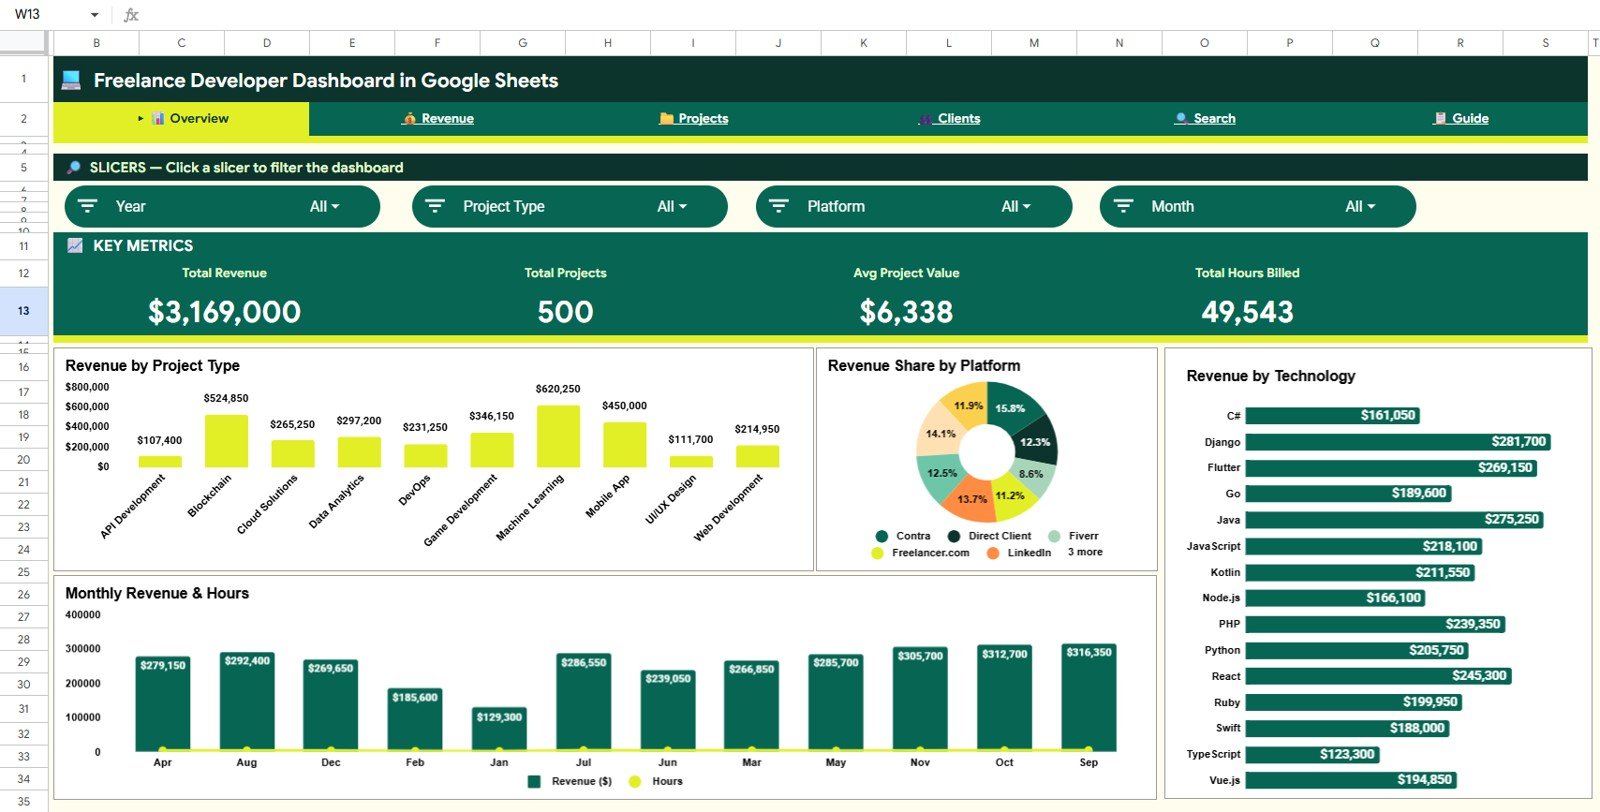
🔹 4 KPI headline cards — Total Revenue, Total Projects, Avg Project Value, and Total Hours Billed displayed prominently on the Overview page for an at-a-glance business health check.
🔹 16 pre-built charts across 4 analysis pages — This dashboard tracks performance across Revenue, Projects, Clients, and Technology dimensions, giving freelance developers a complete 360° view without writing a single formula.
🔹 Slicer-driven filtering — Multiple interactive slicers on the Overview page let you filter every chart and KPI card simultaneously by project type, payment status, platform, or technology with a single click.
🔹 Revenue by Technology analysis — See exactly which programming languages and technology stacks generate the most revenue so you can double down on your highest-earning skills.
🔹 Platform revenue breakdown — Revenue Share by Platform chart shows which freelance marketplaces (Upwork, Fiverr, Toptal, direct, etc.) contribute most to your income.
🔹 Client intelligence page — Revenue by Client, Revenue by Platform, and Avg Rating by Project Type charts help identify your best clients and highest-rated work categories.
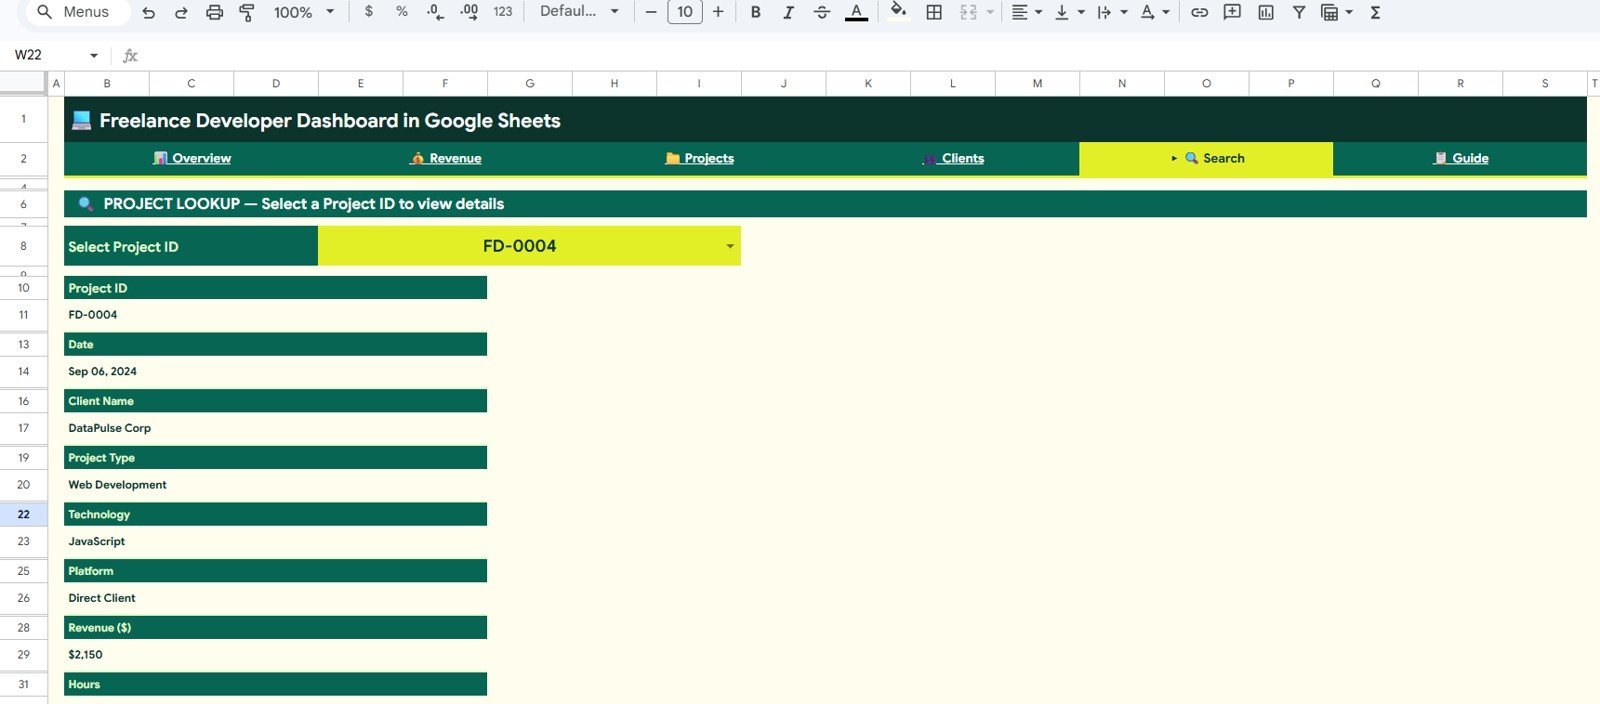
🔹 Project Search sheet — Select any Project ID from a dropdown to instantly surface all details including date, client name, project type, technology, platform, revenue, hours, hourly rate, payment status, project status, and rating.
🔹 Pivot-table backend — All charts and KPIs are powered by Google Sheets pivot tables. Add rows to the Data sheet, refresh, and every metric updates — no macro knowledge required.
📦 What’s Inside the Freelance Developer Dashboard in Google Sheets
🔹 Overview Page — 4 KPI cards (Total Revenue, Total Projects, Avg Project Value, Total Hours Billed) + 4 charts (Revenue by Project Type, Revenue Share by Platform, Revenue by Technology, Monthly Revenue and Hours) + slicer filters.
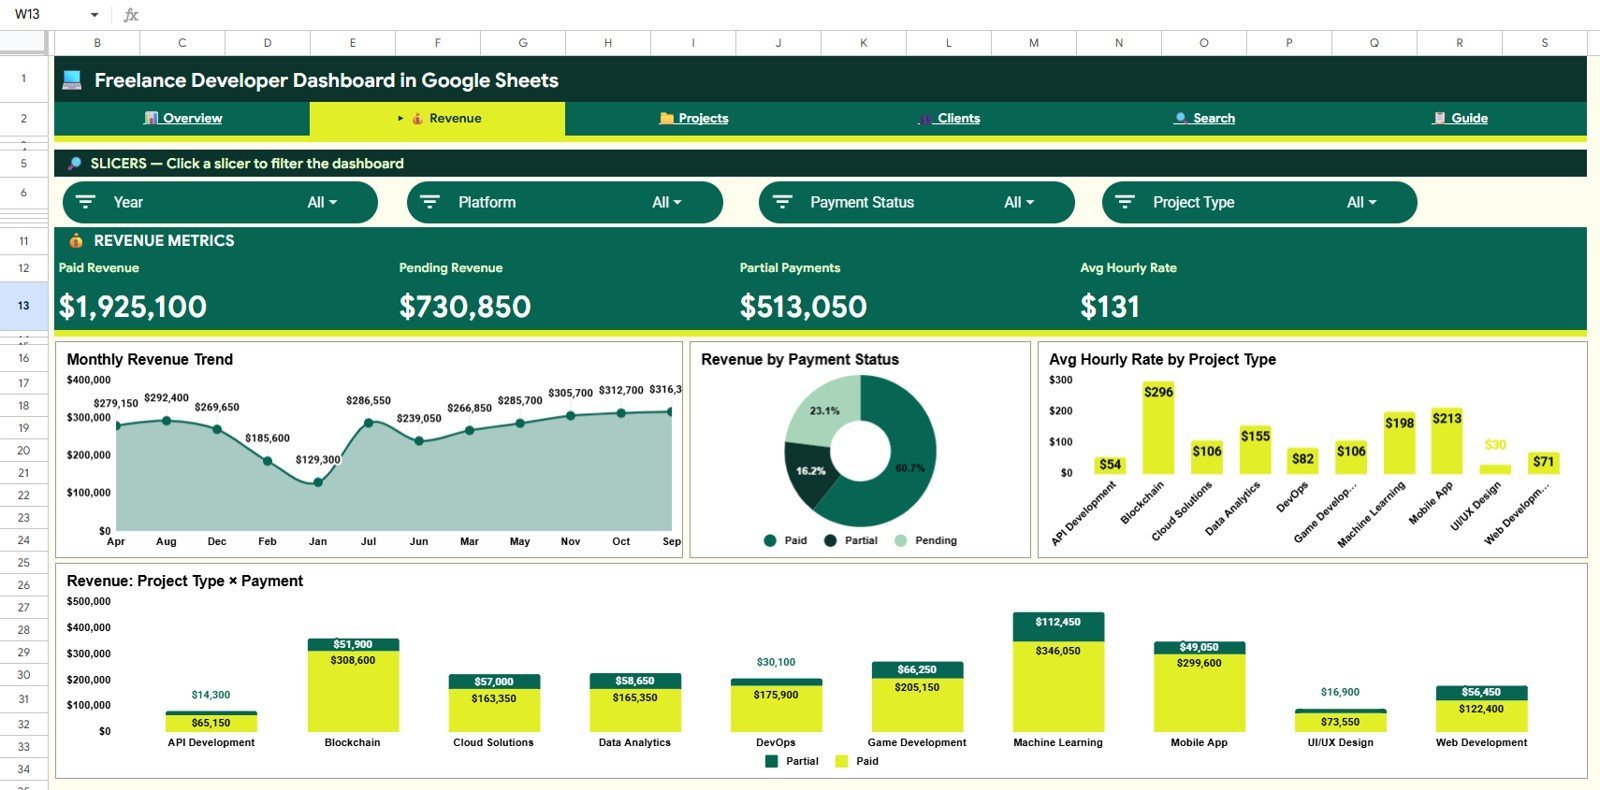
🔹 Revenue Page — 4 charts: Monthly Revenue Trend, Revenue by Payment Status, Avg Hourly Rate by Project Type, Revenue by Project Type and Payment Status.
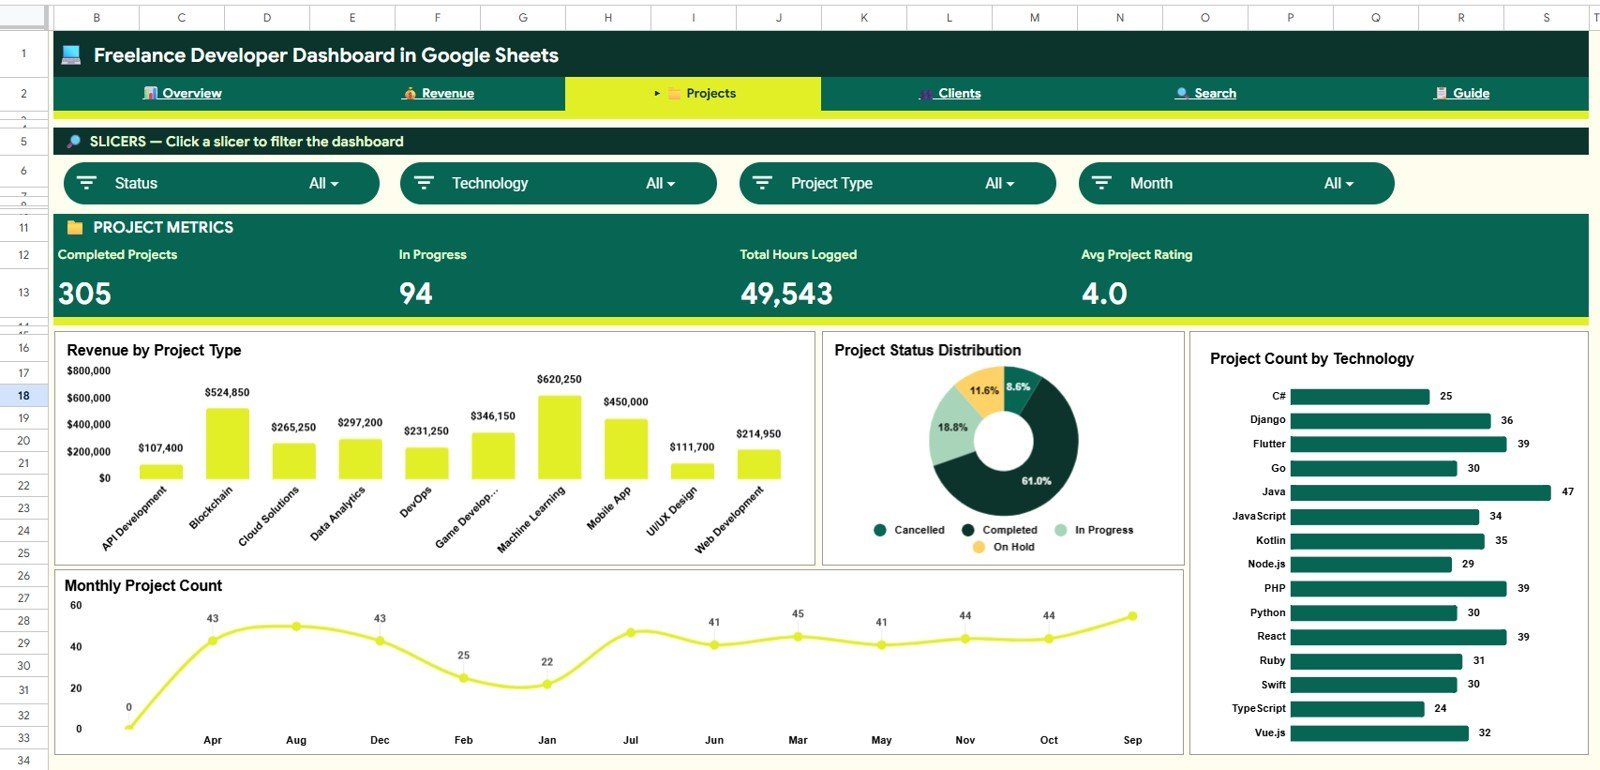
🔹 Projects Page — 4 charts: Revenue by Project Type, Project Status Distribution, Project Count by Technology, Monthly Project Count.
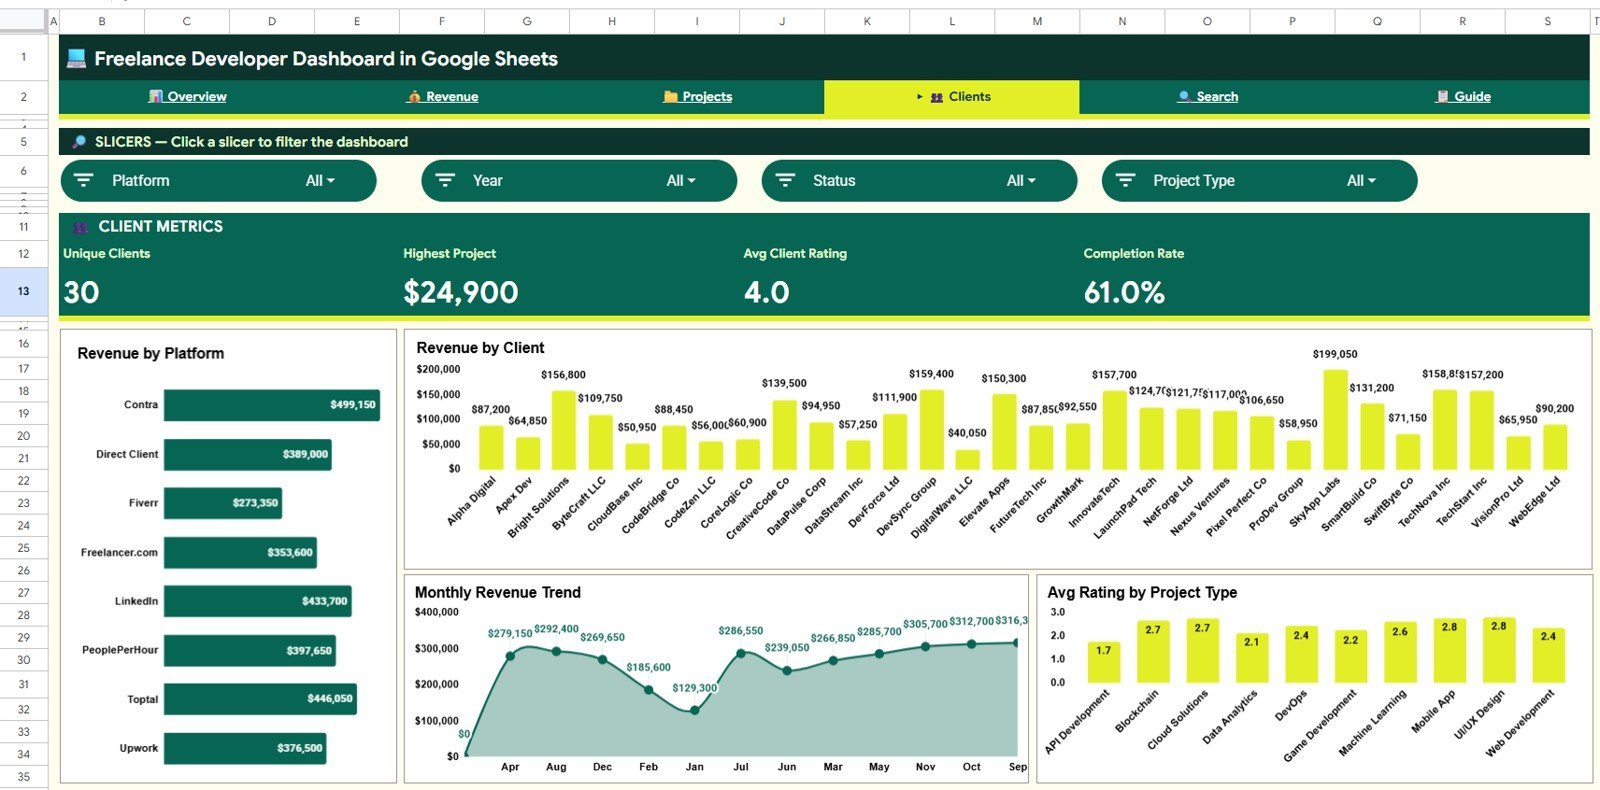
🔹 Clients Page — 4 charts: Revenue by Platform, Revenue by Client, Monthly Revenue Trend, Avg Rating by Project Type.
🔹 Search Sheet — Project-level lookup by ID showing all 11 project fields.
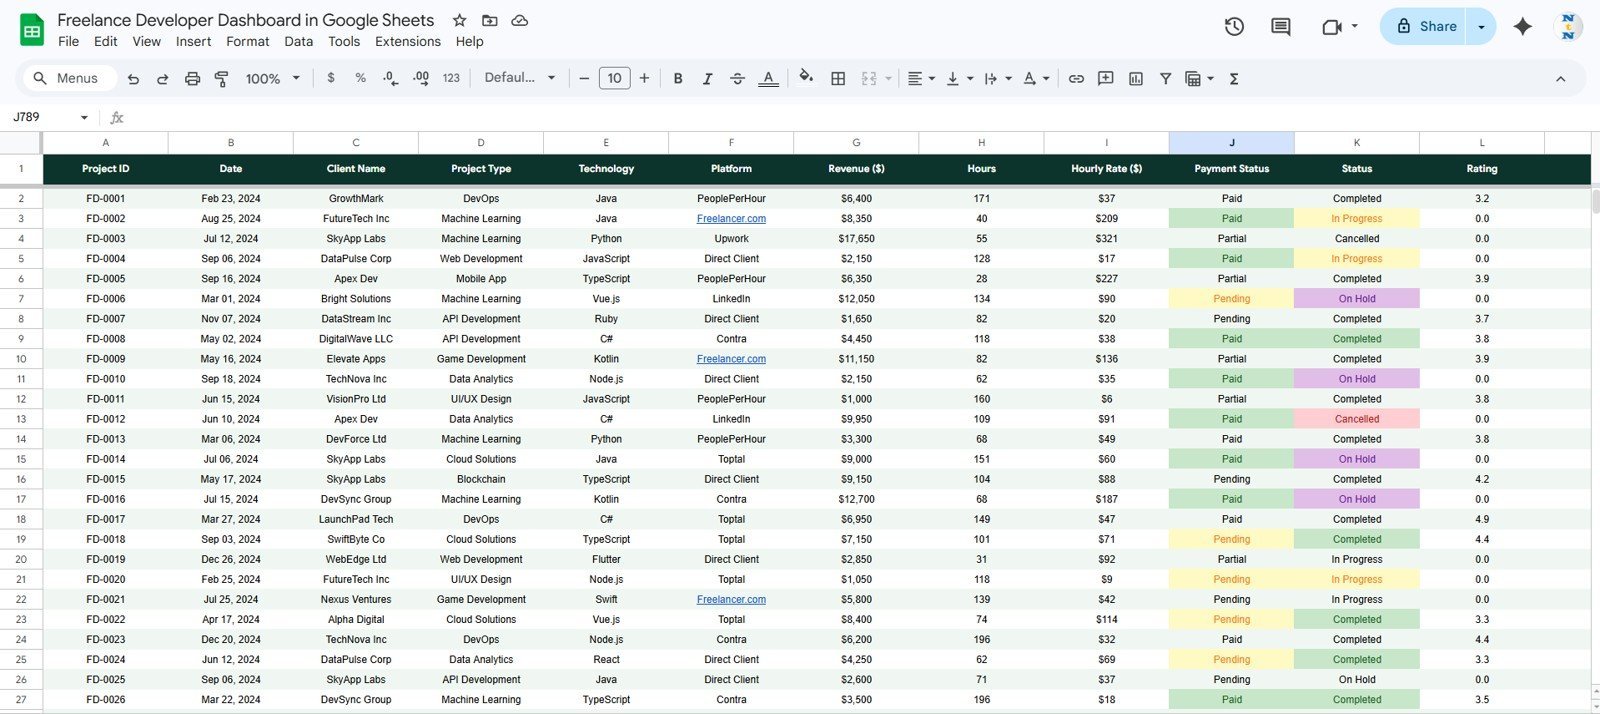
🔹 Data Sheet — Structured input sheet; add your project records in the provided format and all dashboard pages update automatically.
Freelance Developer Dashboard in Google Sheets
📊 Freelance Developer Dashboard in Google Sheets vs. Microsoft Excel Dashboard vs. Paid SaaS — Where This Fits
| Feature | Freelance Developer Dashboard in Google Sheets | Microsoft Excel Dashboard | Paid SaaS (Harvest / FreshBooks) |
|---|---|---|---|
| Cost | $9.99 one-time | $17.99 one-time | $12–55 / user / month |
| Platform | ✅ Google Sheets (browser-based) | Requires MS Excel license | Web app, proprietary |
| Setup time | ✅ Under 10 minutes | Under 15 minutes | 1–3 hours (onboarding) |
| Internet required | Yes (Google Drive) | No | Yes |
| Real-time collaboration | ✅ Built-in (Google Drive) | Limited (OneDrive) | ✅ Built-in |
| Customizable fields | ✅ Fully editable | ✅ Fully editable | Limited (plan-dependent) |
| Revenue by Technology tracking | ✅ Yes | ✅ Yes | ❌ Not available |
| Year-1 cost (1 user) | $9.99 total | $17.99 total | $144–660 |
For freelance developers who want full revenue and project visibility without a monthly subscription, the Freelance Developer Dashboard in Google Sheets sits in the sweet spot.
👥 Who This Template Is For — and Who It’s Not For
✅ This template is built for:
- Freelance developers billing across multiple platforms (Upwork, Fiverr, Toptal, direct clients)
- Solo tech consultants who want to track revenue by technology stack and project type
- Google Sheets users who need a no-code dashboard they can set up in under 10 minutes
- Developers switching from Excel who want browser-based access and real-time sharing
❌ This template is NOT for:
- Large development agencies needing multi-user role-based access and approval workflows
- Teams requiring offline-only data management without internet access
- Developers who need automated time-tracking integrations with GitHub or Jira
⚙️ How to Use the Freelance Developer Dashboard in Google Sheets
- Download the PDF guide from your purchase confirmation email.
- Click the Google Sheets copy link in the PDF to create your own editable copy in Google Drive.
- Go to the Data sheet and enter your project records in the provided format (date, client, project type, technology, platform, revenue, hours, payment status, etc.).
- Refresh the pivot tables to update all charts and KPI cards across the 4 analysis pages.
- Use the slicer filters on the Overview page to drill into any platform, technology, or project type.
- Use the Search sheet to look up any individual project by Project ID.
💼 Real-World Use Cases
Ravi is a full-stack developer billing clients across Upwork and Toptal. He uses the Freelance Developer Dashboard in Google Sheets to track which technologies (React, Node.js, Python) generate the most hourly revenue, which platform brings in the highest-value projects, and whether his payment collection rate is improving — all without paying $35/month for a project management SaaS tool.
Priya runs a one-person iOS and Android development consultancy. She tracks project revenue by client, monitors her average rating across project types, and uses the Monthly Revenue Trend chart to forecast slow months and proactively pitch new clients — turning raw data into a strategic sales tool.
Marcus is transitioning from agency work to full-time freelancing. He uses the Projects page to analyze Project Status Distribution — how many projects are in progress vs. completed vs. stalled — and the Avg Hourly Rate by Project Type chart to identify which services he should price higher in his next proposal.
❓ Frequently Asked Questions
What KPIs does the Freelance Developer Dashboard in Google Sheets track?
The Freelance Developer Dashboard in Google Sheets tracks 4 headline KPIs: Total Revenue, Total Projects, Avg Project Value, and Total Hours Billed. All metrics update automatically when you add new project records to the Data sheet and refresh the pivot tables.
Do I need Google Sheets experience to use this dashboard?
No advanced Google Sheets knowledge is required. The Freelance Developer Dashboard is designed for non-technical users — just paste your project data into the Data sheet in the provided format, refresh pivot tables, and all 16 charts and 4 KPI cards rebuild automatically.
How does this compare to Harvest or FreshBooks for freelance tracking?
Harvest starts at $12/month ($144/year) and FreshBooks at $19/month — both charge recurring fees indefinitely. The Freelance Developer Dashboard in Google Sheets is a $9.99 one-time purchase with lifetime access, no subscription, and full customization freedom that SaaS tools don’t offer.
Can I track revenue by programming language or technology?
Yes. The Overview page includes a Revenue by Technology chart and the Projects page shows Project Count by Technology. Simply add your technology (React, Python, Node.js, Flutter, etc.) to each project record in the Data sheet and the charts update automatically.
How long does setup take?
Setup takes under 10 minutes. Download the PDF, click the Google Sheets link to copy the template to your Drive, paste your existing project data into the Data sheet, and refresh the pivot tables. All 6 pages will be ready to use immediately.
Can I share this dashboard with my accountant or business partner?
Yes. Since the Freelance Developer Dashboard in Google Sheets lives in your Google Drive, you can share view-only or edit access with anyone using the standard Google Drive sharing settings — no additional licenses or subscriptions required.
Is there an Excel version of this dashboard available?
Yes. The Freelance Developer Dashboard is also available in Excel and Power BI formats on NextGenTemplates. You can find the Excel version here and the Power BI version here.
👤 About the Author
Built by PK — Microsoft Certified Professional with 15+ years of Excel, Google Sheets, and Power BI experience. Founder of NextGenTemplates, reaching 300K+ subscribers across YouTube channels (@PK-AnExcelExpert, @NextGenTemplates, @NeoTechNavigators). Every template is hand-built and tested before release.
🔗 Explore Related Templates
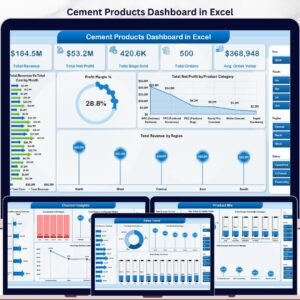
🔹 Freelance Developer Dashboard in Excel — Same dashboard, optimized for Microsoft Excel with offline access.
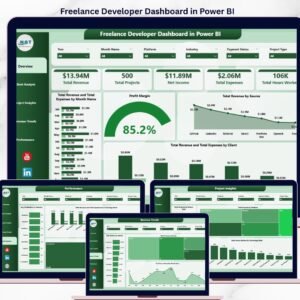
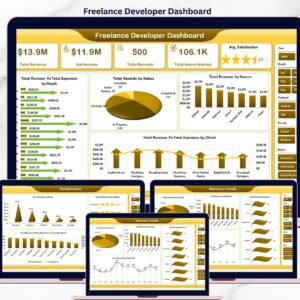
🔹 Freelance Developer Dashboard in Power BI — Advanced interactive version with Power BI visualizations.
🔹 Influencer Campaign Dashboard in Google Sheets — For creators managing campaign revenue across platforms.
🔹 Browse all Google Sheets Dashboard templates on NextGenTemplates.
📖 Click here to read the Detailed Blog Post
Watch the step-by-step video tutorial:
🎥 Visit our YouTube channel for step-by-step video tutorials
👉 YouTube.com/@NextGenTemplates


Reviews
There are no reviews yet.