

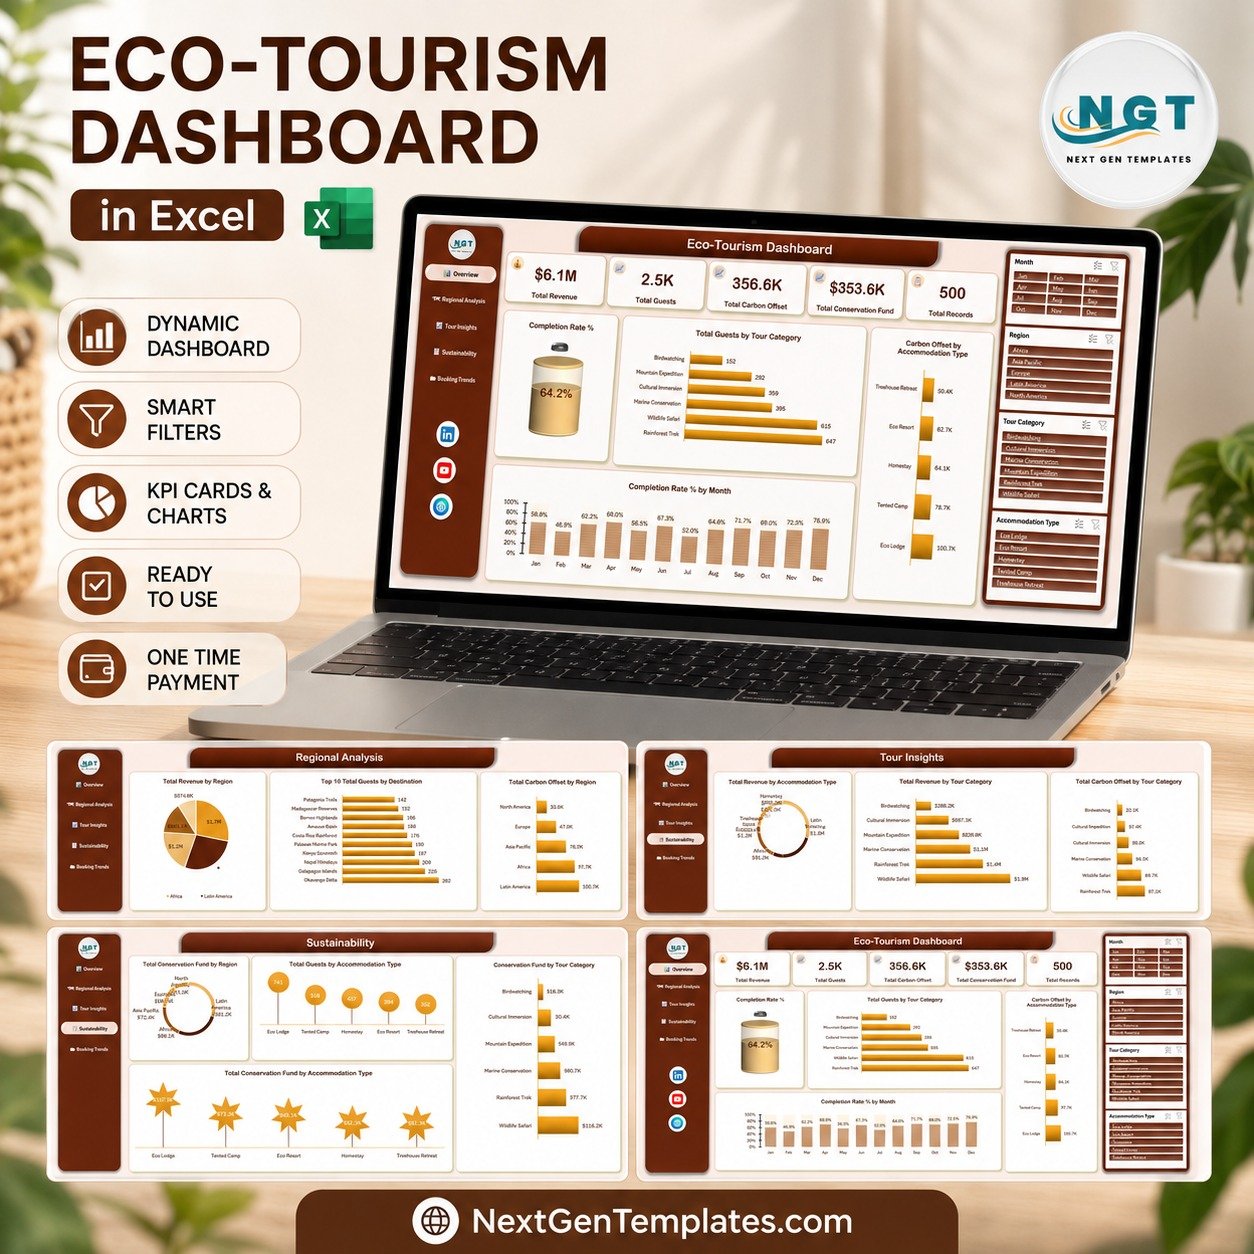

The Eco-Tourism Dashboard in Excel turns 500 tour bookings into five linked report pages that answer what a responsible-travel operator is asked every quarter: where the $6.1M of revenue came from, why only 64.2% of bookings actually completed, which of six tour categories carries the 356.6K of carbon offset, and where the $353.6K conservation fund landed. This is the analytical Excel dashboard line – pivot tables and slicers, not a traffic-light scorecard. $17.99 once, instant download, no subscription, no macros.
Key Features of the Eco-Tourism Dashboard in Excel
- Five report pages – Overview, Regional Analysis, Tour Insights, Sustainability and Booking Trends – reached from a fixed side rail that stays in the same place on every page.
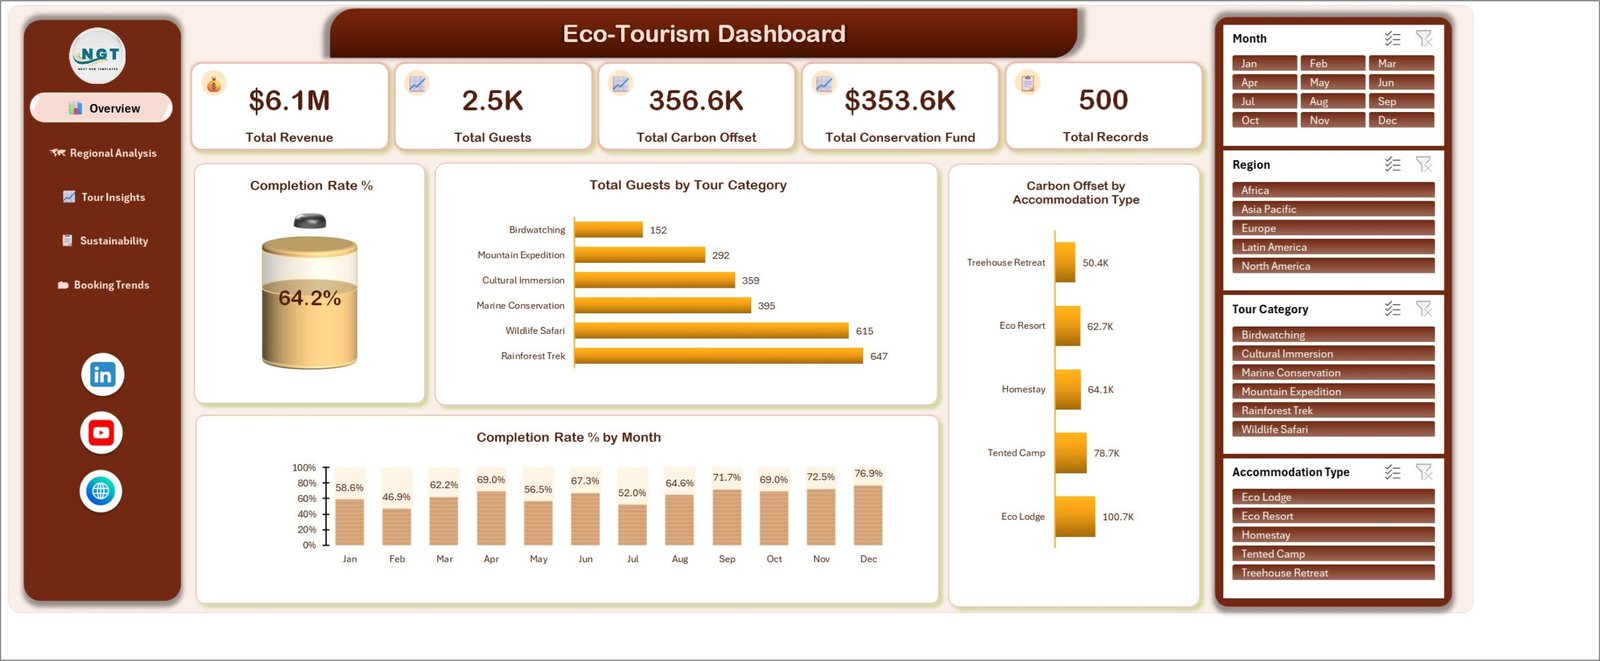
- Five KPI cards: Total Revenue, Total Guests, Total Carbon Offset, Total Conservation Fund and Total Records, reading $6.1M, 2.5K, 356.6K, $353.6K and 500 on the sample data.
- Four synchronised slicers – Month, Region, Tour Category and Accommodation Type – repeated on all five pages and wired to the same cache, so filtering to Latin America on Overview leaves Sustainability already filtered when you get there.
- 20 charts, four per page, each named for the metric it shows (for example Total Conservation Fund by Accommodation Type), so a screenshot needs no caption.
- A dedicated Sustainability page – conservation fund by region, by tour category and by accommodation type, next to guests by accommodation type, so the environmental contribution sits beside the volume that generated it.
- Six tour categories and five accommodation types pre-loaded: Wildlife Safari, Rainforest Trek, Marine Conservation, Cultural Immersion, Mountain Expedition and Birdwatching, sold into Eco Lodge, Tented Camp, Homestay, Eco Resort and Treehouse Retreat.
- 15 destinations across five regions and seven tour operators: Okavango Delta, Galapagos Islands, Nepal Himalaya, Kenya Savannah, Palawan Marine Park, Costa Rica Rainforest, Amazon Basin, Borneo Highlands, Madagascar Reserves, Patagonia Trails, Yellowstone Corridor, Alaska Wilderness, Carpathian Forests, Azores Islands and Norwegian Fjords, run by operators from Terra Verde Journeys to Native Path Safaris.
- Five booking channels and four booking statuses – Direct Website, Travel Agent, Online Marketplace, Referral and Corporate Partner, tracked as Completed, Confirmed, Rescheduled or Cancelled.
- 500 sample booking rows across 23 data fields – booking date, destination, region, tour category, tour operator, accommodation type, booking channel, booking status, guests, trip duration, revenue, operating cost, conservation fund, carbon offset, local jobs supported and guest satisfaction among them. Paste your own export over them, refresh, and every page redraws.
- No VBA – a plain .xlsx built on 25 pivot tables for Excel 2016+, Microsoft 365 and Excel for Mac, with a PDF user manual in the ZIP.
What’s Inside the Eco-Tourism Dashboard in Excel
Overview. The five KPI cards read $6.1M total revenue, 2.5K total guests, 356.6K total carbon offset, $353.6K total conservation fund and 500 records. Beneath them a Completion Rate % cylinder gauge sits at 64.2% – the 321 completed bookings out of 500. Total Guests by Tour Category ranks Rainforest Trek at 647 guests and Wildlife Safari at 615 against Birdwatching’s 152, Carbon Offset by Accommodation Type puts Eco Lodge at 100.7K ahead of Tented Camp’s 78.7K and Treehouse Retreat’s 50.4K, and Completion Rate % by Month runs from a 46.9% February trough to 76.9% in December.
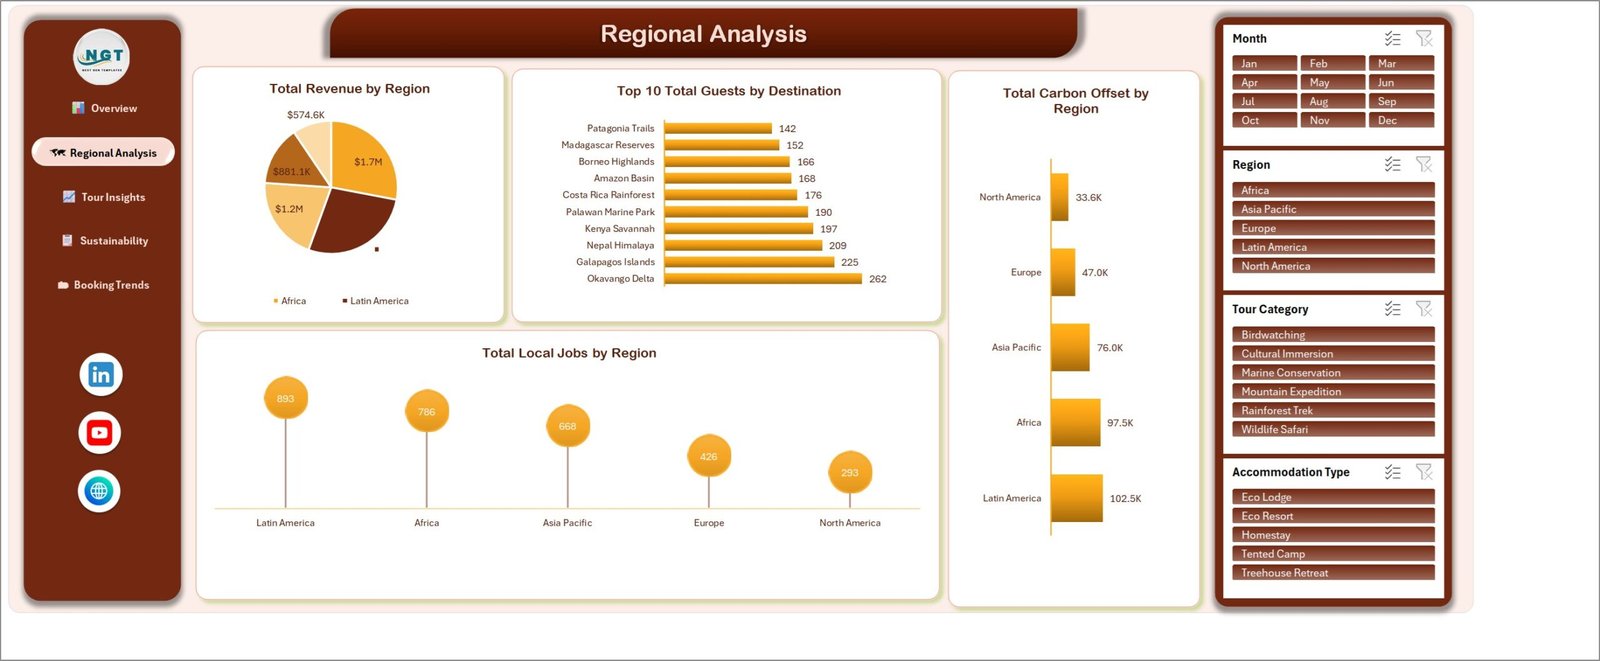
Regional Analysis. Total Revenue by Region splits the $6.1M between Africa and Latin America at $1.7M each, Asia Pacific at $1.2M, Europe at $881.0K and North America at $574.6K. Top 10 Total Guests by Destination is the page’s operating list – Okavango Delta 262, Galapagos Islands 225, Nepal Himalaya 209, Kenya Savannah 197 and Palawan Marine Park 190 down to Patagonia Trails at 142. Total Carbon Offset by Region and Total Local Jobs by Region then read the same regions on two different measures: Latin America leads both at 102.5K and 893 jobs, while North America sits last at 33.6K and 293.
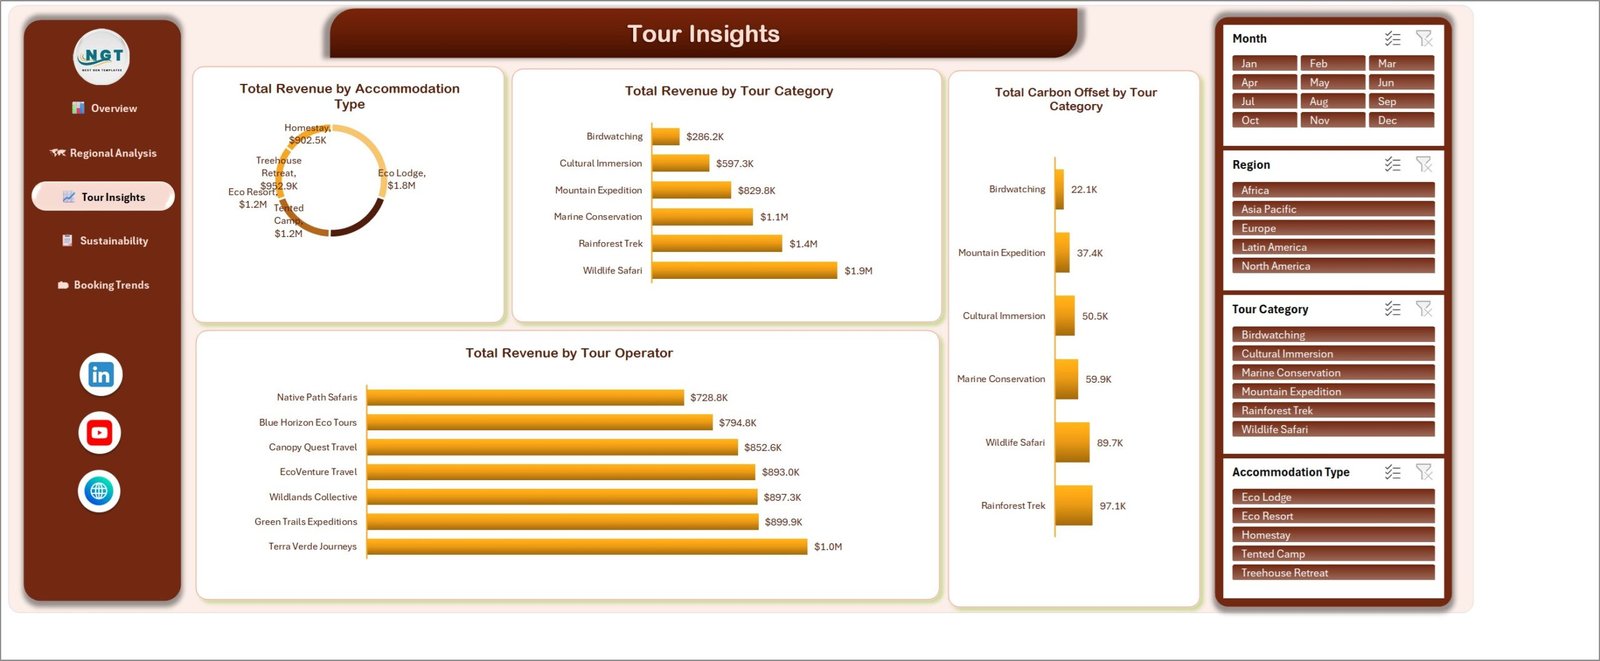
Tour Insights. Total Revenue by Accommodation Type draws a donut with Eco Lodge on $1.8M, Eco Resort and Tented Camp on $1.2M each, Treehouse Retreat on $952.9K and Homestay on $902.5K. Total Revenue by Tour Category puts Wildlife Safari at $1.9M and Rainforest Trek at $1.4M against Birdwatching’s $286.2K, while Total Carbon Offset by Tour Category reverses the top two – Rainforest Trek offsets 97.1K to Wildlife Safari’s 89.7K – which is the comparison the page exists to make. Total Revenue by Tour Operator spreads seven suppliers across a narrow band, from Terra Verde Journeys at $1.0M down to Native Path Safaris at $728.8K.
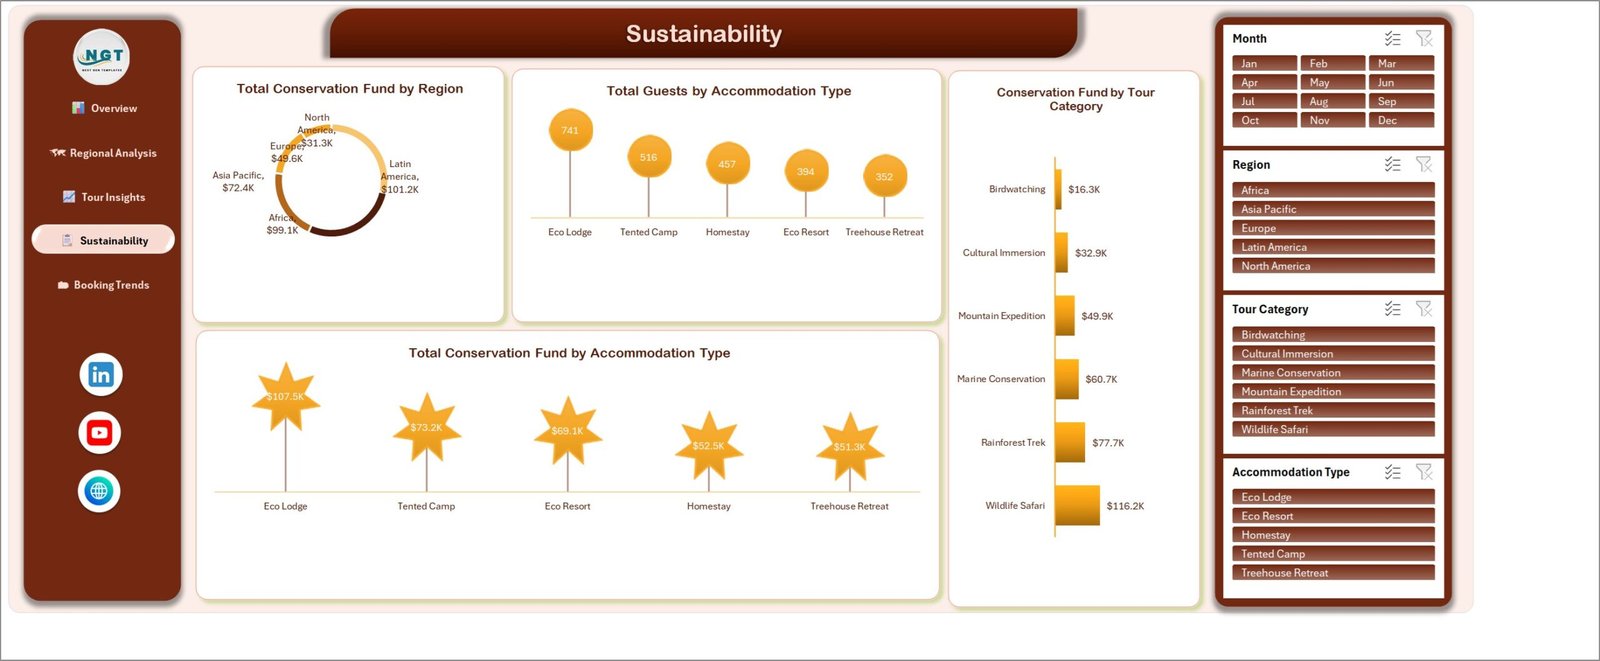
Sustainability. Total Conservation Fund by Region ranks Latin America at $101.2K and Africa at $99.1K ahead of Asia Pacific’s $72.4K, Europe’s $49.6K and North America’s $31.3K. Total Guests by Accommodation Type counts 741 guests in Eco Lodges, 516 in Tented Camps, 457 in Homestays, 394 in Eco Resorts and 352 in Treehouse Retreats. Conservation Fund by Tour Category gives Wildlife Safari $116.2K and Rainforest Trek $77.7K against Birdwatching’s $16.3K, and Total Conservation Fund by Accommodation Type closes with Eco Lodge at $107.5K and Treehouse Retreat at $51.3K.
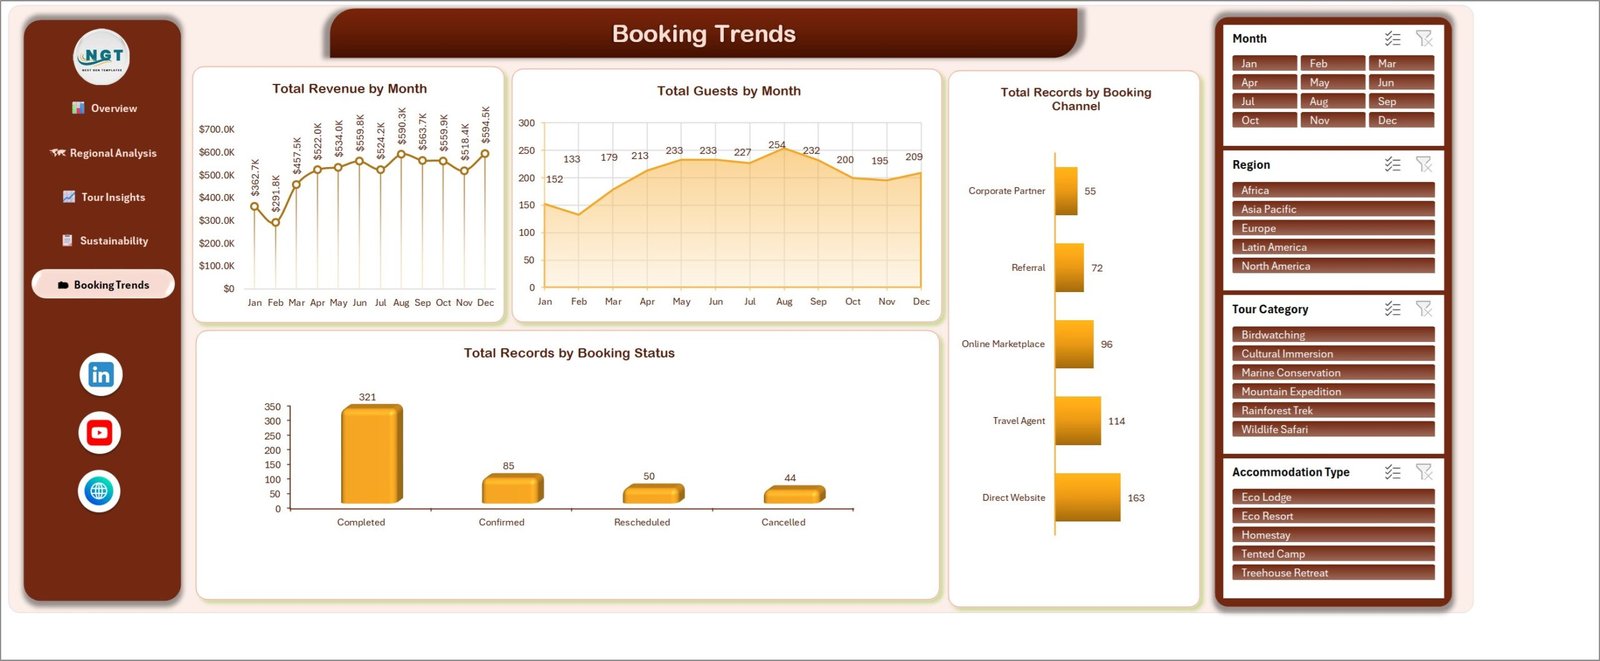
Booking Trends. Total Revenue by Month climbs from a $291.8K February low to $594.5K in December, with an $590.3K August peak in between. Total Guests by Month traces the same year differently – 133 guests in February against 254 in August – so the gap between value and volume is visible month by month. Total Records by Booking Channel settles the acquisition question: 163 bookings arrive through the Direct Website against 114 from Travel Agents, 96 from Online Marketplaces, 72 from Referrals and 55 from Corporate Partners. Total Records by Booking Status counts 321 completed, 85 confirmed, 50 rescheduled and 44 cancelled.
Eco-Tourism Dashboard in Excel vs. Google Sheets vs. Paid Tourism Analytics SaaS – Where This Fits
| What matters | This Excel dashboard | Google Sheets equivalent | Paid SaaS (booking platform BI, sustainability reporting suites) |
|---|---|---|---|
| Cost | $17.99 once | $9.99 once | $6,000-$40,000 per year |
| Platform | Excel 2016+, Microsoft 365, Mac | Browser, any device | Vendor cloud only |
| Setup time | Under 15 minutes | Under 15 minutes | 4-12 weeks |
| Real-time team collaboration | OneDrive or SharePoint co-authoring | Native, simultaneous | Native, with approvals |
| Mobile access | Excel mobile app | Full browser and app | Full app |
| Customizable fields | Any column you add | Any column you add | Admin-configured, often chargeable |
| Works with your own booking export | Yes, paste and refresh | Yes, paste and refresh | Requires a reservation-system integration |
| Year-1 cost at 5 users | $17.99 | $9.99 | $10,000+ |
| Carbon offset and conservation fund beside revenue | Built in | Built in | Usually a separate sustainability module |
| Data leaves your organisation | No | Stays in your Google account | Yes, vendor-hosted |
Who This Template Is For – and Who It’s Not For
A good fit for: eco-tourism and responsible-travel operators running several destinations and tour styles, lodge and camp groups that need guests, revenue and conservation contribution in one view, destination management companies reporting regional performance back to partners, and sustainability or impact managers who have to put carbon offset and local jobs supported next to the revenue that paid for them.
Not a good fit if you need a live feed from your reservation system, channel manager or a carbon-accounting API – this is a reporting workbook you refresh, not a pipeline. It is also wrong if you want a per-booking itinerary or invoicing tool, if your data runs past roughly 100,000 booking rows, or if you need an audited, standards-compliant carbon inventory: the carbon-offset column is whatever number you put in it, not a GHG Protocol or ISO 14064 calculation. If you only want a one-page monthly scorecard with red/amber/green thresholds, the Eco-Tourism KPI Dashboard line fits better than this analytical build.
How to Use the Eco-Tourism Dashboard in Excel
- Download the ZIP and unzip it – you get the .xlsx workbook and a PDF user manual.
- Open the workbook and read the Overview page against the sample data so you know what each KPI card and chart measures.
- Replace the 500 sample rows on the Data sheet with your own booking export, keeping the 23 column headers exactly as they are.
- Match your values to the existing Region, Tour Category, Accommodation Type, Booking Channel and Booking Status entries, or edit them once and let the slicers pick up the new names.
- Press Ctrl + Alt + F5 (Data > Refresh All) to rebuild all 25 pivot tables and every chart – the workbook does not refresh on open, so this step is not optional.
- Filter with the four slicers – one region for a partner review, one tour category for a conservation update – then export that page to PDF.
Real-World Use Cases
Marisol, operations director at a Latin American tour operator. Her quarterly board pack used to be three separate exports. She now filters Region to Latin America and shows the $1.7M of revenue, 893 local jobs supported and $101.2K conservation fund on one page, then flips the same filter onto Booking Trends to argue for more direct-website capacity.
Daniel, head of sustainability at a lodge group. He only cares about where the offset lands. Carbon Offset by Accommodation Type and Total Conservation Fund by Accommodation Type together show Eco Lodge carrying 100.7K of offset and $107.5K of fund while Treehouse Retreat returns 50.4K and $51.3K – the evidence he takes into the next capital request.
Priya, revenue manager. Filtering Tour Category to Birdwatching shows $286.2K of revenue against 152 guests and only 22.1K of carbon offset – the mix she uses to argue that the smallest category is also the lightest-footprint one, and worth promoting into the February trough.
Frequently Asked Questions
Which Excel versions does this work in?
Excel 2016, 2019, 2021, 2024 and Microsoft 365 on Windows, and Excel for Mac. It is a standard .xlsx with pivot tables and slicers – no macros to enable, no add-ins.
How is this different from the Eco-Tourism KPI Dashboard templates?
This is the analytical dashboard line: five exploration pages, 20 charts and free-form slicing across 500 booking records. The Eco-Tourism KPI Dashboard in Excel and its Power BI twin are month-picker scorecards with targets and traffic lights. The names are close, they answer different questions, and this is the one you slice.
Can I add my own destinations, tour categories or operators?
Yes. Type your own values into the Data sheet and refresh – the slicers and charts rebuild around whatever list they find. Nothing is hard-coded to the 15 sample destinations.
What unit is the carbon offset column in?
The workbook does not label it, deliberately – it sums whatever you enter. Pick kilograms or tonnes of CO2e, use it consistently, and note the choice in your own reporting. It is a tracking field, not an audited carbon inventory.
Do the charts update automatically when I paste new data?
They update on refresh. Paste your rows, then Data > Refresh All (Ctrl + Alt + F5) redraws all five pages in one step. The file is not set to refresh on open, so make it the habit.
How many booking records can it hold?
It ships with 500 rows covering 1 January to 30 December 2025 and stays responsive into the tens of thousands. Past roughly 100,000 rows, refresh times become noticeable on an average laptop.
Is any of the sample data real?
No. Destinations, operator names, guest numbers and every figure are realistic sample data used to demonstrate the charts. Replace them before sharing anything externally.
About the Author
Built by PK – Microsoft Certified Professional with 15+ years of Excel, Google Sheets, and Power BI experience. Founder of NextGenTemplates, reaching 300K+ subscribers across YouTube channels. Every template is hand-built and tested before release.
Explore Related Templates
- Eco Lodges Dashboard in Excel – the same build focused on lodge occupancy and property performance.
- Outdoor Adventure Parks Dashboard in Excel – visitor, activity and safety analytics for park operators.
- Adventure Tourism Dashboard in Excel – the adventure-travel edition of this analysis.
- Medical Tourism Dashboard in Excel – inbound treatment travel instead of nature travel.
- Hotel Revenue RevPAR Dashboard in Excel – the accommodation revenue side in detail.
- Eco Lodges Dashboard in Power BI – the Power BI alternative if your data already sits in a model.
- Travel and Tourism Dashboard in Google Sheets – the browser-based alternative.
- Eco-Tourism KPI Dashboard in Excel – the scorecard view of the same subject, with targets and thresholds.
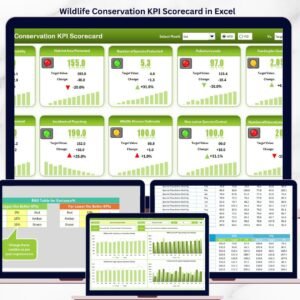
- Wildlife Conservation KPI Scorecard in Excel – conservation outcomes on a one-page scorecard.
- Browse the Excel Dashboard category or every MS Excel template.
Read the full Eco-Tourism Dashboard in Excel walkthrough – a page-by-page guide to every chart in this workbook.
Get the Eco-Tourism Dashboard in Excel for $17.99 (regular $29.99) – instant download, one-time payment, lifetime access, no subscription.
Last updated: 9 September 2026.
Watch the demo video:
Compatibility and Requirements
- Works in Microsoft Excel desktop (Excel 2016 or later, or Microsoft 365), including Excel for Mac. It is a plain .xlsx file, so there are no macros to enable.
- The four slicers (Month, Region, Tour Category and Accommodation Type) filter all five pages together. Microsoft explains them in Use slicers to filter data.
Related Eco-Tourism Templates
- Eco-Tourism Dashboard in Power BI: the Power BI edition of this dashboard
- Eco-Tourism KPI Dashboard in Power BI: a month-picker KPI view in Power BI
- Sustainable Tourism KPI Scorecard in Excel: a scorecard view of sustainability metrics
- Travel & Tourism Dashboard in Excel: the same analytical layout for general travel data
Browse all Excel dashboards or every Power BI dashboard.

























Reviews
There are no reviews yet.