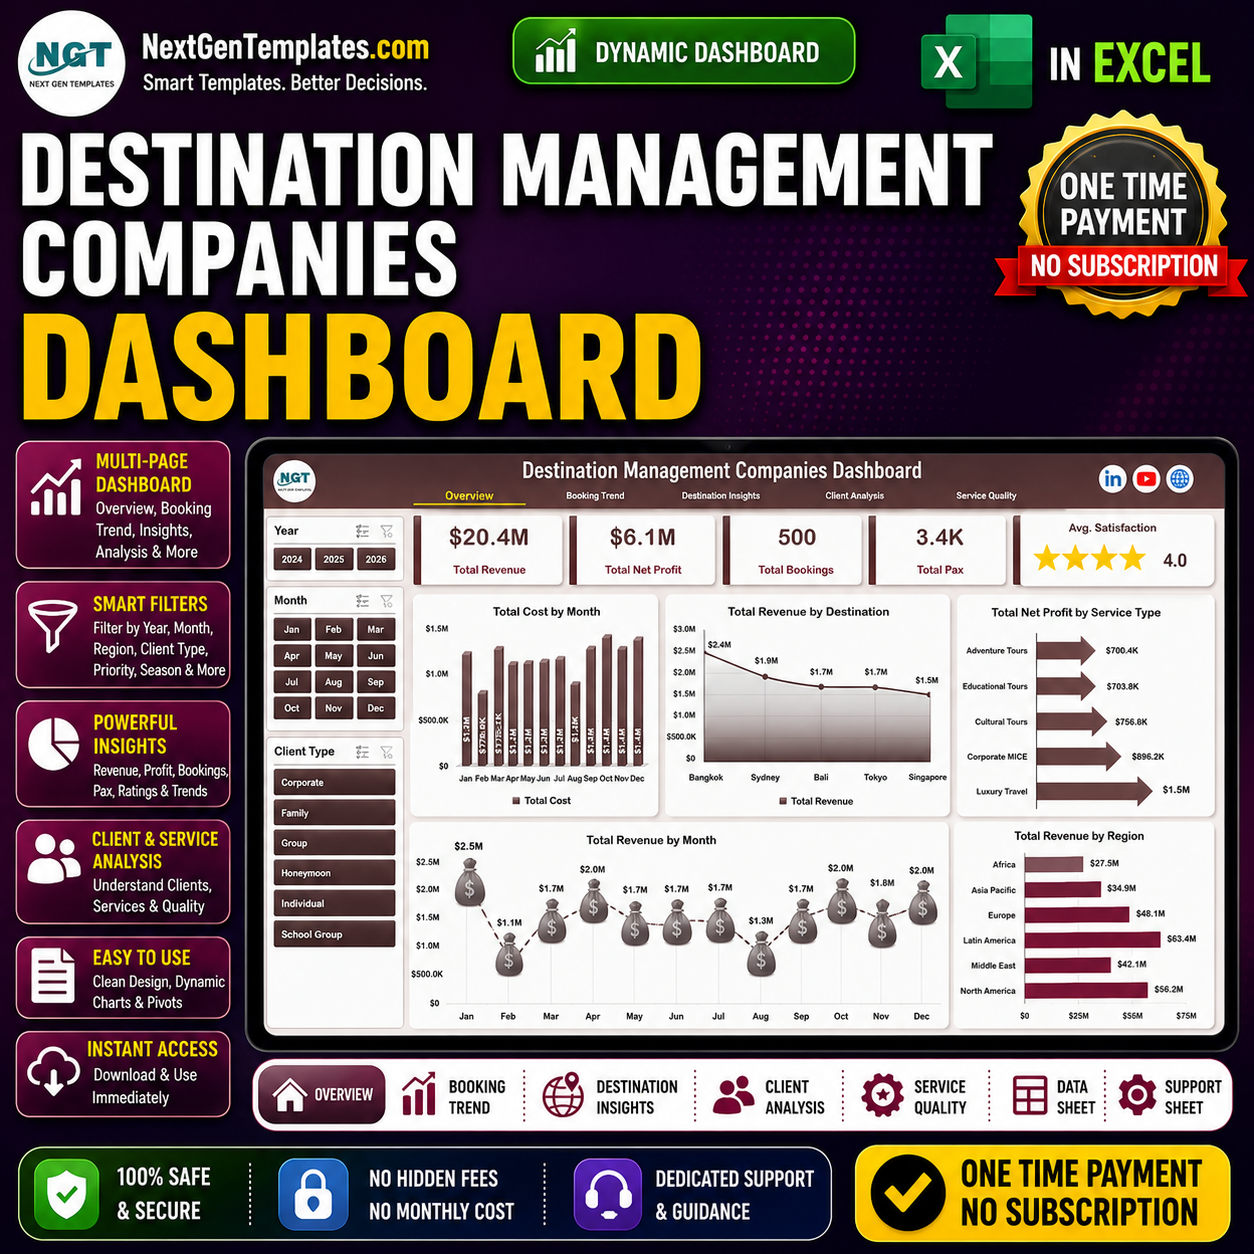
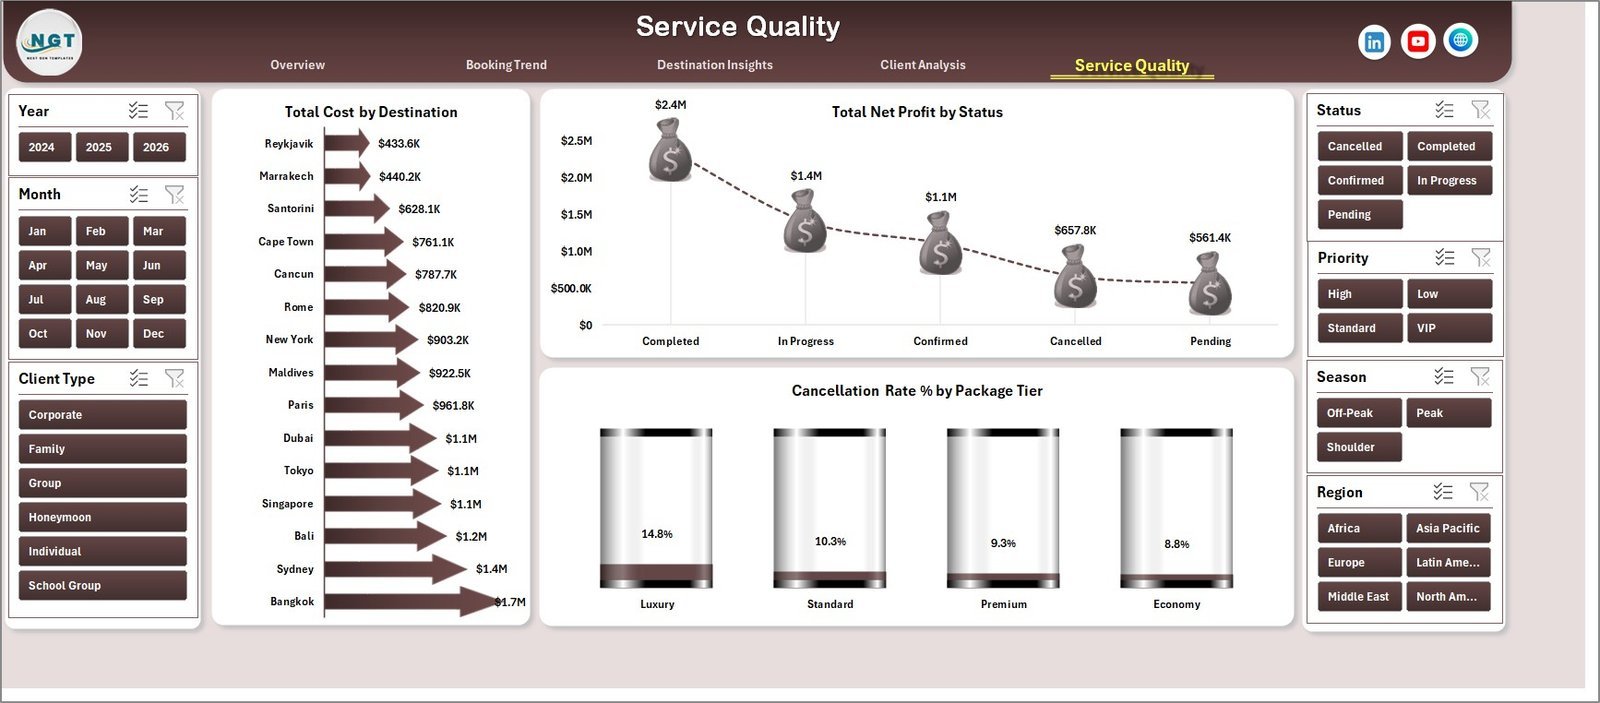

Destination Management Companies Dashboard in Excel helps DMC owners, travel operations managers, event planners, finance analysts, and tourism teams monitor 5 executive KPIs, 5 analysis pages, 20+ charts, slicers, a structured Data Sheet, and a pivot-powered Support Sheet in one editable workbook. Destination management teams handle bookings, clients, vendors, destinations, costs, revenue, service quality, and delivery timelines across fast-moving travel programs. Instead of rebuilding monthly reports manually or paying for a SaaS analytics system, this Excel dashboard gives you a one-time-purchase reporting layer that can be updated by replacing the sample data and clicking Refresh All. Instant download, lifetime access, no subscription, and no per-user fees.
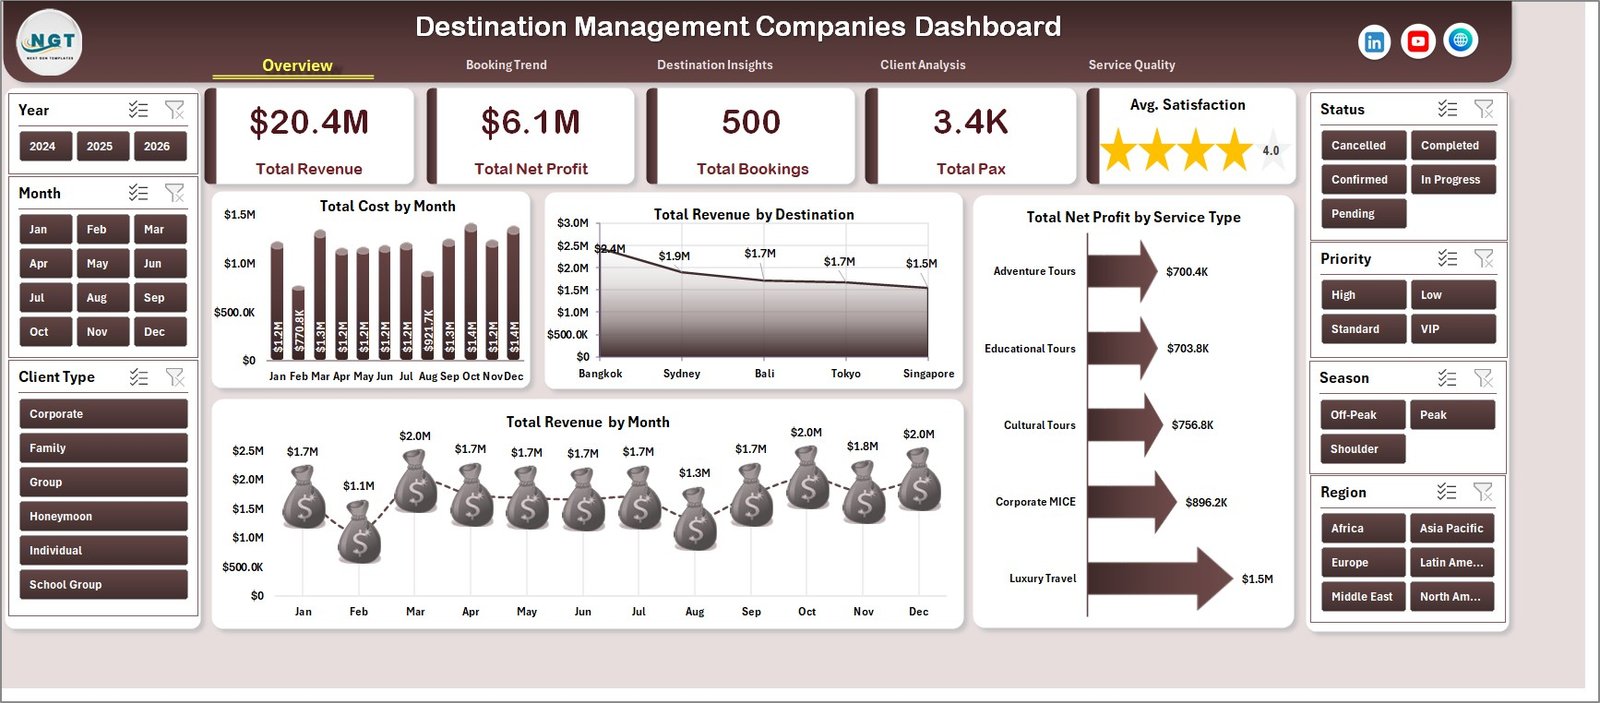
Destination Management Companies Dashboard in Excel
Key Features of Destination Management Companies Dashboard in Excel
- 5 dashboard pages: Overview, Booking Trend, Destination Analysis, Client and Vendor Analysis, and Operations.
- Executive KPI cards: Track revenue, cost, bookings, profit, and average satisfaction from one control view.
- 20+ built-in charts: Review monthly trends, package performance, destination mix, vendor cost, client type, and operational status.
- Interactive slicers: Filter quickly by destination, package type, client type, booking status, vendor, month, region, and year.
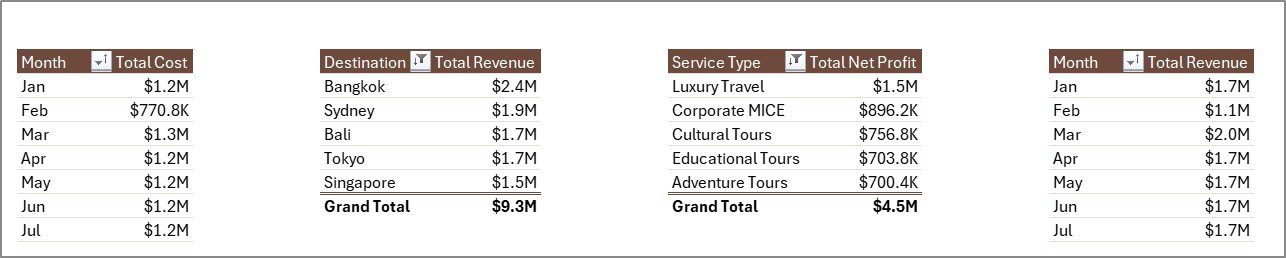
- Pivot-driven reporting: Update the Data Sheet, use Refresh All, and the dashboard pages refresh through the Support Sheet pivots.
- Editable Excel workbook: Customize headings, charts, slicers, fields, colors, and data columns to match your DMC reporting process.
What’s Inside the Destination Management Companies Dashboard in Excel
1. Overview Page
The Overview page gives leadership a quick view of destination management performance. Cards summarize core metrics such as Total Revenue, Total Cost, Total Bookings, Net Profit, and Avg. Satisfaction. This page is useful for weekly management meetings, monthly reviews, and quick business health checks.
Revenue and cost charts help teams understand whether bookings are producing healthy margins. Booking status and package charts show where demand is coming from and where follow-up is needed. Month-wise trend visuals help identify peak travel periods and quieter months.
2. Booking Trend
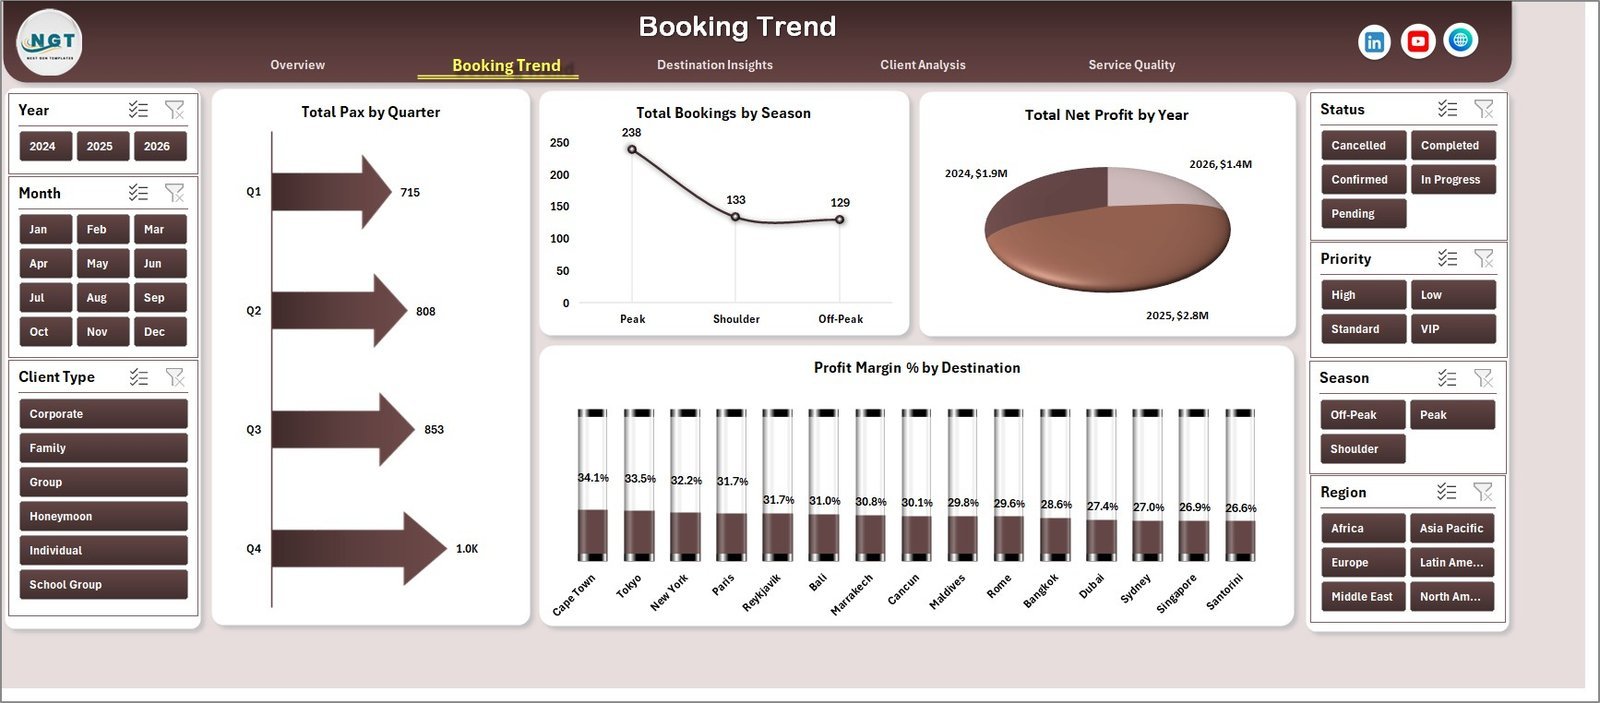
The Booking Trend page focuses on demand movement, package activity, and seasonal performance. Use it to review booking volume by month or year, compare package categories, and identify whether specific client segments are growing or slowing down.
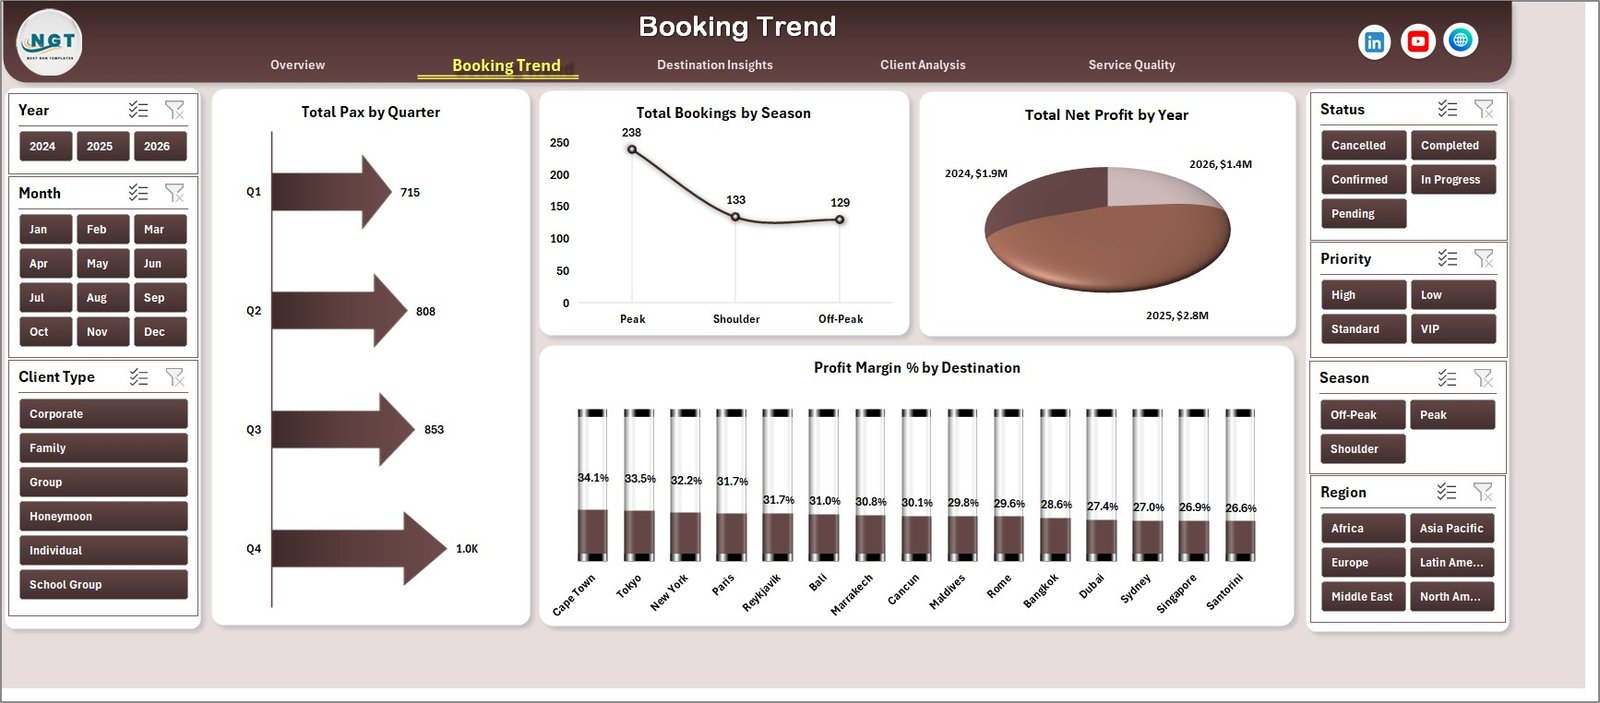
Booking Trend
3. Destination Analysis
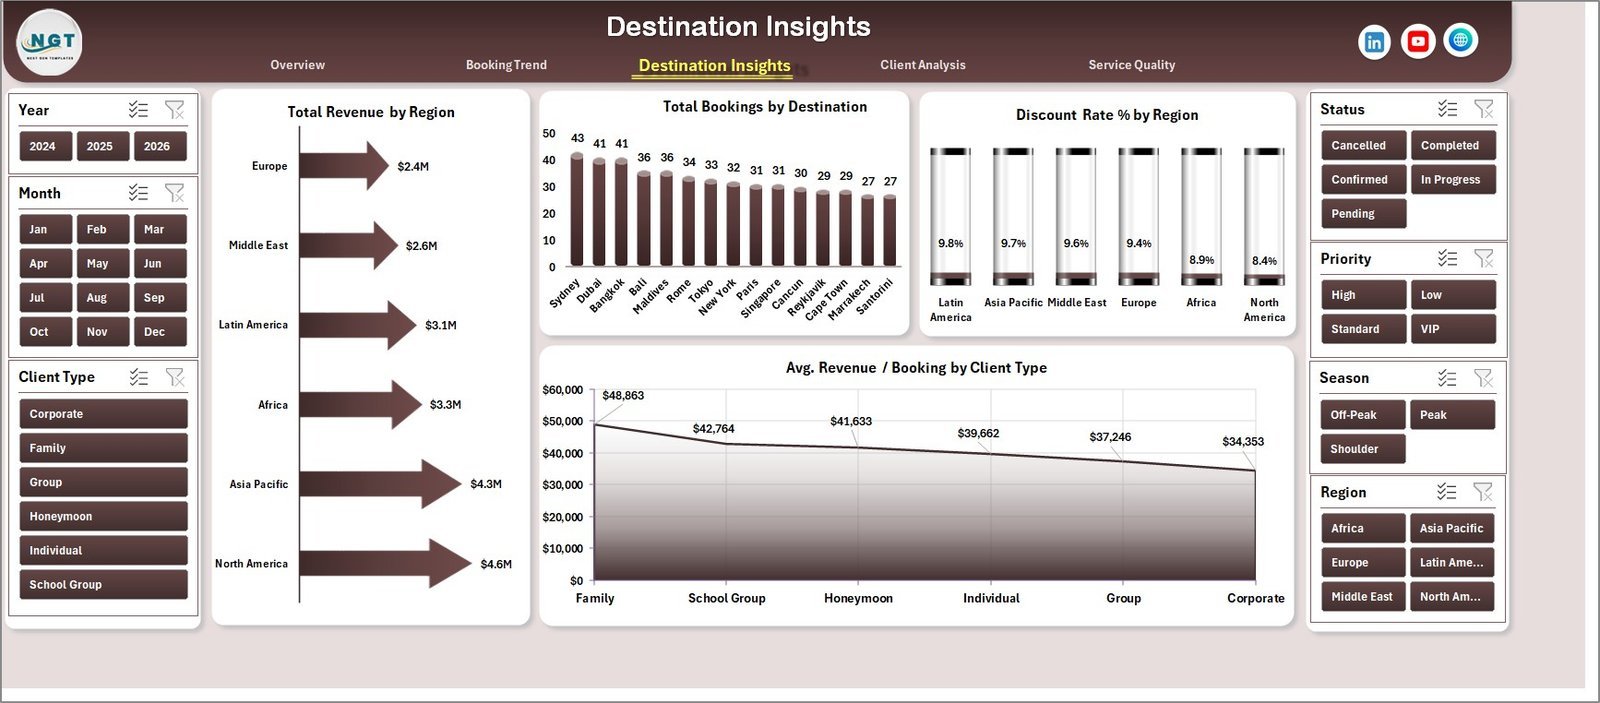
The Destination Analysis page explains which destinations, regions, or tour categories contribute the most revenue and activity. DMC teams can use this page to compare high-performing destinations, investigate low-margin locations, and plan sales campaigns around proven demand patterns.
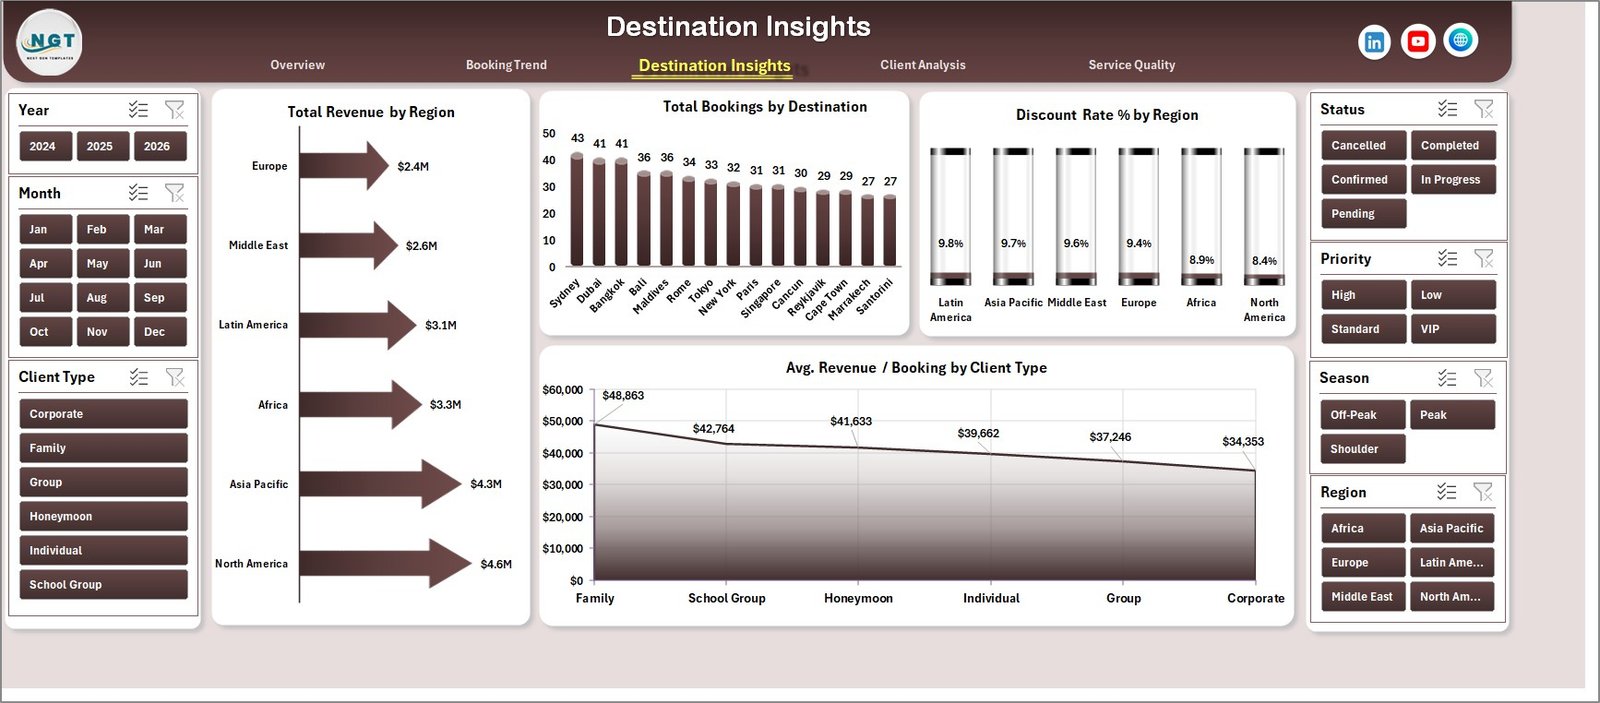
Destination Analysis
4. Client and Vendor Analysis
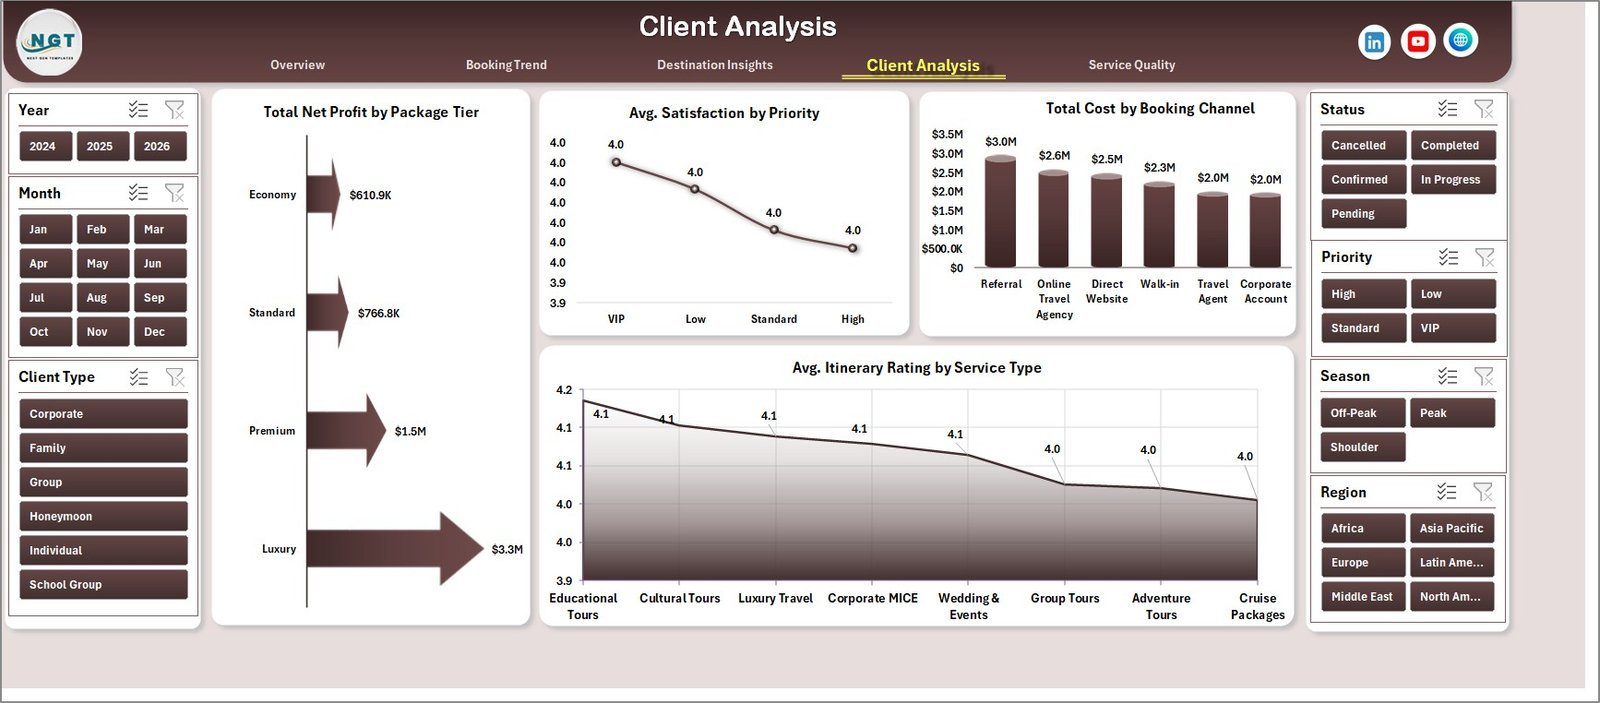
The Client and Vendor Analysis page connects customer demand with supplier and partner performance. Review client type, vendor cost, partner contribution, and service patterns so account managers can spot profitable segments and operations teams can manage vendor conversations with data.
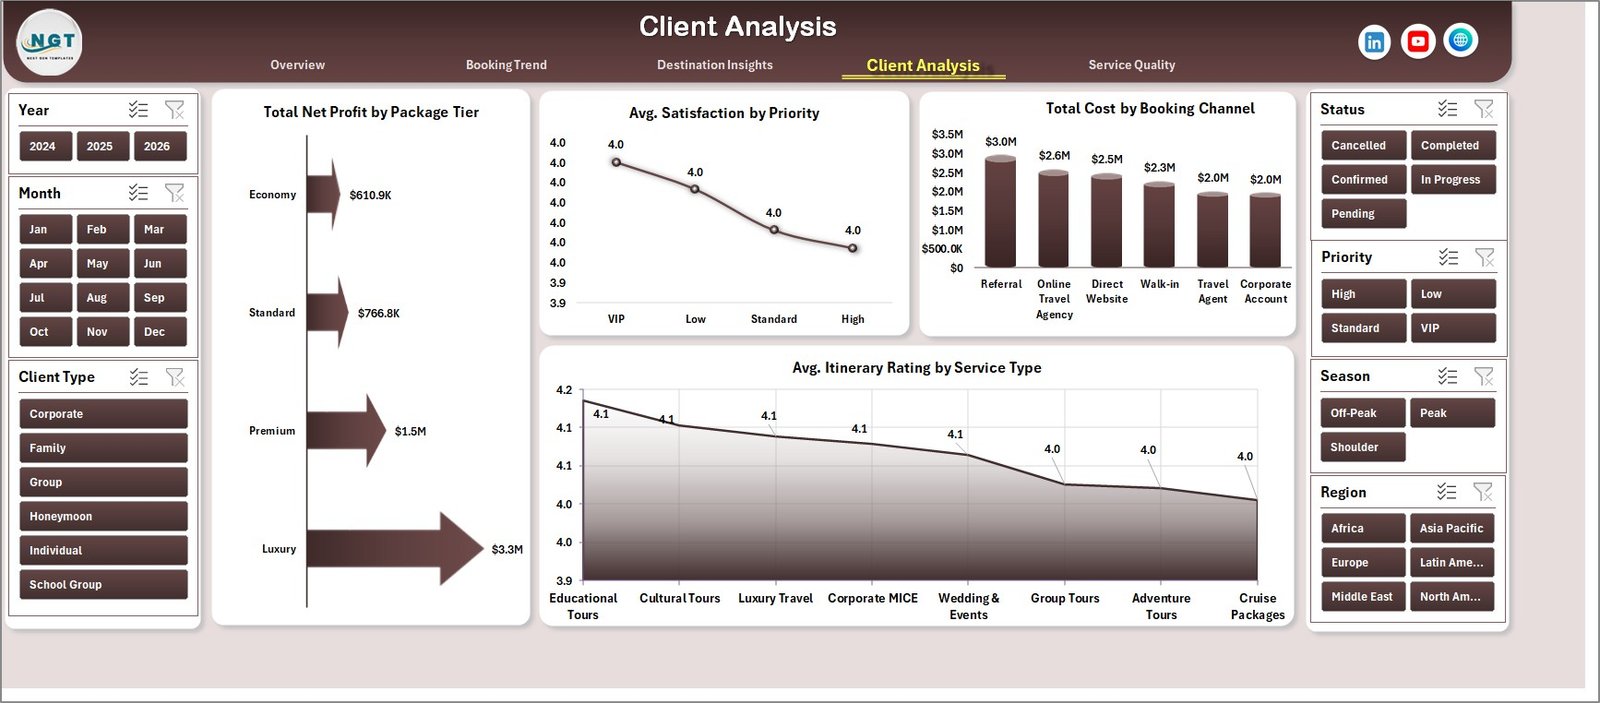
Client and Vendor Analysis
5. Operations
The Operations page helps managers review delivery status, turnaround, cost behavior, and service outcomes. It is useful for identifying delays, tracking completed vs pending work, and preparing internal operations reviews.
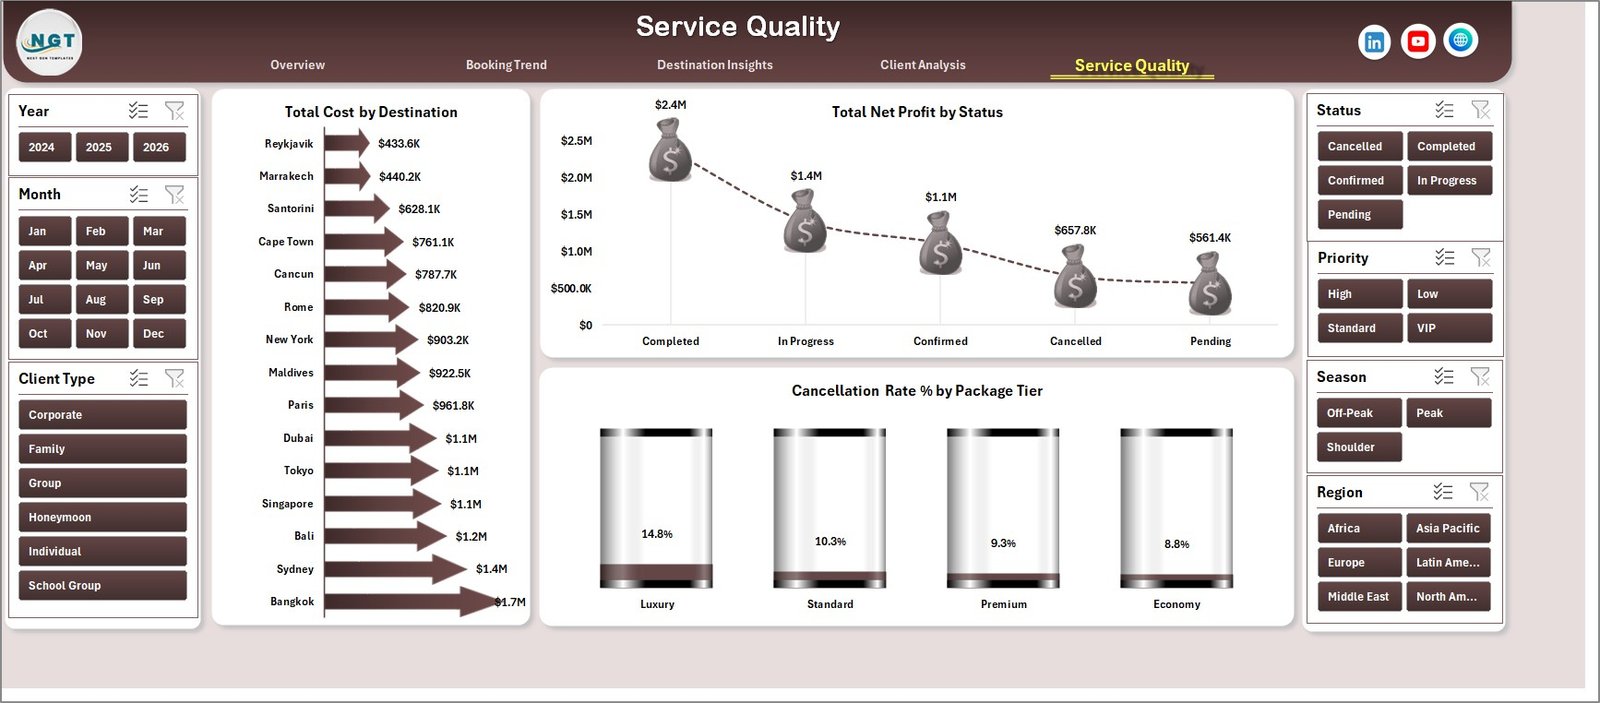
Operations
6. Data Sheet Tab
The Data Sheet is where you add or replace records in the same format. Keep the column structure consistent, then refresh the workbook to update all visuals. Typical DMC records may include booking date, client type, destination, package, vendor, booking status, revenue, cost, profit, and satisfaction fields.

Data Sheet tab
7. Support Sheet
The Support Sheet contains the pivot tables used to build the dashboard dynamically. After updating the Data Sheet, go to the Data tab in Excel and click Refresh All. You can keep this sheet hidden while sharing the dashboard with end users.
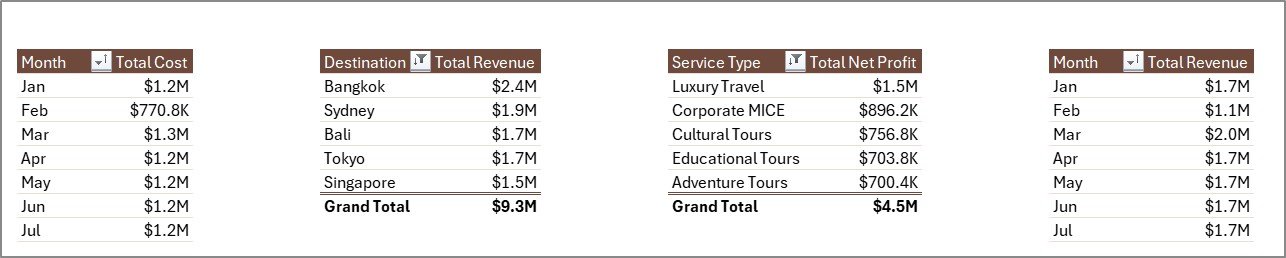
Support sheet tab
Destination Management Companies Dashboard in Excel vs. Google Sheets vs. Paid Travel SaaS – Where This Fits
| Feature | This Excel Dashboard | Google Sheets Alternative | Paid Travel SaaS |
|---|---|---|---|
| Cost | $17.99 one-time | Low cost, online dependent | Monthly or annual subscription |
| Platform | Microsoft Excel | Browser-based spreadsheet | Vendor cloud system |
| Setup time | Update data and refresh | Copy sheet and adjust formulas | Implementation project |
| Offline use | Yes | Limited | No |
| Custom fields | Fully editable workbook | Editable sheet | Depends on plan |
| Year-1 cost at 5 users | $17.99 total | Usually low | Often hundreds or thousands |
Who This Template Is For – and Who It’s Not For
This template is for destination management companies, inbound tour operators, travel coordinators, MICE and event planners, tourism operations teams, finance analysts, and business owners that need repeatable Excel reporting for bookings, destinations, clients, vendors, costs, revenue, profit, and satisfaction.
It is not a live reservation engine, CRM, accounting system, ticketing platform, or real-time supplier portal. Use it for reporting and analysis after exporting or entering approved operational data.
How to Use the Destination Management Companies Dashboard in Excel
- Download and unzip the file.
- Open the workbook in Microsoft Excel.
- Go to the Data Sheet and replace the sample data with your own DMC records.
- Keep the same column structure.
- Click Data, then Refresh All.
- Use slicers to review bookings, destinations, packages, vendors, client types, status, and time periods.
- Hide the Support Sheet before sharing the workbook with end users.
Real-World Use Cases
Anita, DMC Operations Manager: Anita uses the Overview and Operations pages before weekly reviews to identify booking status issues, high-cost vendors, and destination-level trends.
Rahul, Travel Business Owner: Rahul reviews revenue, cost, and profit by package type to decide which travel packages should be promoted during the next campaign.
Maria, Event Travel Coordinator: Maria uses the Client and Vendor Analysis page to prepare vendor negotiations and improve service planning for group travel programs.
Frequently Asked Questions
What KPIs are included?
The dashboard focuses on executive DMC reporting such as revenue, cost, bookings, profit, satisfaction, destination performance, package trends, client mix, vendor cost, and operational status.
Does this workbook require macros?
No. It is built with Excel tables, pivot tables, charts, and slicers.
Can I use my own destinations, packages, and vendors?
Yes. Replace the sample records in the Data Sheet and refresh the workbook.
Can the Support Sheet be hidden?
Yes. The Support Sheet stores pivot tables and can be hidden after setup.
Which Excel version should I use?
Use Microsoft Excel 2016 or later, including Microsoft 365, for best results.
Is this a booking management system?
No. It is an Excel reporting dashboard for analysis after your booking, finance, or operations data has been exported or entered.
About the Author
Built by PK – Microsoft Certified Professional with 15+ years of Excel, Google Sheets, and Power BI experience. Founder of NextGenTemplates, reaching 300K+ subscribers across YouTube channels. Every template is hand-built and tested before release.
Explore Related Templates
Explore more Excel Dashboard Templates and travel analytics templates. Related products include Destination Management Companies KPI Dashboard in Excel, Destination Management Companies KPI Dashboard in Power BI, and Adventure Tourism KPI Dashboard in Excel.
Ready to monitor DMC performance in Excel? Download the Destination Management Companies Dashboard in Excel, update the Data Sheet, refresh the workbook, and start reviewing bookings, destinations, vendors, costs, and profit today.
Watch the step-by-step video tutorial: