

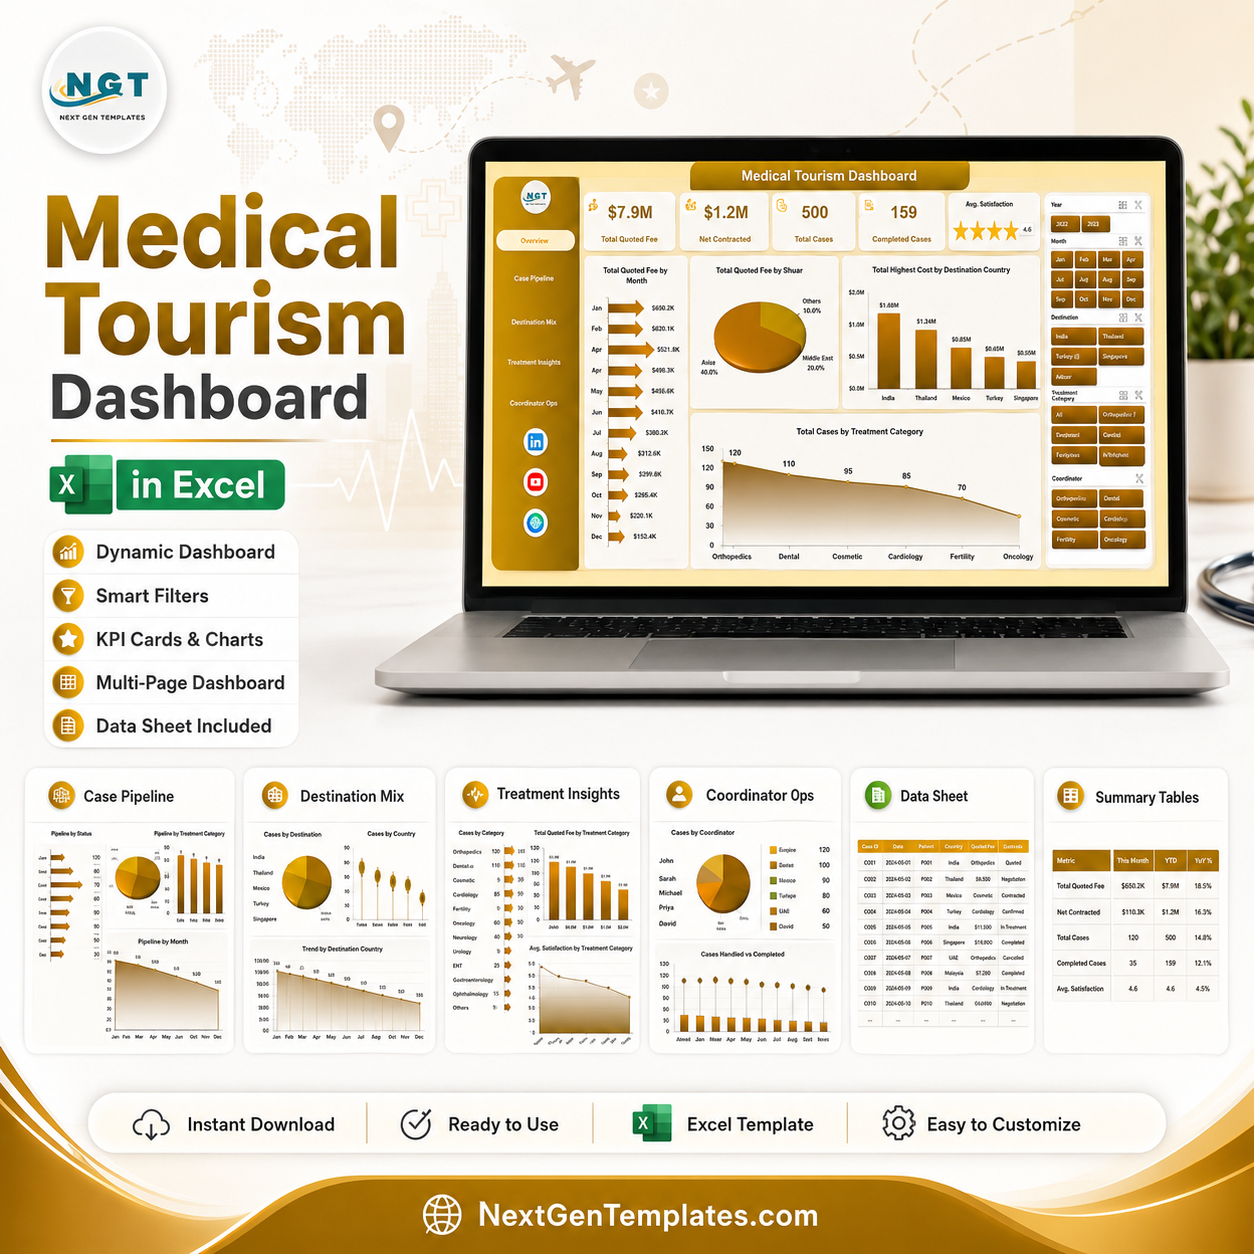


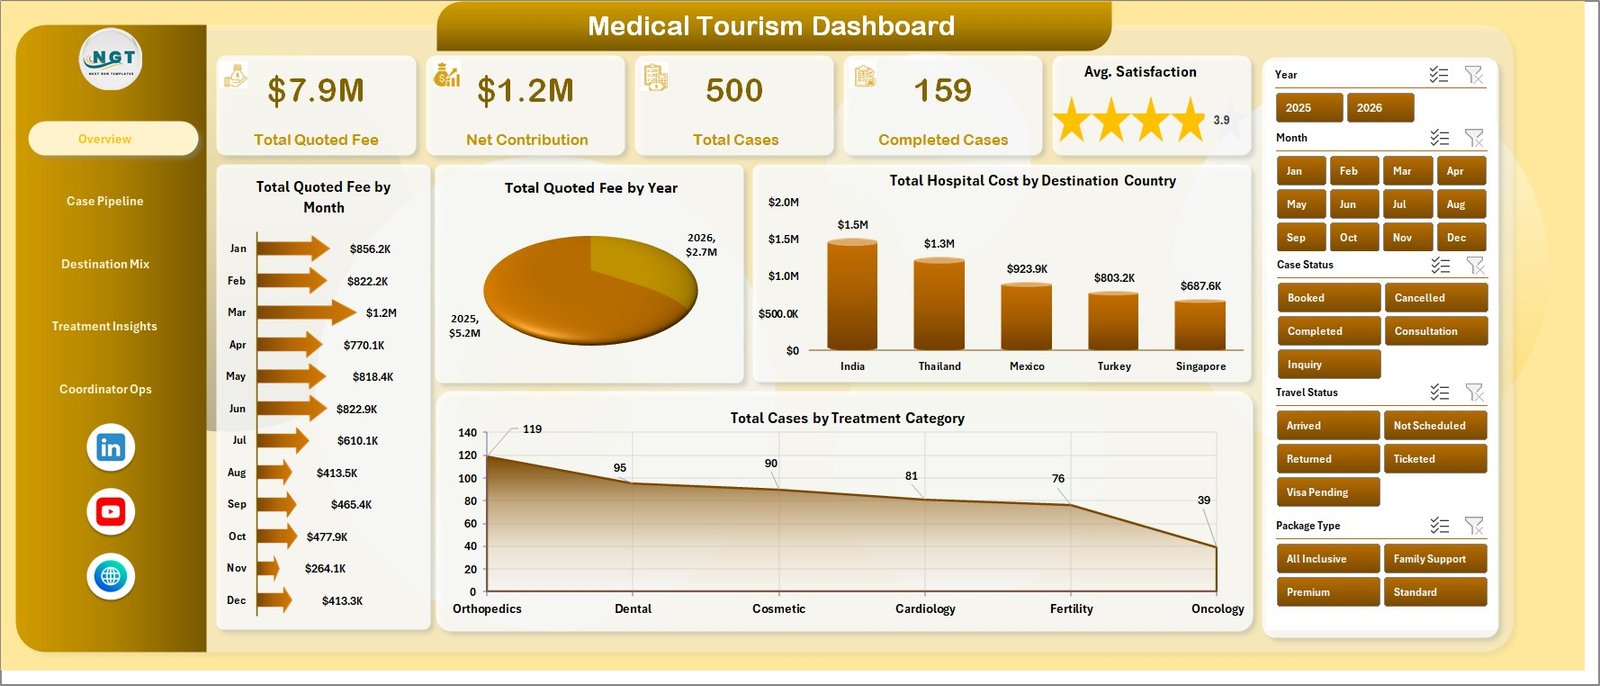
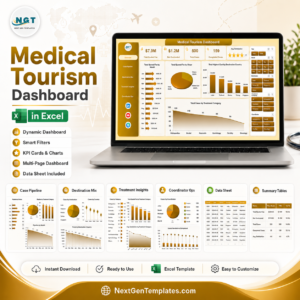
Medical Tourism Dashboard in Excel gives medical tourism agencies, hospitals, care coordinators, and healthcare travel consultants a structured way to review 5 KPI cards, 16 analysis charts, 7 worksheet tabs, and multiple slicers in one editable Excel file. Instead of manually rebuilding monthly reports for quoted fees, hospital costs, travel costs, cases, destinations, treatments, coordinators, and satisfaction, you can paste your data into the data sheet, refresh the workbook, and review the updated dashboard quickly. This template is a one-time download, works in Microsoft Excel, and is built for teams that want clear reporting without committing to an expensive healthcare CRM or BI implementation.
Medical Tourism Dashboard in Excel
Key Features of Medical Tourism Dashboard in Excel
- 5 executive cards: Total Quoted Fee, Net Contribution, Total Cases, Completed Cases, and Avg. Satisfaction.
- 5 dashboard pages: Overview, Case Pipeline, Destination Mix, Treatment Insights, and Coordinator Ops.
- 16 ready-made charts: Analyze monthly fee trends, yearly fee movement, destination cost, treatment categories, pipeline status, referral channels, hospitals, package types, procedures, coordinators, travel status, cancellations, and contribution margin.
- Excel slicers: Filter the dashboard quickly during team meetings, case reviews, finance reviews, and destination planning sessions.
- Editable data sheet: Replace the sample data with your own medical tourism records in the same format.
- Pivot-backed support sheet: Refresh all pivots and charts from the Excel Data tab after updating the data sheet.
- No subscription: Buy once and adapt the workbook for your own approved internal reporting process.
What’s Inside the Medical Tourism Dashboard in Excel
Overview Page
The Overview page shows the main performance cards for Total Quoted Fee, Net Contribution, Total Cases, Completed Cases, and Avg. Satisfaction. It also includes chart analysis for Total Quoted Fee by Month, Total Quoted Fee by Year, Total Hospital Cost by Destination Country, and Total Cases by Treatment Category.
Total Quoted Fee by Month: This chart highlights how quoted patient revenue changes across months. It helps managers identify seasonal demand, campaign impact, and months that need stronger inquiry conversion.
Total Quoted Fee by Year: This chart compares yearly quoted fee movement. It helps leadership understand whether the medical travel pipeline is growing, flat, or declining over time.
Total Hospital Cost by Destination Country: This chart compares hospital cost by destination country. It helps teams review country-level cost pressure and negotiate better provider terms.
Total Cases by Treatment Category: This chart shows case volume across treatment categories. It helps identify which medical procedures generate the most demand.
Case Pipeline
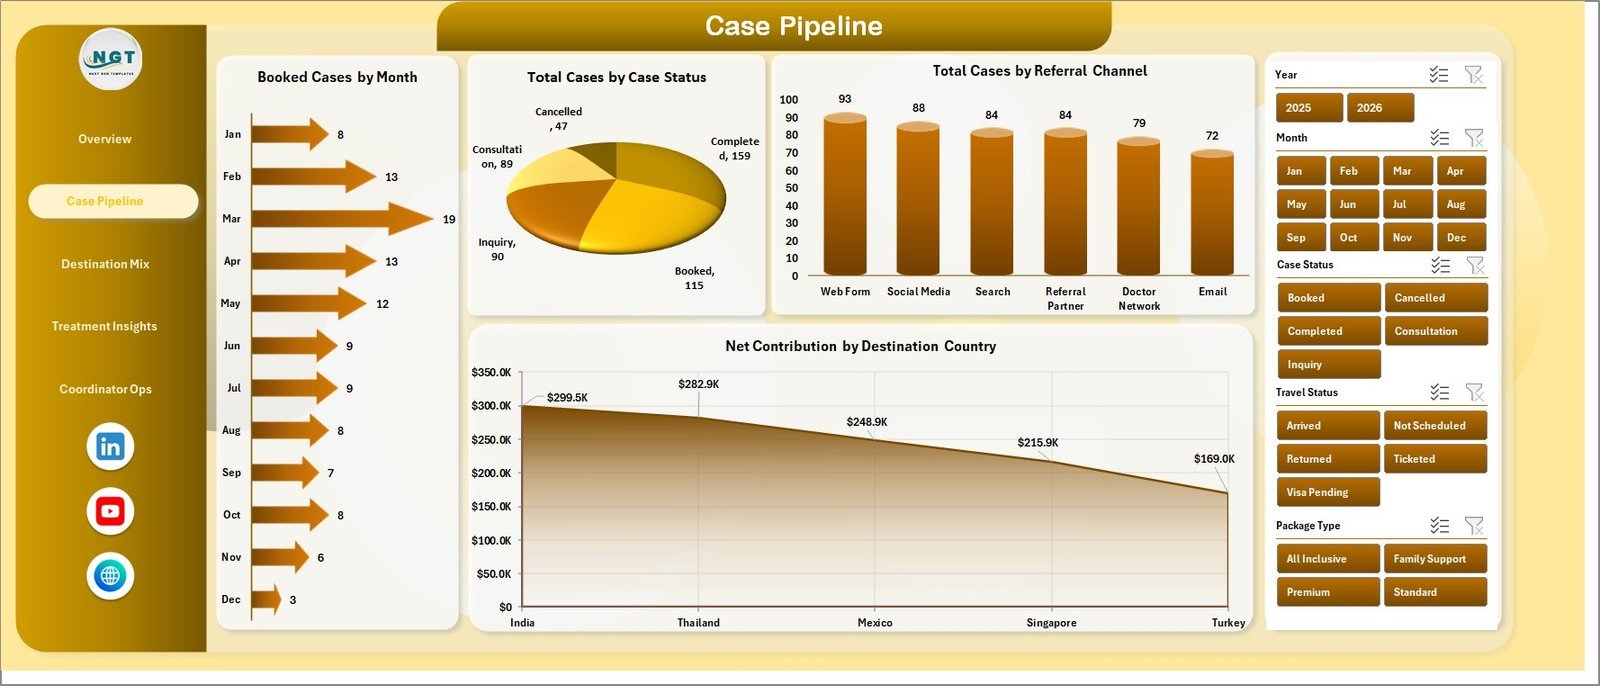
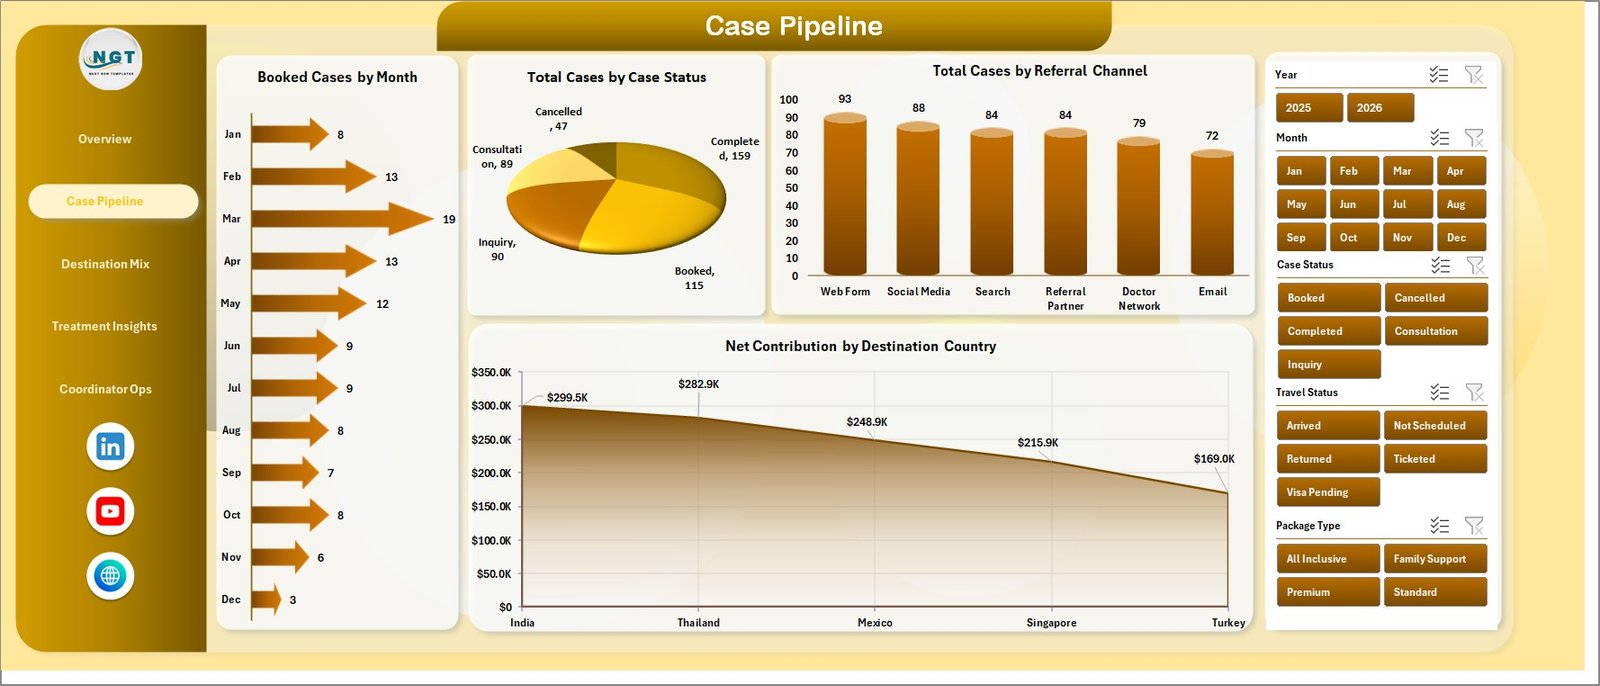
The Case Pipeline page explains booking flow, case status, referral source, and destination contribution. Charts include Booked Cases by Month, Total Cases by Case Status, Total Cases by Referral Channel, and Net Contribution by Destination Country.
Case Pipeline
Destination Mix
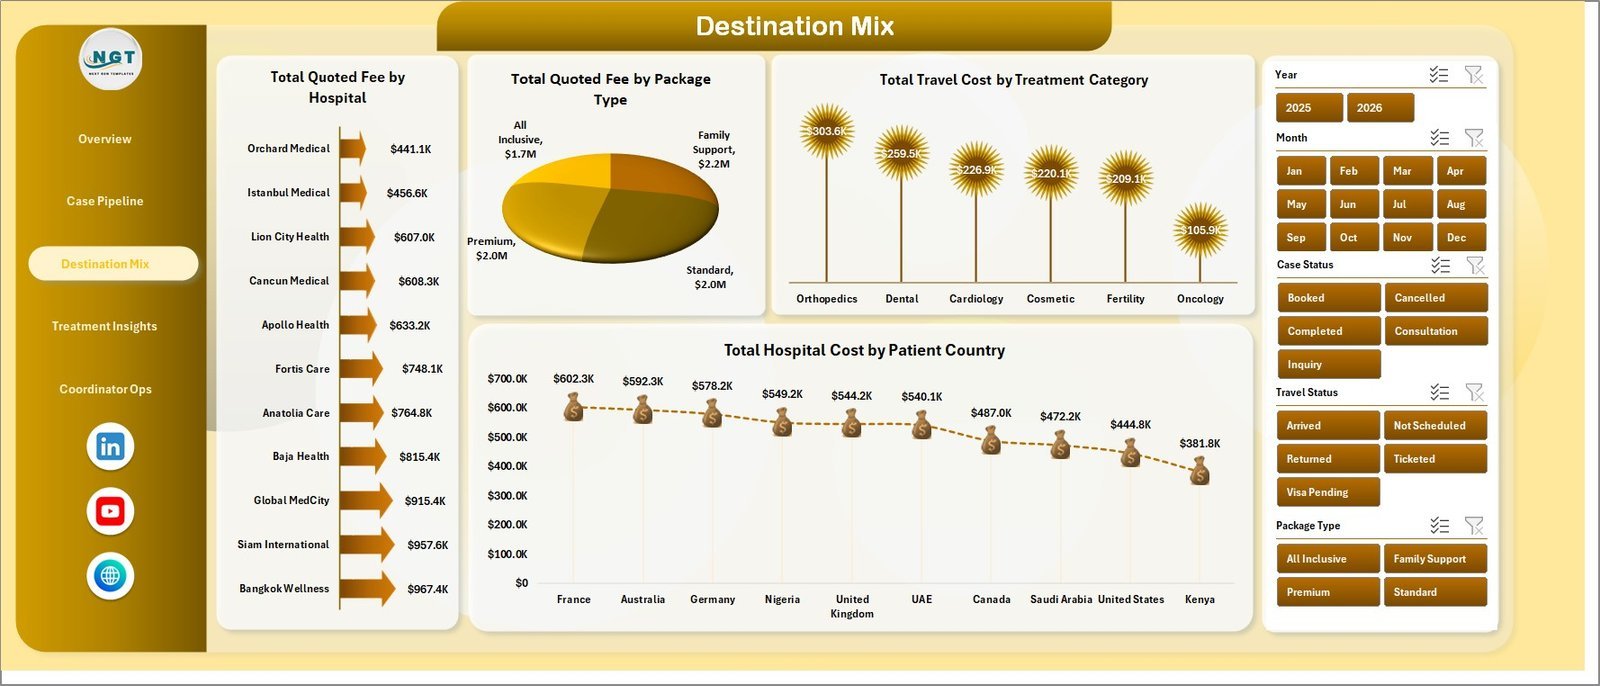
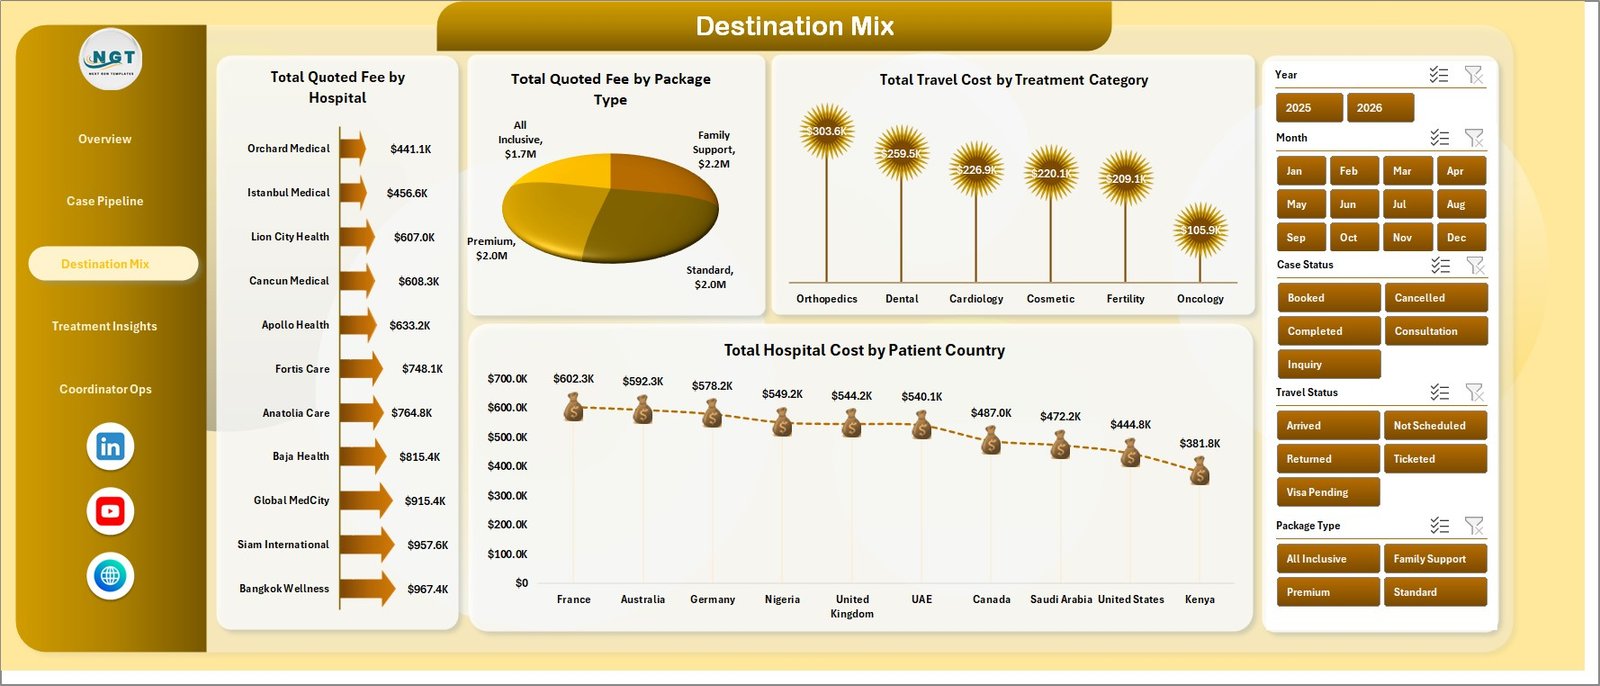
The Destination Mix page reviews the commercial and cost mix by hospital, package type, treatment category, and patient country. Charts include Total Quoted Fee by Hospital, Total Quoted Fee by Package Type, Total Travel Cost by Treatment Category, and Total Hospital Cost by Patient Country.
Destination Mix
Treatment Insights
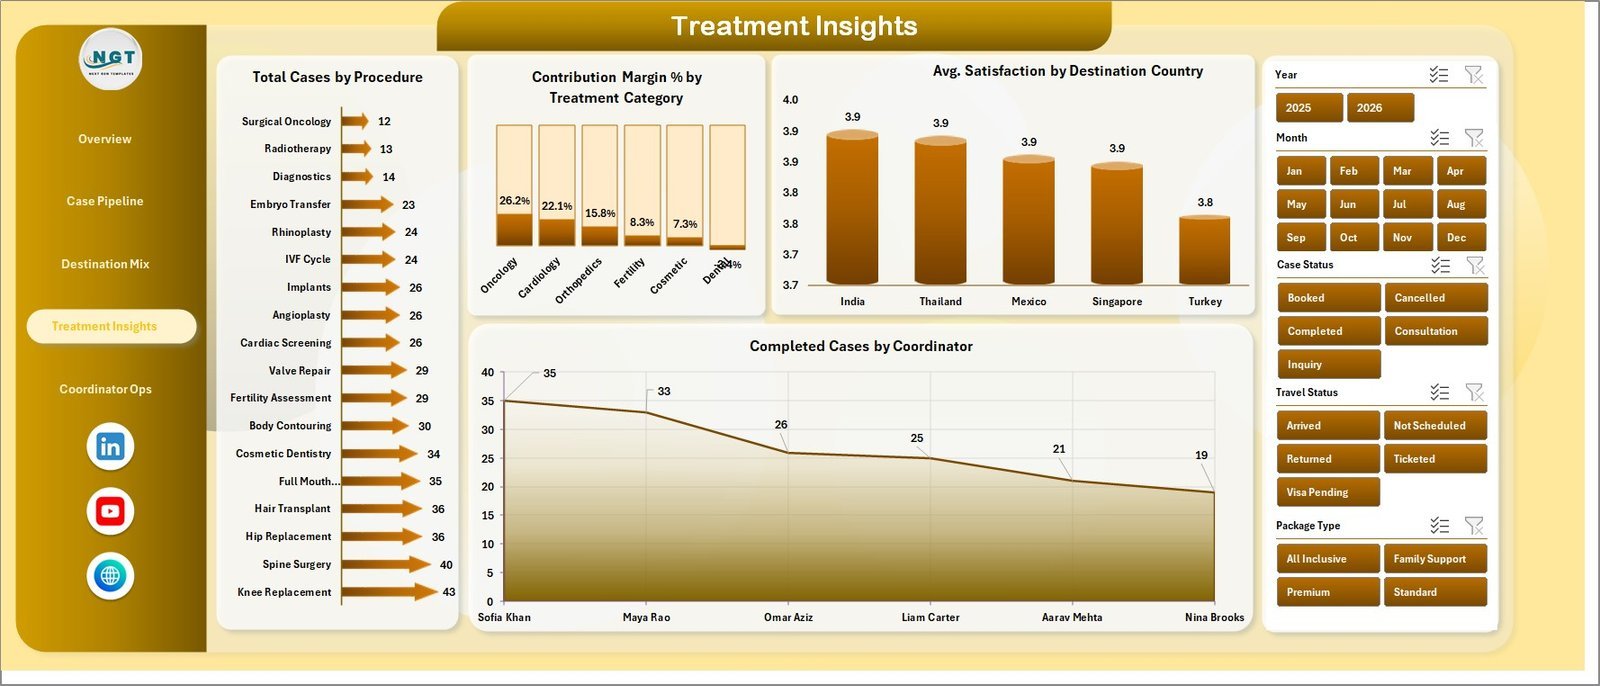
The Treatment Insights page helps users compare procedure demand, contribution margin, satisfaction, and coordinator output. Charts include Total Cases by Procedure, Contribution Margin % by Treatment Category, Avg. Satisfaction by Destination Country, and Completed Cases by Coordinator.
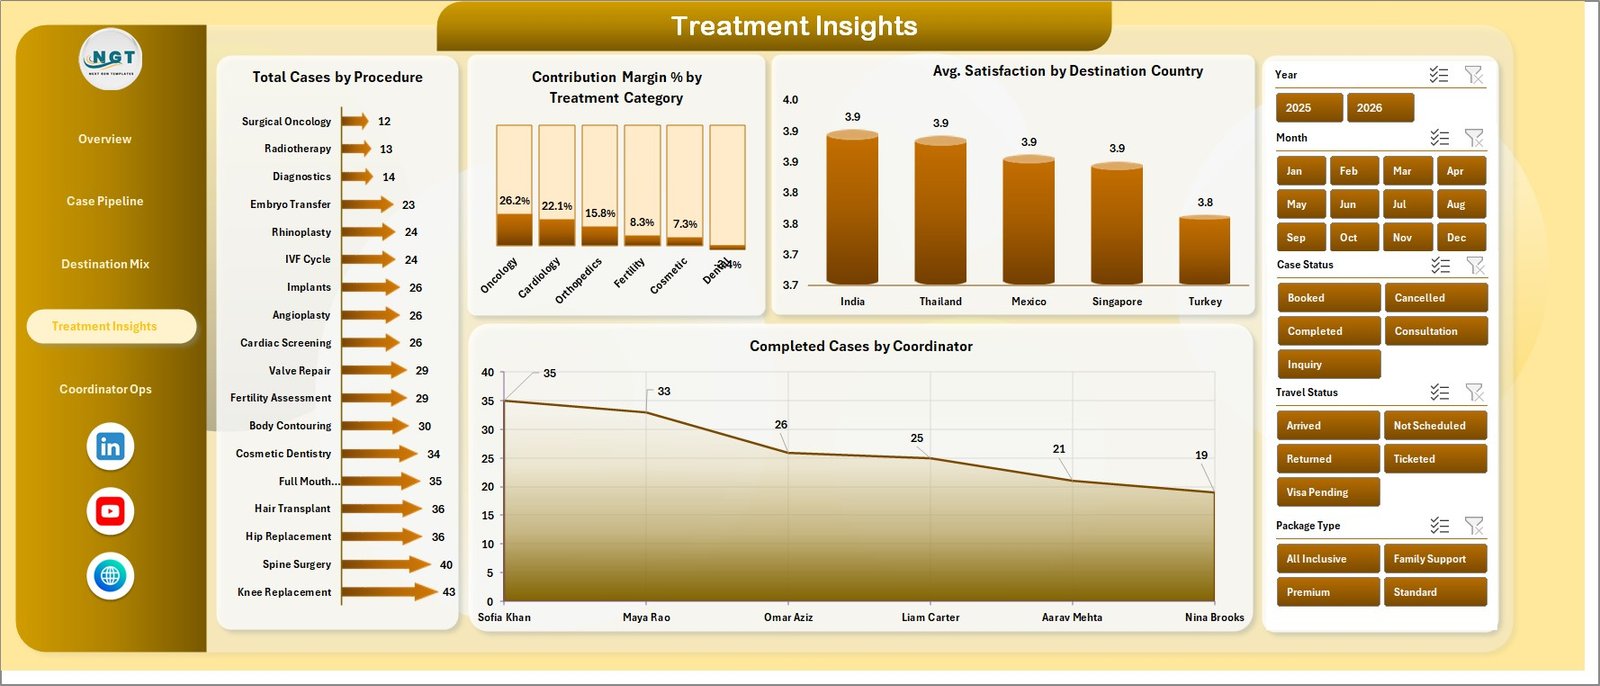
Treatment Insights
Coordinator Ops
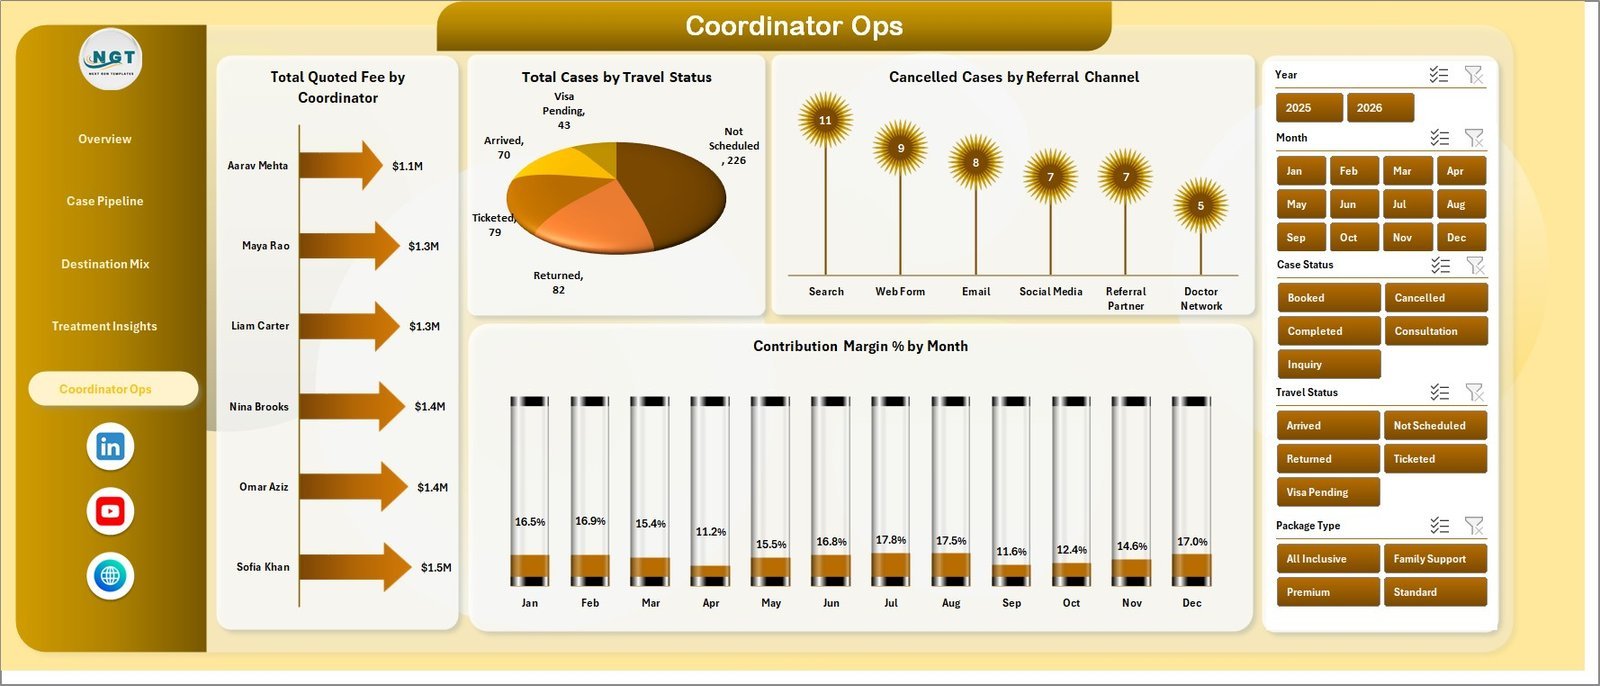
The Coordinator Ops page focuses on employee workload, travel status, cancelled cases, and margin trend. Charts include Total Quoted Fee by Coordinator, Total Cases by Travel Status, Cancelled Cases by Referral Channel, and Contribution Margin % by Month.
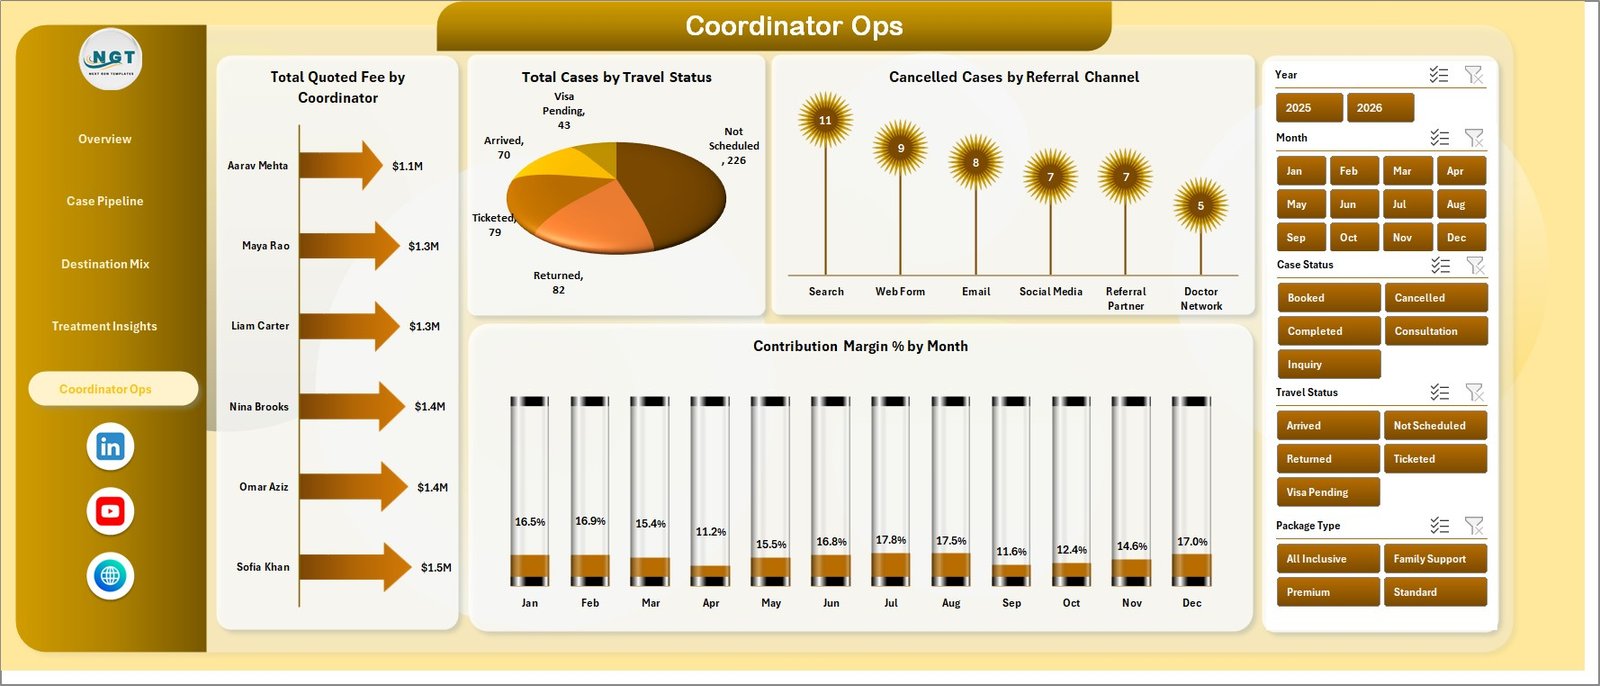
Coordinator Ops
Data Sheet Tab
The Data Sheet is where you enter or paste your medical tourism data in the same format. After updating the records, refresh the workbook to update the pivots, charts, cards, and dashboard pages.

Data Sheet tab
Support Sheet Tab
The Support Sheet contains pivot tables used to create the dashboard dynamically. Go to the Data tab in the Excel Ribbon and click Refresh All after updating the data sheet; you can keep this support sheet hidden for day-to-day use.

Support sheet tab
Medical Tourism Dashboard in Excel vs. Google Sheets vs. Paid CRM/SaaS – Where This Fits
| Feature | This Excel Dashboard | Google Sheets Alternative | Paid Healthcare CRM/SaaS |
|---|---|---|---|
| Cost | $17.99 sale price | Usually free to build, but manual setup required | Monthly or annual subscription |
| Platform | Microsoft Excel | Browser-based spreadsheet | Vendor-hosted system |
| Setup time | Open workbook, replace data, refresh | Build sheets, charts, and formulas | Implementation and onboarding |
| Real-time team collaboration | Possible with OneDrive/SharePoint | Native collaboration | Usually seat-based |
| Mobile access | Limited by Excel viewer experience | Good browser/mobile access | Usually included |
| Customizable fields | Fully editable workbook | Fully editable but needs setup | Limited by vendor configuration |
| Share with link | Possible through cloud storage | Native link sharing | Login controlled |
| Year-1 cost at 5 users | $17.99 plus Excel you already use | Your build time plus workspace cost | Often hundreds or thousands |
| Medical tourism reporting structure | Already built across 7 tabs | Must be designed | Depends on vendor module |
Who This Template Is For – and Who It’s Not For
This template is for medical tourism agencies, hospital international patient departments, healthcare travel coordinators, destination partners, consultants, and analysts who manage structured case data and need a clear Excel reporting layer. It is not a booking engine, CRM, payment gateway, hospital information system, or patient communication platform. Use it for analysis after your operational data is ready.
How to Use the Medical Tourism Dashboard in Excel
- Download and open the Excel workbook.
- Go to the Data Sheet tab and replace the sample records with your own data in the same columns.
- Use Excel’s Data tab and click Refresh All.
- Review the Overview, Case Pipeline, Destination Mix, Treatment Insights, and Coordinator Ops pages.
- Use slicers to filter the dashboard by the fields relevant to your review.
- Keep the Support Sheet hidden if you want a cleaner workbook for business users.
Real-World Use Cases
Medical tourism agency owner: Reviews quoted fees, hospital cost, net contribution, and destination mix before deciding which countries and hospitals need more sales focus.
Case coordinator lead: Uses Coordinator Ops and Case Pipeline pages to monitor completed cases, cancellations, travel status, and workload distribution.
Healthcare consultant: Uses the workbook to prepare client reporting for treatment category demand, package mix, referral channel performance, and satisfaction trends.
Frequently Asked Questions
Can I use this dashboard with my own data?
Yes. Replace the sample records in the Data Sheet tab with your own medical tourism data in the same format, then refresh the workbook.
Do I need advanced Excel skills?
No. Basic Excel skills are enough for data entry, filtering, and refresh. Users who know PivotTables can customize it further.
Does this template include macros?
No VBA macro requirement is described for this dashboard. The workbook is designed around Excel sheets, slicers, charts, and pivot-backed reporting.
Can I customize the charts and fields?
Yes. You can edit chart titles, colors, formulas, pivot tables, labels, and sheet structure in Excel.
Is this a CRM for managing patient communication?
No. It is an Excel dashboard for reporting and analysis, not a CRM, booking system, billing system, or messaging platform.
Can I hide the Support Sheet?
Yes. The support sheet can stay hidden after setup because it mainly supports pivot tables and dashboard refresh logic.
About the Author
Built by PK – Microsoft Certified Professional with 15+ years of Excel, Google Sheets, and Power BI experience. Founder of NextGenTemplates, reaching 300K+ subscribers across YouTube channels. Every template is hand-built and tested before release.
Explore Related Templates
You may also like Medical Tourism KPI Dashboard in Excel, Medical Tourism KPI Dashboard in Power BI, and Hospital Equipment Leasing Dashboard in Power BI. Browse more MS Excel templates and Excel Dashboard templates.
Click here to read the detailed blog post.
Download the Medical Tourism Dashboard in Excel today and start reviewing cases, destinations, treatments, costs, contribution, coordinators, and satisfaction in one workbook.
Last updated: July 8, 2026.











Reviews
There are no reviews yet.