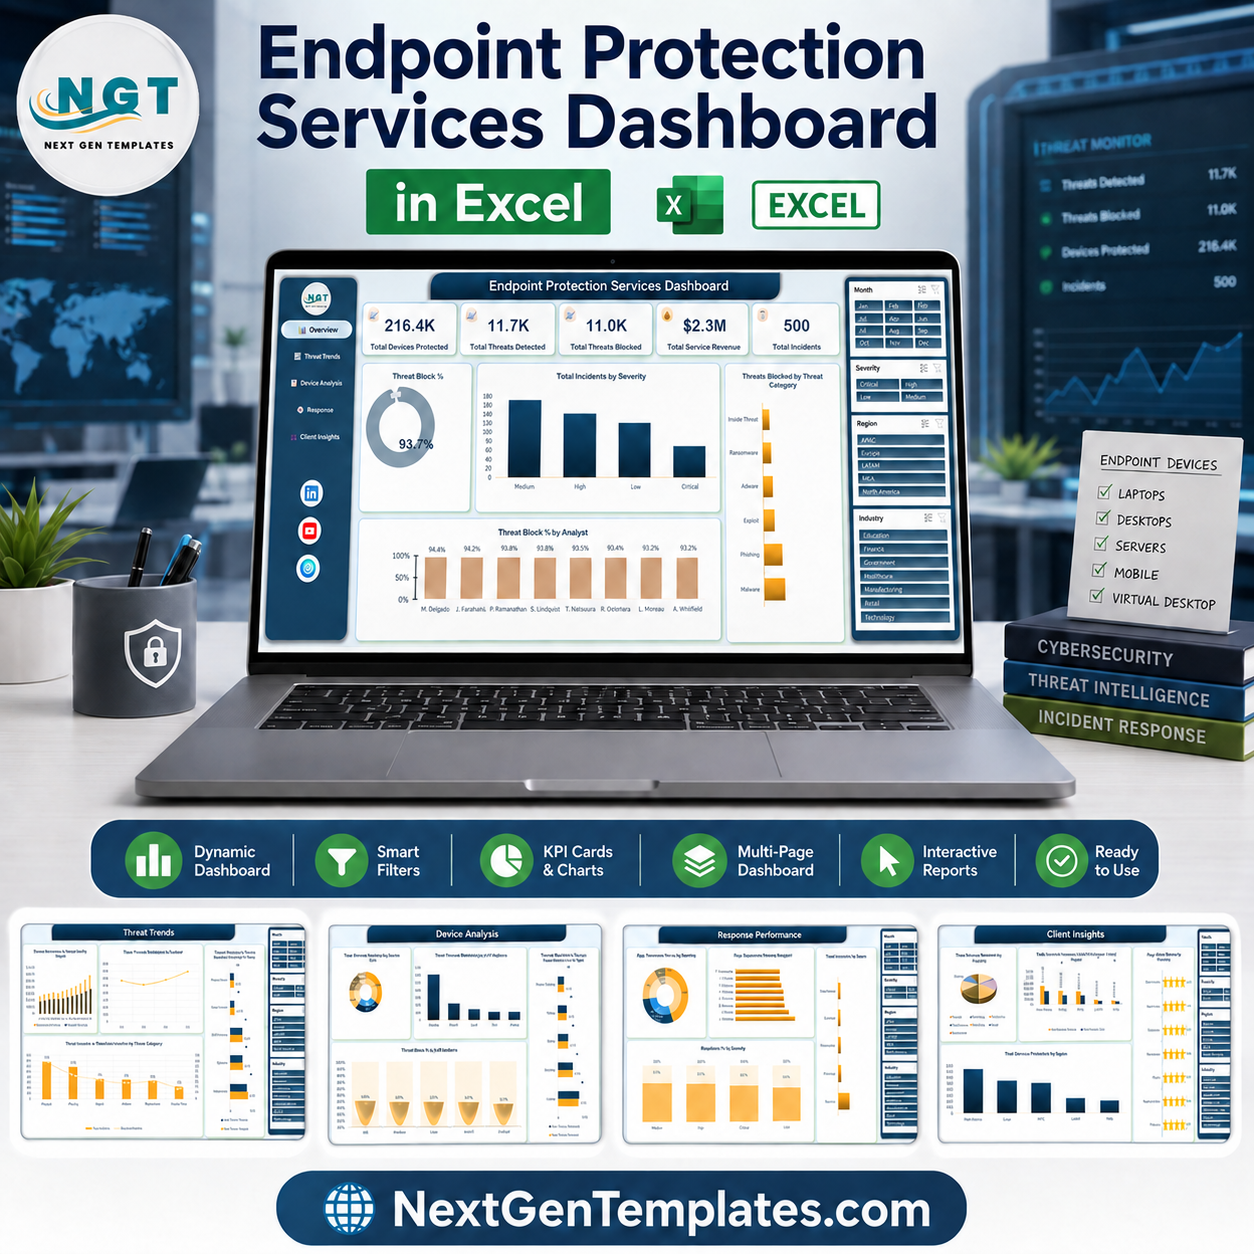
Endpoint Protection Services Dashboard in Excel turns service, device, threat, incident, response, client, revenue, and cost records into a focused five-page reporting experience. It is designed for managed security providers, IT service teams, analysts, and operations leaders who need a reusable way to review entered endpoint-security data without assembling charts from scratch.
The workbook includes 500 fictional sample records so you can explore the layout immediately. Replace the examples with your own consistently structured records, refresh the workbook, and use the slicers to investigate the reporting views. This is an analytics template—not endpoint protection software—and it does not detect, block, contain, or remediate threats.
Endpoint Protection Services Dashboard in Excel: what is included
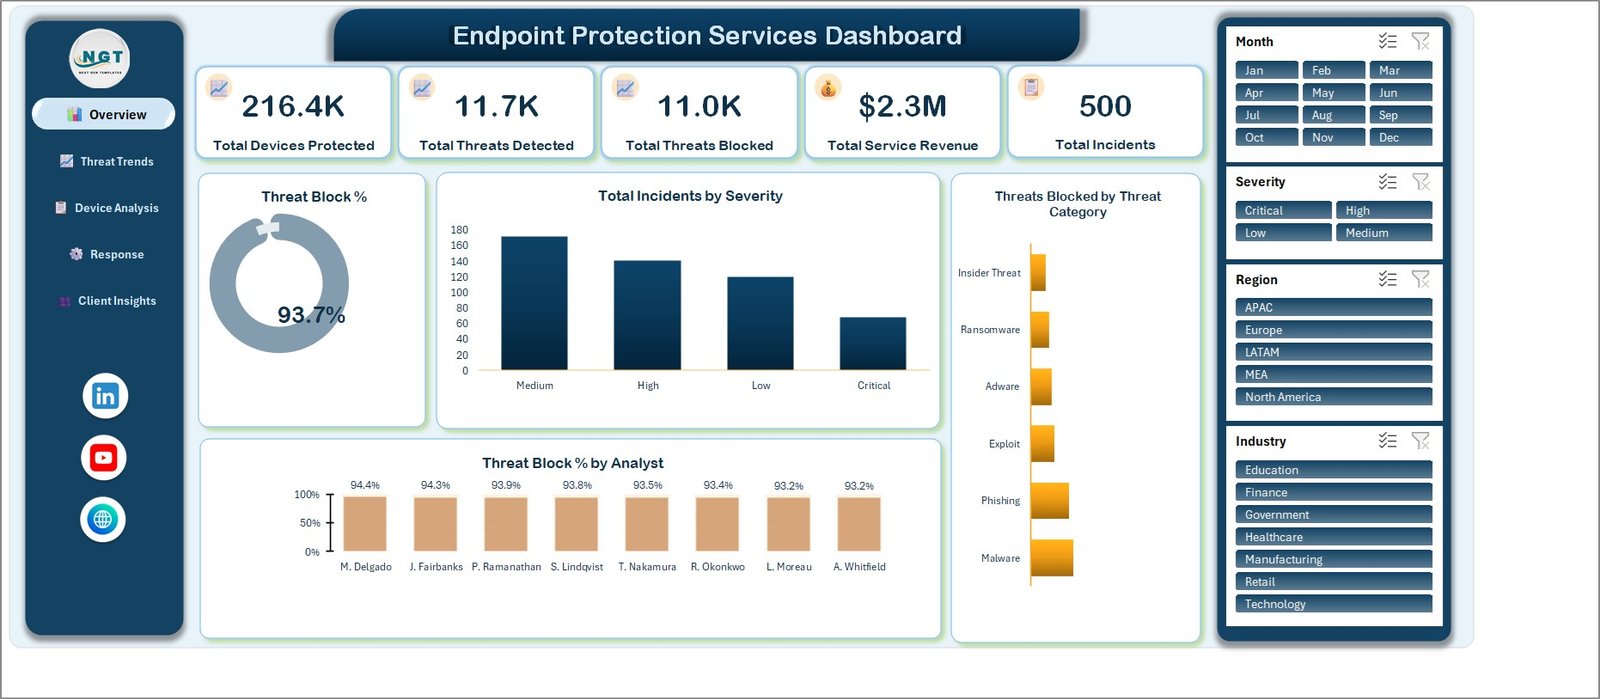
- Overview: headline measures for protected devices, threats detected, threats blocked, service revenue, incidents, and threat-block percentage.
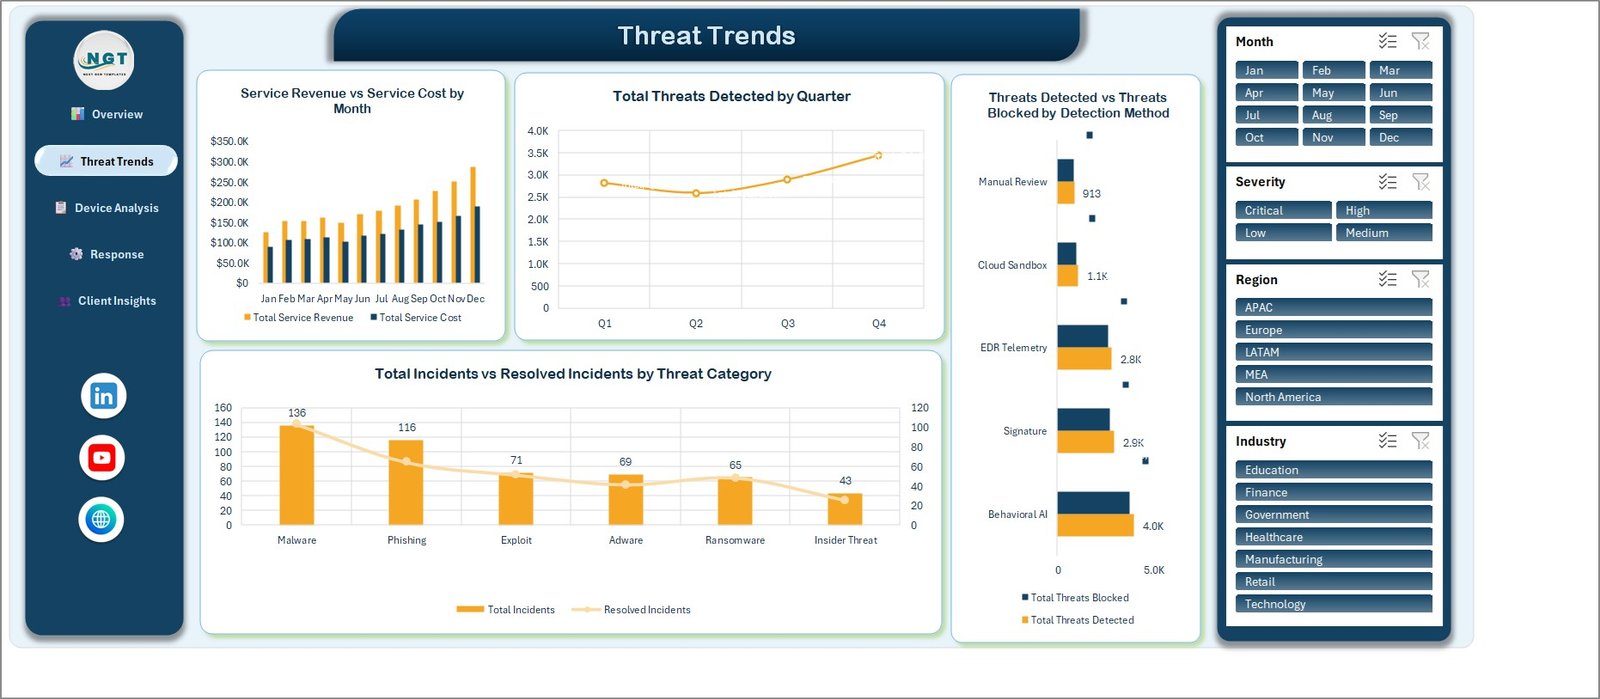
- Threat Trends: monthly revenue and service cost, quarterly threat volume, detection-method comparisons, and category-level incident resolution.
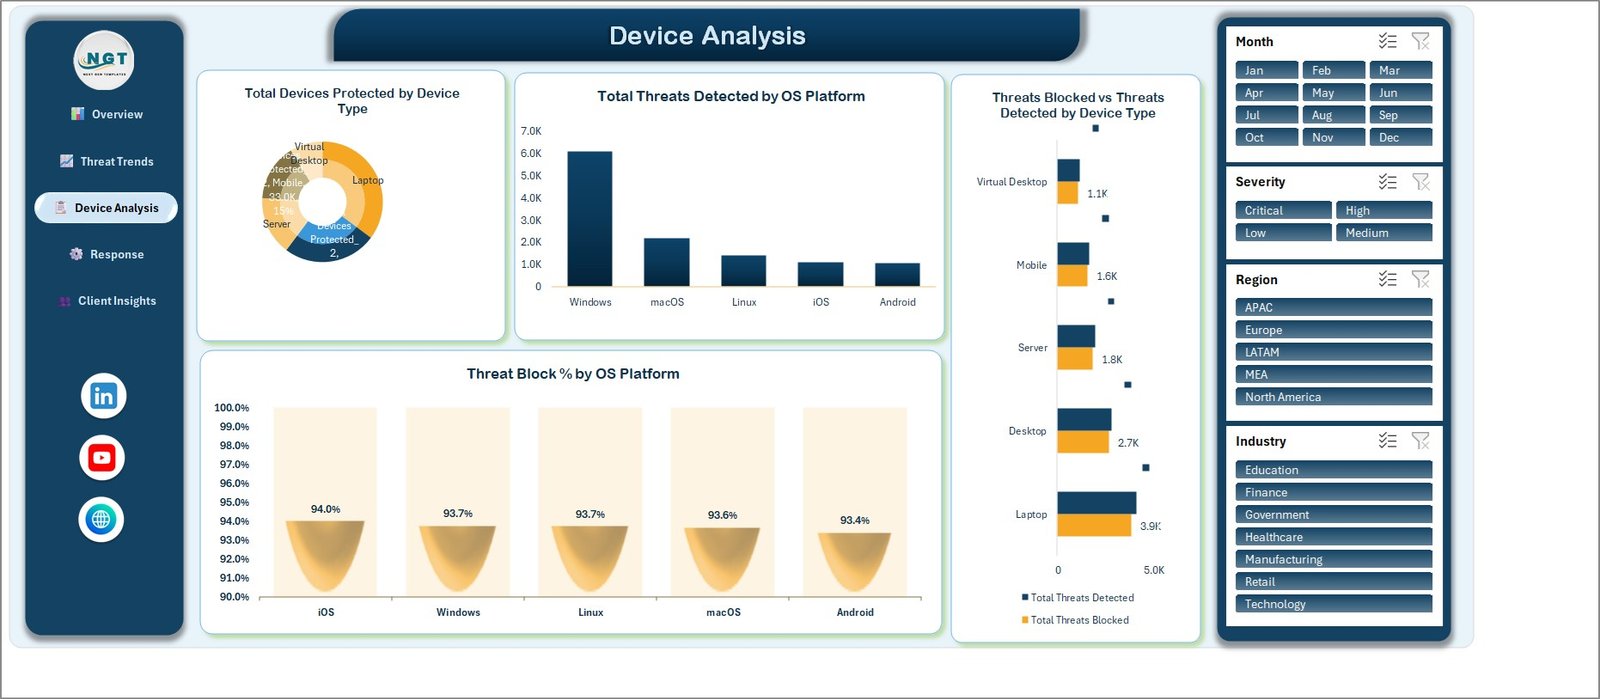
- Device Analysis: device mix, operating-system threat distribution, detected-versus-blocked comparisons, and block percentage by operating system.
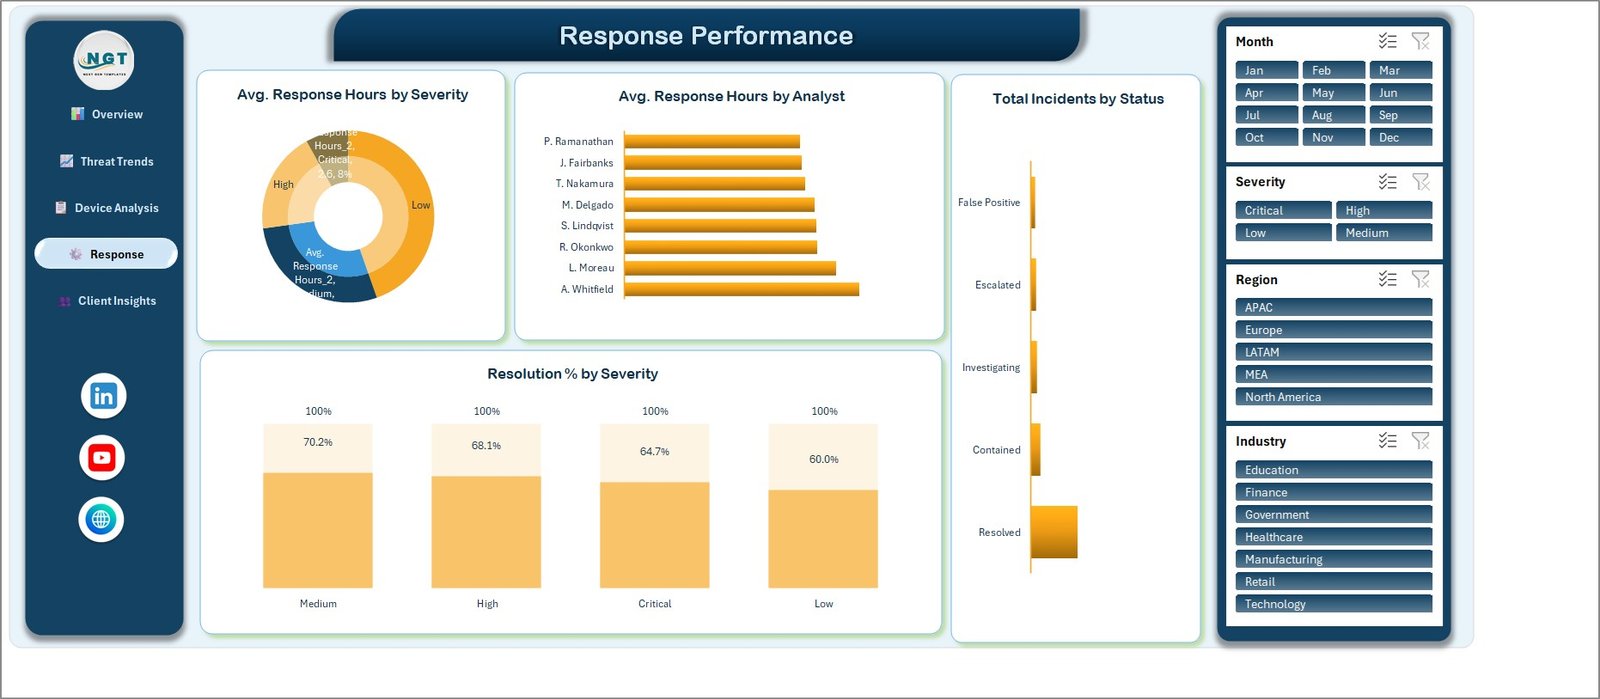
- Response Performance: average response time by severity and analyst, incident status, and resolution percentage by severity.
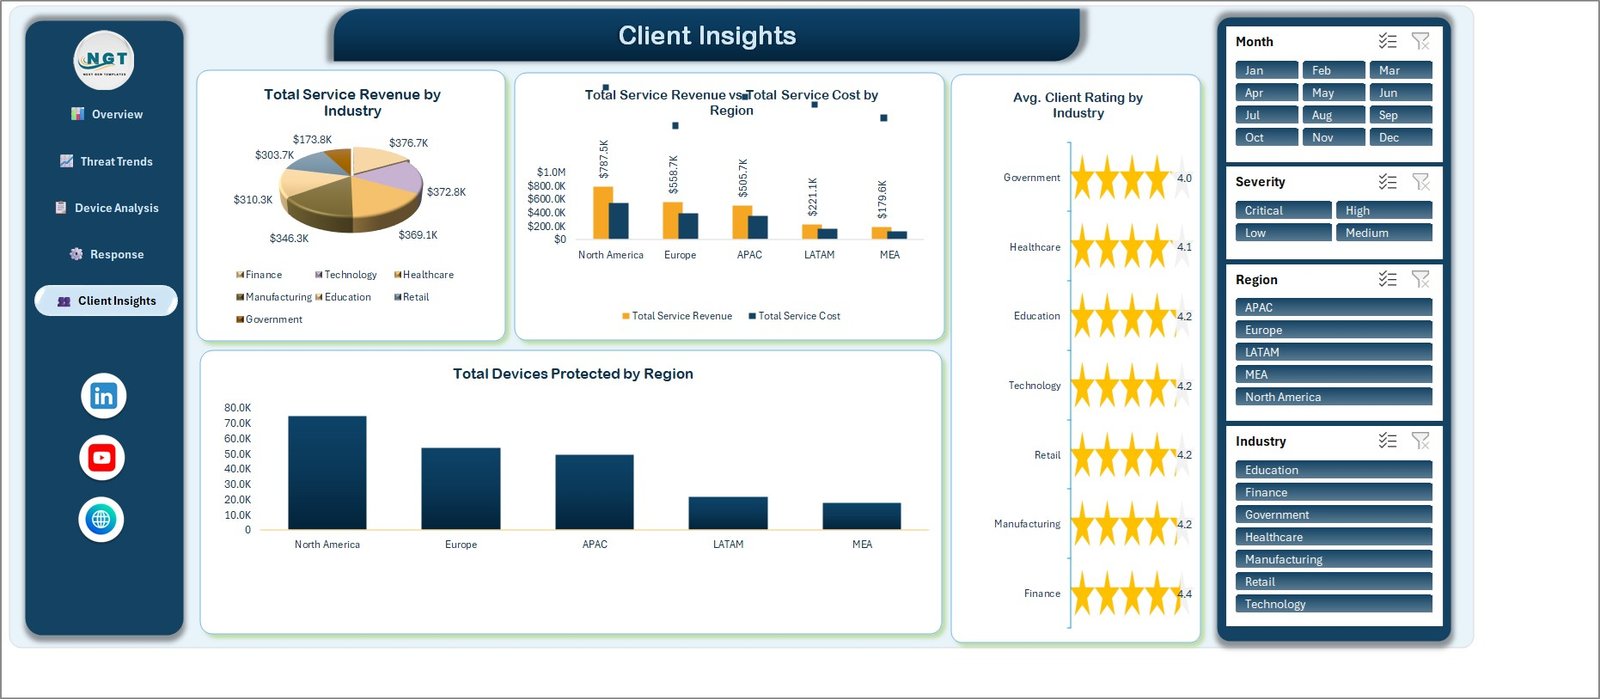
- Client Insights: revenue by industry, regional revenue and cost, client ratings by industry, and protected devices by region.
Review five connected dashboard pages
The Overview gives decision-makers a quick operational snapshot, while the supporting pages make the numbers easier to investigate. Move from headline service performance to threat activity, device coverage, response patterns, and client-level commercial context. Consistent styling across all pages helps teams present a coherent review rather than a collection of disconnected charts.
Filter the analysis without rebuilding reports
Use the included Month, Severity, Region, and Industry slicers to focus discussions on the segment that matters. For example, compare response performance for critical incidents, examine device coverage in a selected region, or review service revenue for one industry. The views report the data supplied to the workbook; they do not independently validate security events or calculate regulatory compliance.
Editable sample data structure
The source table demonstrates fields for devices, operating systems, threat categories, detection methods, severity, incident status, analysts, clients, industries, regions, response measures, ratings, revenue, and service cost. Example device types include desktops, laptops, mobile devices, servers, and virtual desktops. The fictional records are provided to demonstrate the dashboard and should be replaced before operational use.
Useful for recurring service reviews
This template can support internal IT reviews, managed-service reporting, analyst workload discussions, and client performance meetings. It is especially useful when the team already records operational facts but needs a polished layer for monitoring and presentation. The workbook helps organize reporting; it is not an EDR platform, antivirus product, ticketing system, security guarantee, or substitute for professional incident-response processes.
A practical review workflow
- Keep an untouched backup of the downloaded package.
- Review the fictional rows and confirm how your source fields map to the workbook.
- Standardize labels such as device type, severity, region, industry, and incident status.
- Replace the examples with approved records without changing the prepared structure.
- Refresh the workbook and reconcile dashboard totals with the source system.
- Choose the slicers required for the next management or client review.
This workflow is deliberately straightforward. The most important step is reconciliation: a polished chart cannot correct incomplete, duplicated, or incorrectly classified source records. Keep access to operational data appropriately restricted and share exported reports according to your organization’s information-security policies.
Questions the dashboard can support
During a recurring review, the prepared views can help teams ask where recorded threats are concentrated, whether response time varies by severity, which analysts or incident statuses warrant investigation, how device and operating-system segments compare, and where service revenue differs from service cost. The workbook organizes those questions visually; the underlying security team remains responsible for interpretation, investigation, and action.
Because the pages combine operational and commercial measures, different audiences can begin from the same source. Analysts may concentrate on categories and response time, service leaders may examine ratings and resolution patterns, and account managers may focus on regional or industry results. Filters make that shared review more focused without creating a separate workbook for every audience.
Related cybersecurity reporting templates
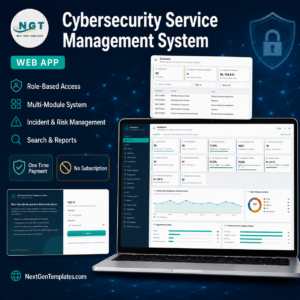
For a workflow-oriented solution, explore the Cybersecurity Service Management System Web App. You can also compare the Cybersecurity Startups Dashboard in Excel, the Cybersecurity Startups Dashboard in Power BI, and the Cyber Risk Management Dashboard in Power BI. Browse more options in the Excel Dashboard collection.
For broader security-program guidance, the NIST Cybersecurity Framework provides an authoritative reference for managing cybersecurity risk. Use this workbook as a reporting aid within controls and procedures appropriate to your organization.
What you receive
- One editable Microsoft Excel dashboard workbook
- Five formatted dashboard pages
- An editable source-data sheet with 500 fictional sample records
- A support sheet and Excel dashboard user manual
- Instant ZIP download after purchase
Build a clearer endpoint-services review. Download the Endpoint Protection Services Dashboard in Excel, replace the sample records with your own validated data, and give stakeholders a consistent view of service activity, device coverage, response performance, and client results.