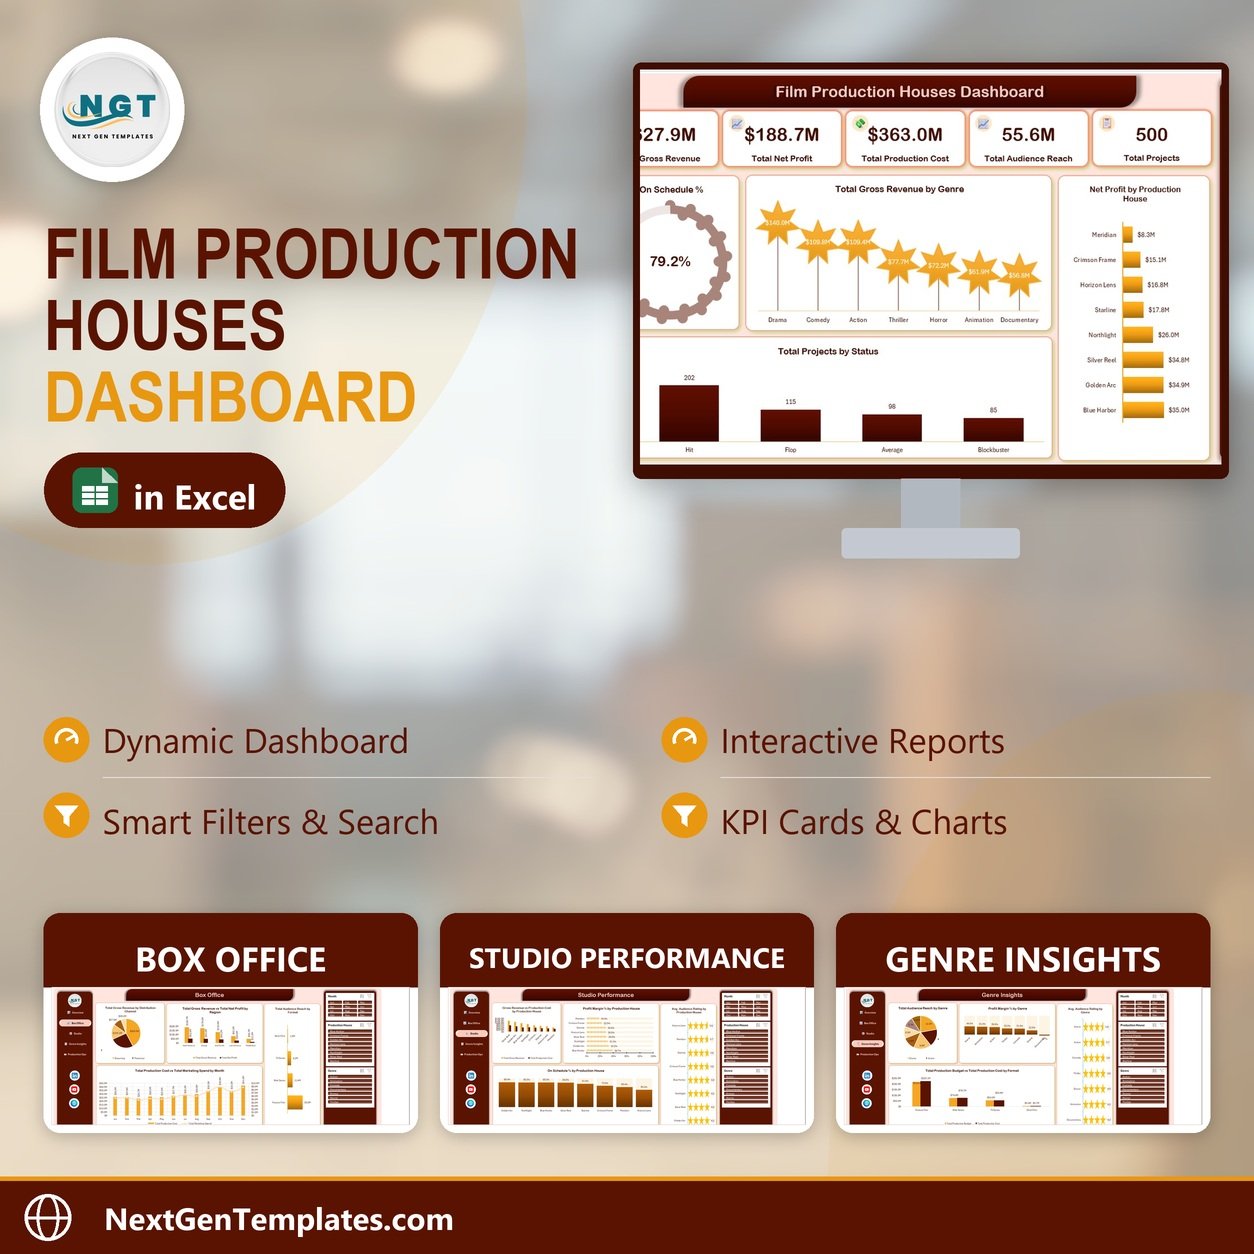
The Film Production Houses Dashboard in Excel turns 500 film and series projects into 5 interactive pages with 5 KPI cards, an on-schedule ring and 19 more charts. The sample file reports $627.9M gross revenue, $188.7M net profit, $363.0M production cost and 55.6M audience reach, and every page filters by Month, Production House and Genre with one click.
🌍 Built by the team behind PK: An Excel Expert and NextGenTemplates, who publish ready-to-use Excel, Google Sheets, Power BI and web app templates for small businesses and analysts worldwide.
✅ Instant download · One-time payment · No subscription · No per-user fees · Lifetime access
🔑 Key Features of the Film Production Houses Dashboard
🎬 Five connected analysis pages. Overview, Box Office, Studio Performance, Genre Insights and Production Ops each answer a different question about your slate, from which genre earns the most to which production house finishes shoots on time. A left-hand navigation menu jumps between them.
🎛️ Three slicers that filter the whole workbook. Month, Production House and Genre slicers sit on every page. All 15 slicer buttons share three slicer caches linked to all 25 PivotTables, so picking “Drama” on the Overview also filters Box Office, Studio Performance, Genre Insights and Production Ops.
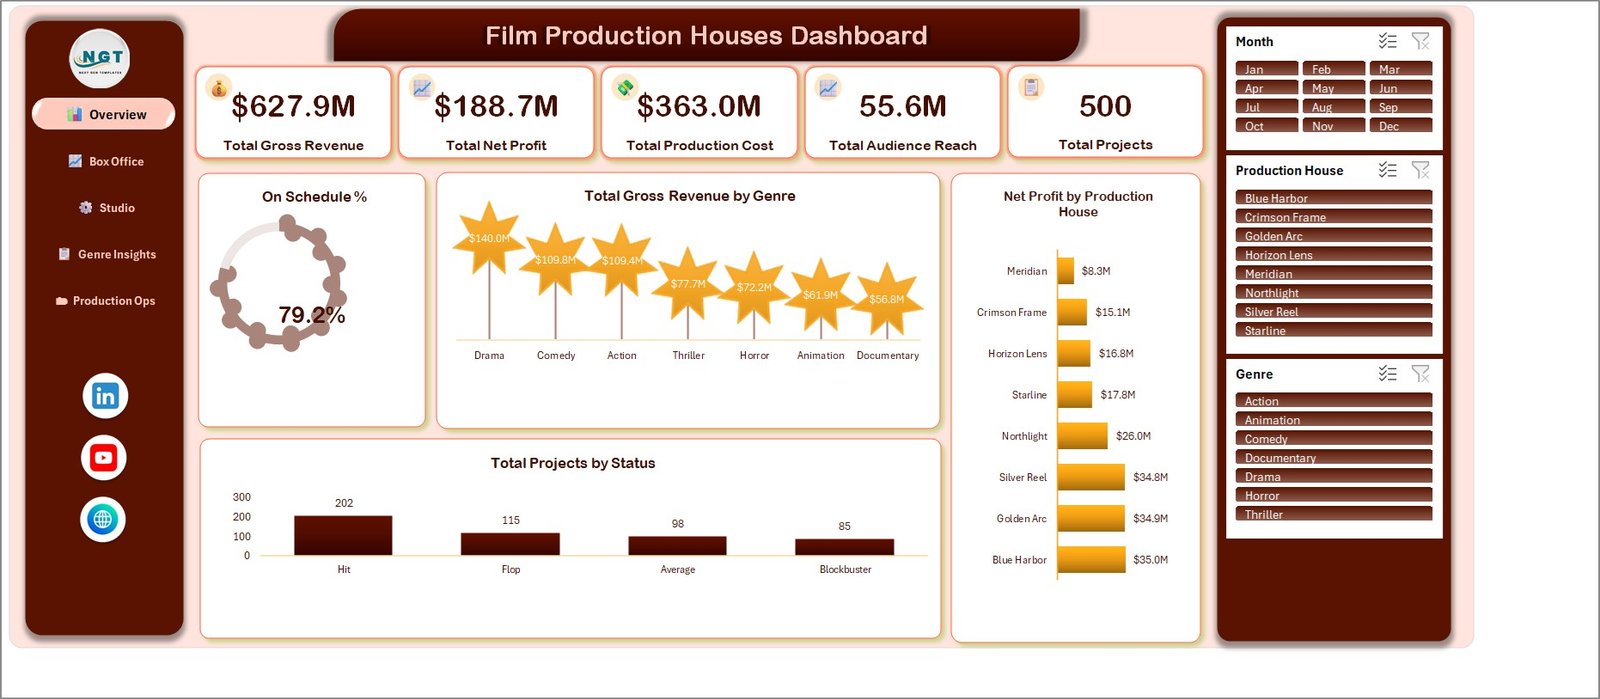
📊 Five headline KPI cards. Total Gross Revenue, Total Net Profit, Total Production Cost, Total Audience Reach and Total Projects sit at the top of the Overview, next to an On Schedule % ring that reads 79.2% in the sample data (396 of 500 projects).
⏱️ Clear on-schedule logic. A project counts as on schedule when its Actual Shoot Days are less than or equal to its Planned Shoot Days. The same flag drives On Schedule % by Production House and On Schedule % by Format, so schedule slippage is easy to trace.
💰 Profitability and cost control in one file. Profit Margin % by Production House and by Genre, Gross Revenue vs Production Cost, Production Budget vs Production Cost and Production Cost vs Marketing Spend show where money is made and where budgets overrun.
🗂️ A structured 28-column data table. The Data sheet holds an Excel table named TblData with 20 project fields (release date, production house, genre, format, channel, region, budget, cost, marketing spend, revenue, profit, reach, rating, critic score, shoot days, crew size and status) plus 8 helper columns.
📦 What’s Inside the Film Production Houses Dashboard in Excel
The workbook has seven sheets: five dashboard pages, a Data sheet and a Support sheet. The sample data covers 500 projects released between 1 January and 31 December 2025 across 8 production houses, 7 genres, 4 formats, 5 distribution channels, 5 regions and 4 outcome statuses.
Page 1: Overview
This page shows the five KPI cards and the On Schedule % ring, with charts for Total Gross Revenue by Genre (Drama leads at $140.0M, Documentary trails at $56.8M), Net Profit by Production House (Blue Harbor $35.0M down to Meridian $8.3M) and Total Projects by Status (202 Hit, 115 Flop, 98 Average, 85 Blockbuster).
Page 2: Box Office
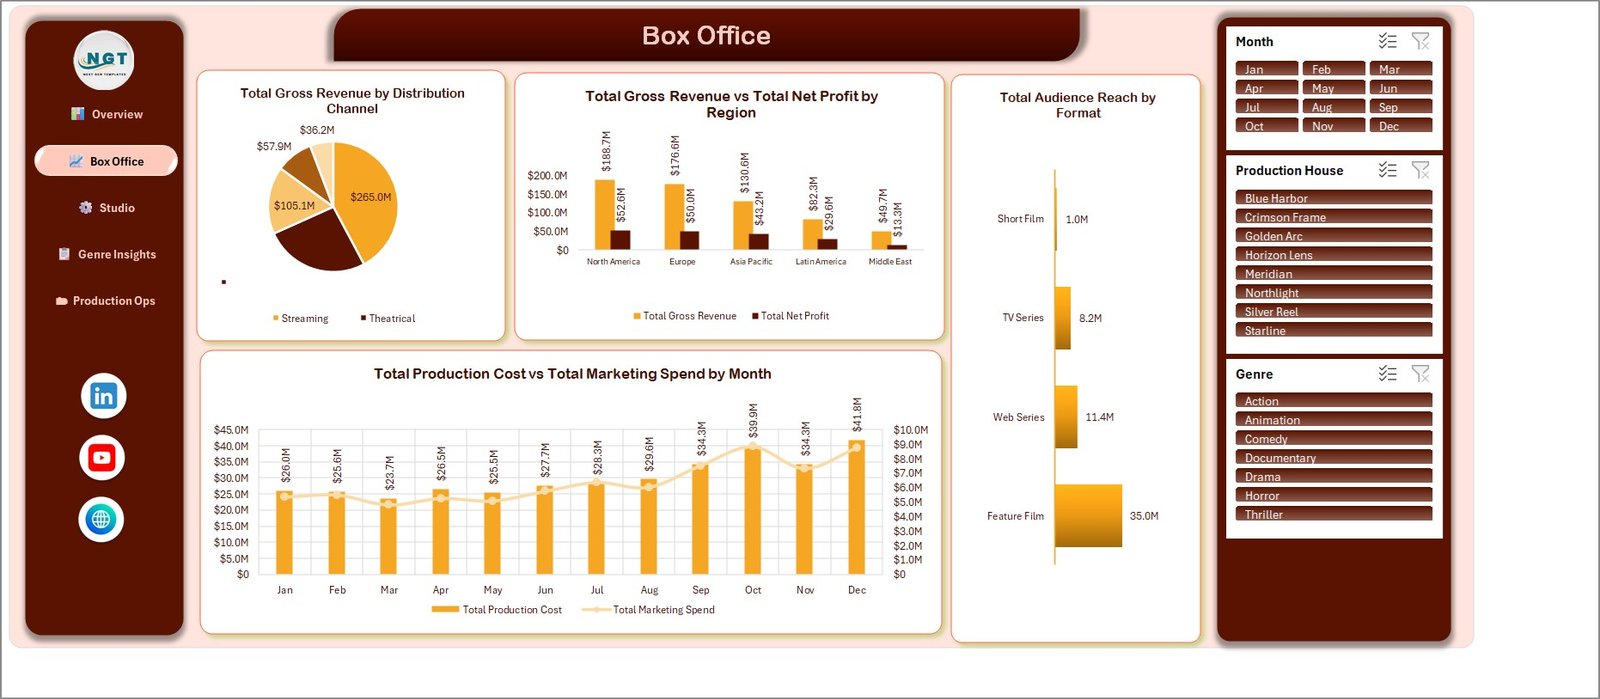
This page covers Total Gross Revenue by Distribution Channel (Streaming is the largest slice at $265.0M), Total Gross Revenue vs Total Net Profit by Region (North America $188.7M revenue and $52.6M profit), Total Audience Reach by Format (Feature Film 35.0M) and Total Production Cost vs Total Marketing Spend by Month.
Page 3: Studio Performance
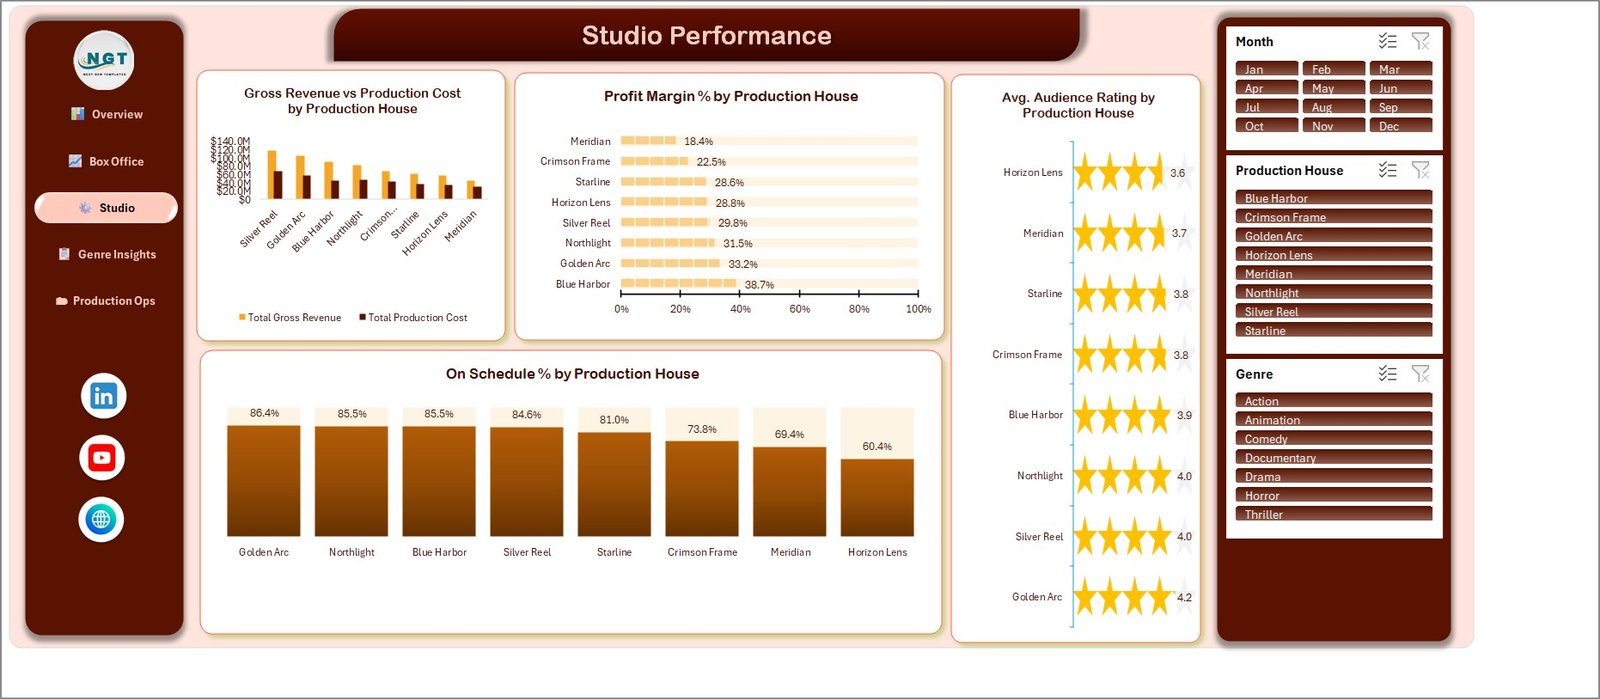
This page compares the eight production houses with Gross Revenue vs Production Cost by Production House, Profit Margin % by Production House (Blue Harbor 38.7% to Meridian 18.4%), Avg. Audience Rating by Production House (Golden Arc tops at 4.2) and On Schedule % by Production House (Golden Arc 86.4% to Horizon Lens 60.4%).
Page 4: Genre Insights
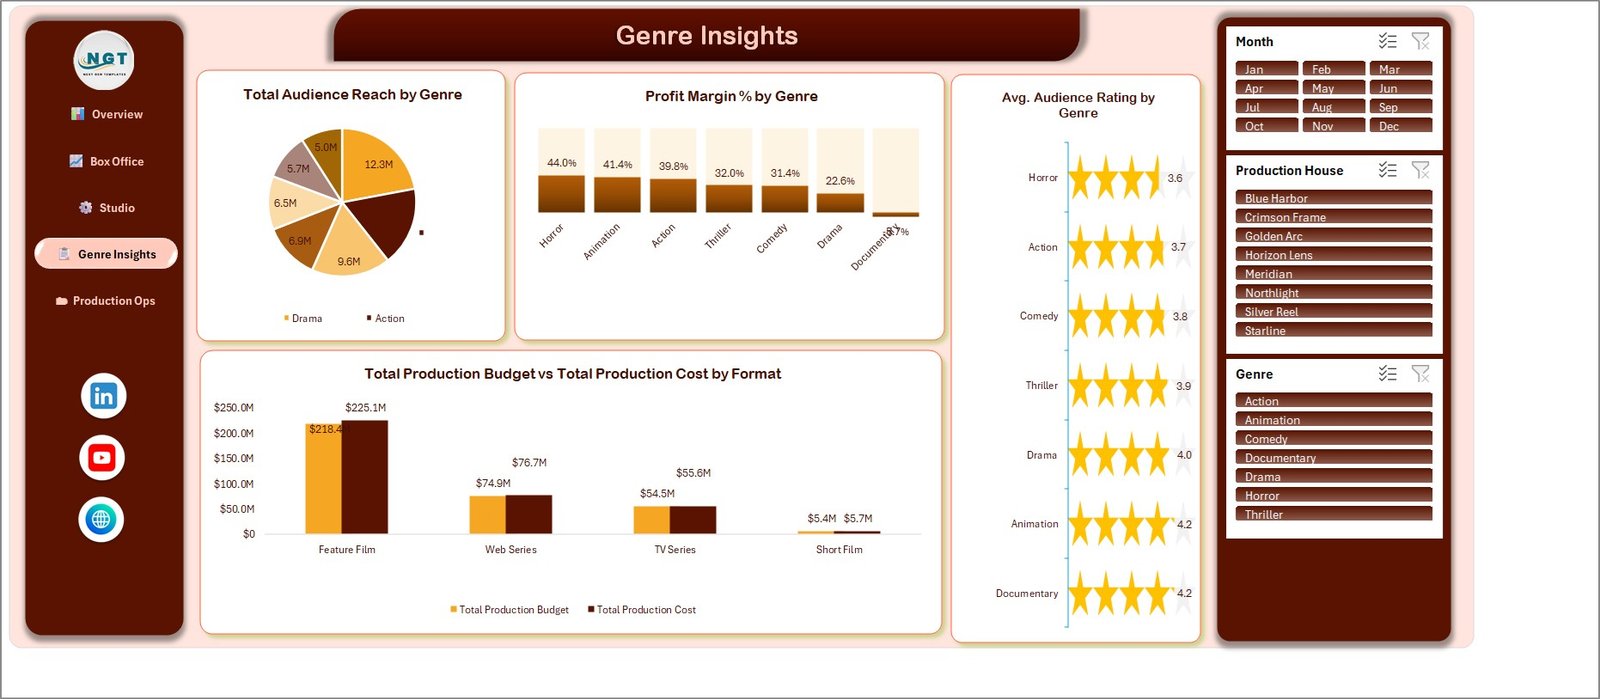
This page shows Total Audience Reach by Genre, Profit Margin % by Genre (Horror 44.0%, Animation 41.4%, Drama 22.6%), Avg. Audience Rating by Genre (Animation and Documentary at 4.2) and Total Production Budget vs Total Production Cost by Format, where Feature Films cost $225.1M against a $218.4M budget.
Page 5: Production Ops
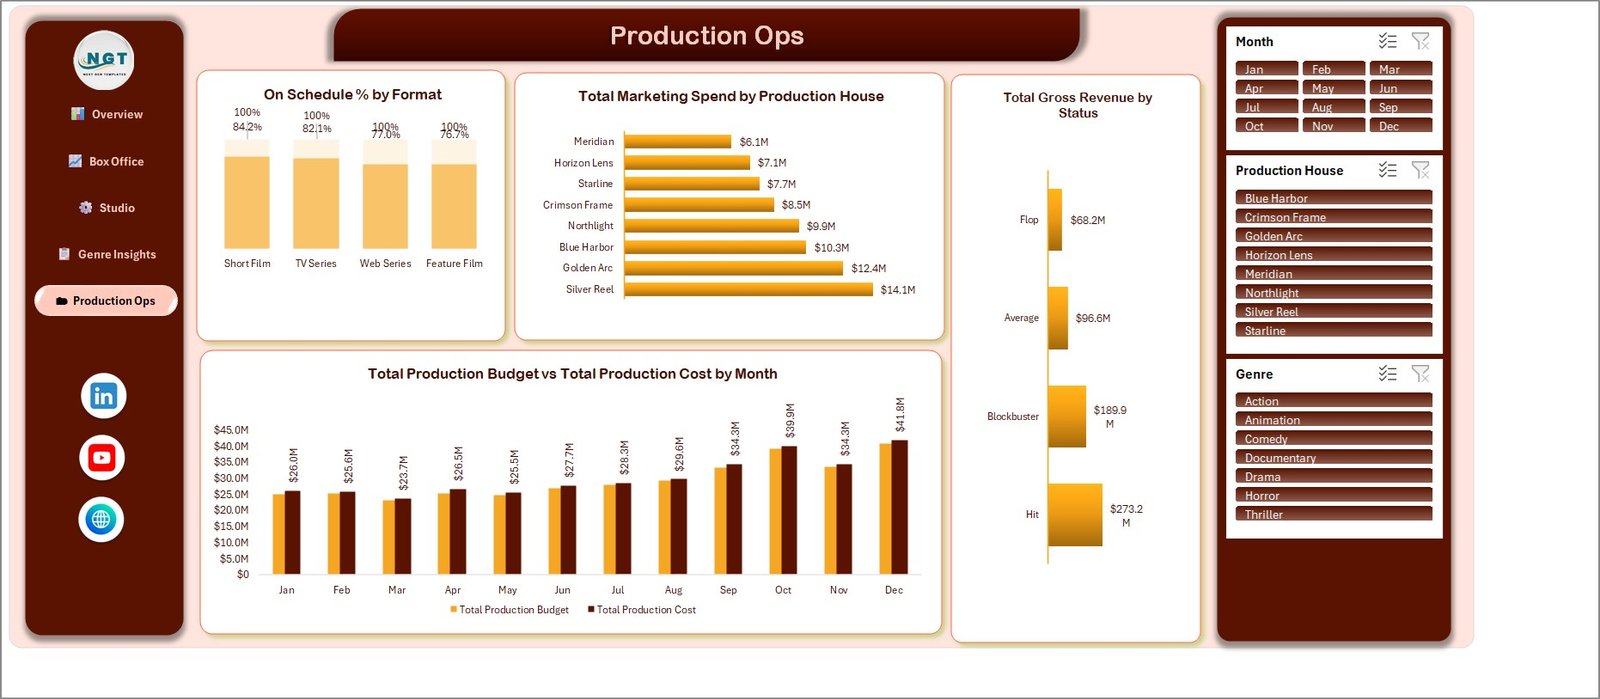
This page tracks On Schedule % by Format (Short Film 84.2%, TV Series 82.1%, Web Series 77.0%, Feature Film 76.7%), Total Marketing Spend by Production House (Silver Reel highest at $14.1M), Total Gross Revenue by Status (Hit $273.2M, Blockbuster $189.9M) and Total Production Budget vs Total Production Cost by Month.
Data Sheet
The Data sheet stores every project as one row of the TblData table, starting at row 4. Month and Year are calculated from the Release Date, and helper columns count records, on-schedule projects and each status (Blockbuster, Hit, Average, Flop) for the PivotTables.
Support Sheet
The Support sheet holds the 25 PivotTables that feed the charts, grouped by page. You never need to edit it; a Refresh All after changing the data updates it.
📊 Film Production Houses Dashboard vs. Google Sheets Equivalent vs. Paid Production Analytics Software
| Feature | This Excel Dashboard | Google Sheets equivalent | Paid production analytics SaaS |
|---|---|---|---|
| Cost | ✅ $17.99 one-time (regular $29.99) | Free tool, but you build every chart and filter yourself | Monthly or annual subscription |
| Platform | Desktop Microsoft Excel | Browser | Browser, vendor-hosted |
| Setup time | ✅ Under 10 minutes: paste data, Refresh All | Hours to days of building | Onboarding plus data import |
| Real-time team collaboration | Share the file or co-author through OneDrive | ✅ Built in | ✅ Built in |
| Mobile access | View on Excel mobile; full slicer use on desktop | ✅ Browser and app | ✅ Usually |
| Customizable fields | ✅ Full control over the table, charts and PivotTables | ✅ Full control | Limited to the vendor’s schema |
| Share with link | Through OneDrive or SharePoint | ✅ Yes | ✅ Yes |
| Year-1 cost at 5 users | ✅ One purchase, no per-user fee | Free plus build time | Per-seat pricing multiplies |
| Box office, genre and studio analysis ready on day one | ✅ 5 pages, 20 charts, 3 slicers | Not included | Varies by product |
| Data stays on your own computer | ✅ Yes | Stored in Google Drive | Stored with the vendor |
For production houses that want slate-level revenue, profit and schedule reporting without a subscription, this workbook sits in the sweet spot.
👥 Who This Template Is For, and Who It’s Not For
✅ This template is built for:
- Independent production houses and studios reporting on a slate of films, web series, TV series and short films
- Producers and finance leads who need a monthly view of revenue, net profit, production cost and marketing spend
- Line producers and production managers tracking on-schedule delivery by studio and format
- Media analysts and students who want a worked Excel PivotTable and slicer dashboard for the film industry
❌ This template is NOT for:
- Teams needing scheduling, call sheets, script breakdowns or line-item budgeting (this is a reporting dashboard, not production management software)
- Film accounting or royalty calculation; it summarises the figures you enter and does not replace accounting software
- Anyone who works only in Excel for the web or Google Sheets, since slicers and PivotTable refresh are designed for desktop Excel
⚙️ How to Use the Film Production Houses Dashboard
- Unzip the download and open the workbook in desktop Microsoft Excel (Microsoft 365 or Excel 2016 and later). The user manual PDF is in the same ZIP.
- Explore the Overview with the sample data, then click Box Office, Studio, Genre Insights and Production Ops in the left menu.
- Go to the Data sheet and paste your projects into the TblData table from row 4, keeping the column headers and order unchanged.
- Make sure the Month, Year and helper count columns carry their formulas down to your last row.
- Press Ctrl+Alt+F5 (Data > Refresh All). All 25 PivotTables and every chart update.
- Filter any page with the Month, Production House and Genre slicers; use the clear-filter icon to reset.
💼 Real-World Use Cases
Anita runs finance for a mid-sized production house with three labels. She pastes the quarter’s releases into the Data sheet, refreshes, and uses the Studio Performance page to show her board which label earns the highest profit margin and which one keeps missing its shoot schedule.
Marco is a line producer for a streaming-first studio. He filters Production Ops by Format to compare on-schedule rates for web series and feature films, then checks Production Budget vs Production Cost by Month to spot the months where overruns started.
Leila is a media analyst preparing a genre strategy memo. She uses Genre Insights to set profit margin and audience rating by genre side by side, and Box Office to see how much revenue comes from streaming compared with theatrical releases.
❓ Frequently Asked Questions
What does this film production dashboard track?
It tracks gross revenue, net profit, production cost, production budget, marketing spend, audience reach, audience rating, profit margin, on-schedule rate and project counts by status. Every figure can be split by production house, genre, format, distribution channel, region and month across five interactive pages.
Which version of Excel do I need?
Use desktop Microsoft Excel: Microsoft 365 or Excel 2016 and later. The dashboard is built on PivotTables, PivotCharts and slicers, which work fully in desktop Excel. Excel for the web and mobile apps can open the file, but refreshing and slicer filtering are best done on desktop.
How do I add my own projects?
Paste your projects into the TblData table on the Data sheet, keep the column order, make sure the helper formulas extend to your last row, then press Ctrl+Alt+F5 to refresh. Charts do not refresh on their own, so refresh after every data change.
Is this the same as the Film Production Houses KPI Dashboard in Excel?
No. The Film Production Houses KPI Dashboard in Excel is a separate month-picker KPI scorecard with targets and traffic lights. This product is an analytical dashboard built on 500 project records with slicers, charts and PivotTables. Many studios use both.
Can it analyse more than one year?
The sample covers 2025. The Month slicer uses month names only, so if you load several years the same months merge together. For multi-year data, add a Year slicer from the existing Year column or keep one workbook per year.
How does it compare with paid production analytics software?
Paid tools add live integrations, multi-user access and production workflows, billed per seat. This workbook costs one payment, keeps data on your own computer and gives you full control of every chart, but you update the data yourself and it has no scheduling or accounting features.
👤 About the Author
Built by PK, Microsoft Certified Professional with 15+ years of Excel, Google Sheets and Power BI experience and founder of NextGenTemplates, reaching 300K+ subscribers across YouTube channels (@PKAnExcelExpert, @NextGenTemplates, @NeoTechNavigators). Every template is hand-built and tested before release.
🔗 Explore Related Templates
🎥 Film Production Houses KPI Dashboard in Excel – a monthly KPI scorecard for the same industry, with targets and status lights.
📺 Documentary Channels Dashboard in Excel – viewership, content and revenue analysis for documentary broadcasters.
📜 Content Rights Agencies Dashboard in Excel – licensing deals and rights revenue for media rights businesses.
🎞️ Independent Filmmaking Dashboard in Power BI and Film and Television Dashboard in Google Sheets – film analytics on other platforms.
📂 Browse the full range of Excel Dashboard Templates. New to slicers? Microsoft’s guide on how to use slicers to filter data explains the basics.
📖 Click here to read the Detailed Blog Post
🎥 Visit our YouTube channel for step-by-step video tutorials
👉 YouTube.com/@NextGenTemplates
📅 Last updated: September 2026
Watch the demo video: