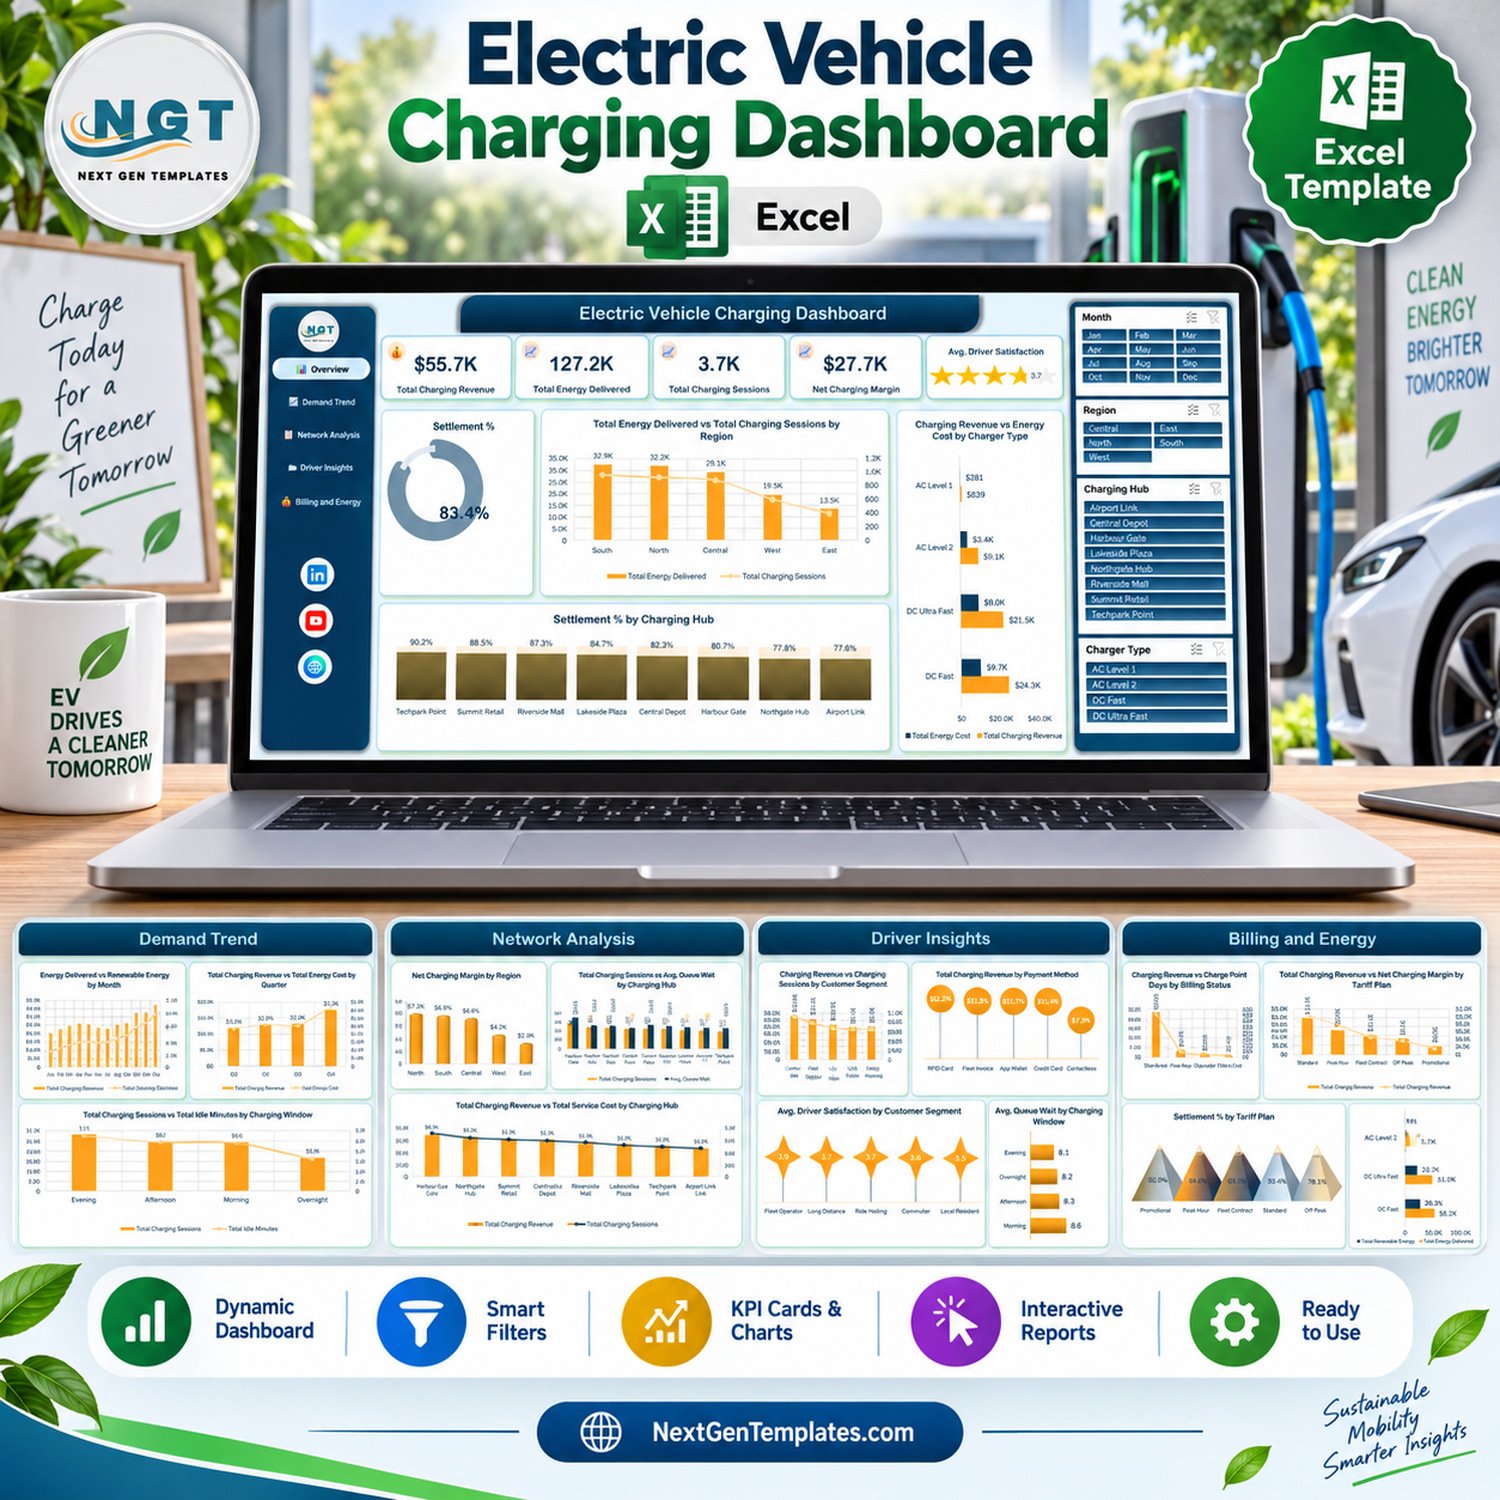
The Electric Vehicle Charging Dashboard in Excel is a five-page reporting workbook that turns one flat table of charging-session records into an interactive management report. The sample build covers 8 charging hubs, 5 regions, 4 charger types, 5 tariff plans and 12 months, and its demo figures read $55.7K total charging revenue, 127.2K total energy delivered, 3.7K charging sessions and $27.7K net charging margin. Four slicers – Month, Region, Charging Hub and Charger Type – refilter every page at once. It is a reporting template, not charging software: it does not connect to any charger, OCPP network, CPMS, billing system or utility meter, and every number you see is buyer-entered demo data you replace with your own. Instant download, lifetime access, and a user manual PDF is included in the ZIP.
Key Features of the Electric Vehicle Charging Dashboard in Excel
- Five linked report pages – Overview, Demand Trend, Network Analysis, Driver Insights and Billing and Energy, reached from a fixed left-hand navigation rail.
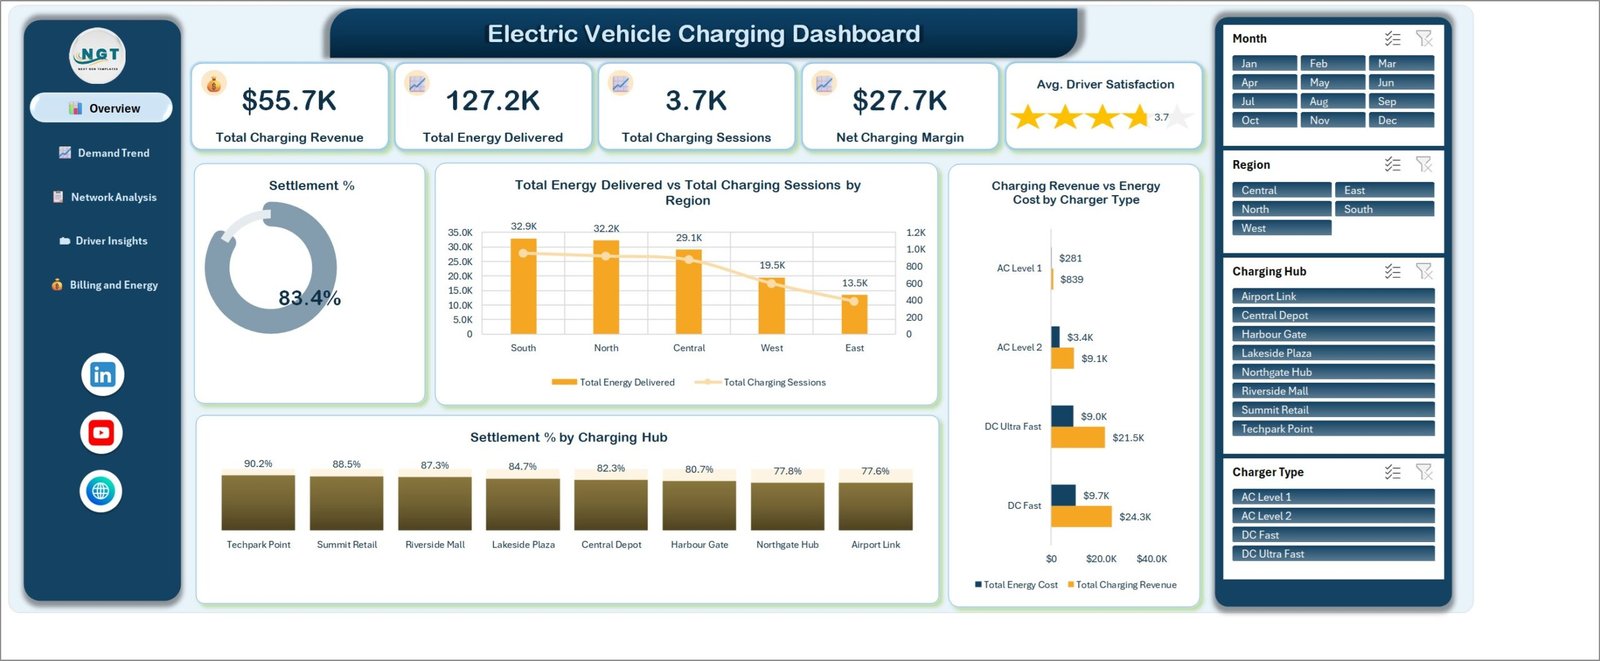
- Five headline KPI cards on the Overview – Total Charging Revenue, Total Energy Delivered, Total Charging Sessions, Net Charging Margin and a star-rated Avg. Driver Satisfaction tile.
- Four slicers that drive all five pages – Month (Jan to Dec), Region, Charging Hub and Charger Type. Click one and every chart on every page recalculates.
- Twenty charts across the workbook, each named for what it measures rather than for its chart type, so a reader knows what they are looking at before reading the axis.
- Settlement tracking – a Settlement % donut on the Overview, Settlement % by Charging Hub, and Settlement % by Tariff Plan on the billing page.
- Cost against revenue on every axis that matters – by charger type, by charging hub, by quarter and by tariff plan, so margin is visible rather than inferred.
- Driver-side reporting – revenue and satisfaction split by customer segment, payment method and charging window.
- Native Excel only – formulas, PivotTables, slicers and standard chart objects. No macros to enable, no add-in to install, no Power BI licence, no internet connection required.
What’s Inside the Electric Vehicle Charging Dashboard
Page 1 – Overview
The landing page carries the five KPI tiles and four visuals: a Settlement % donut reading 83.4% in the demo data, Total Energy Delivered vs Total Charging Sessions by Region (South 32.9K, North 32.2K, Central 29.1K, West 19.5K, East 13.5K), Charging Revenue vs Energy Cost by Charger Type, and Settlement % by Charging Hub ranking all eight sites from Techpark Point at 90.2% down to Airport Link at 77.6%.
Page 2 – Demand Trend
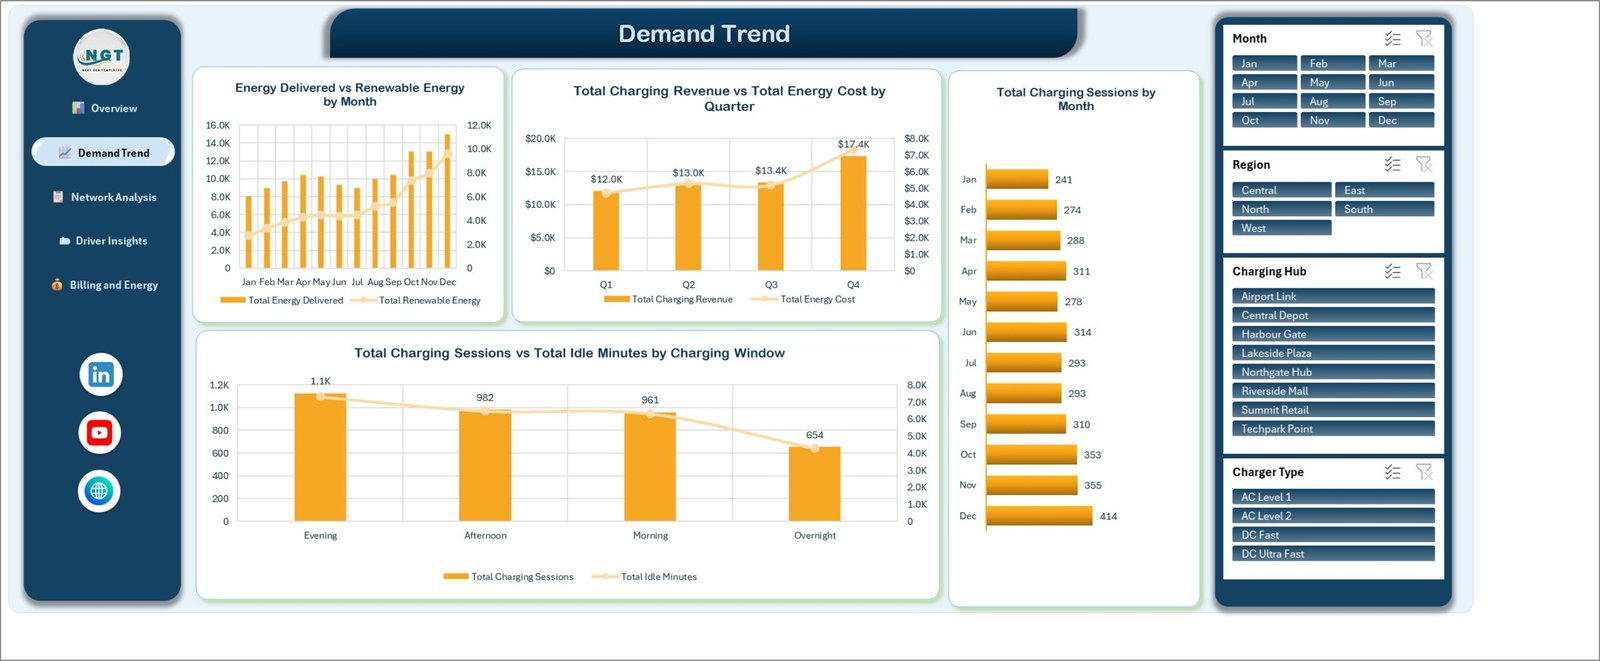
Four time-based visuals: Energy Delivered vs Renewable Energy by Month, Total Charging Revenue vs Total Energy Cost by Quarter (Q1 $12.0K, Q2 $13.0K, Q3 $13.4K, Q4 $17.4K), Total Charging Sessions by Month as a horizontal bar running Jan 241 to Dec 414, and Total Charging Sessions vs Total Idle Minutes by Charging Window across Evening, Afternoon, Morning and Overnight.
Page 3 – Network Analysis
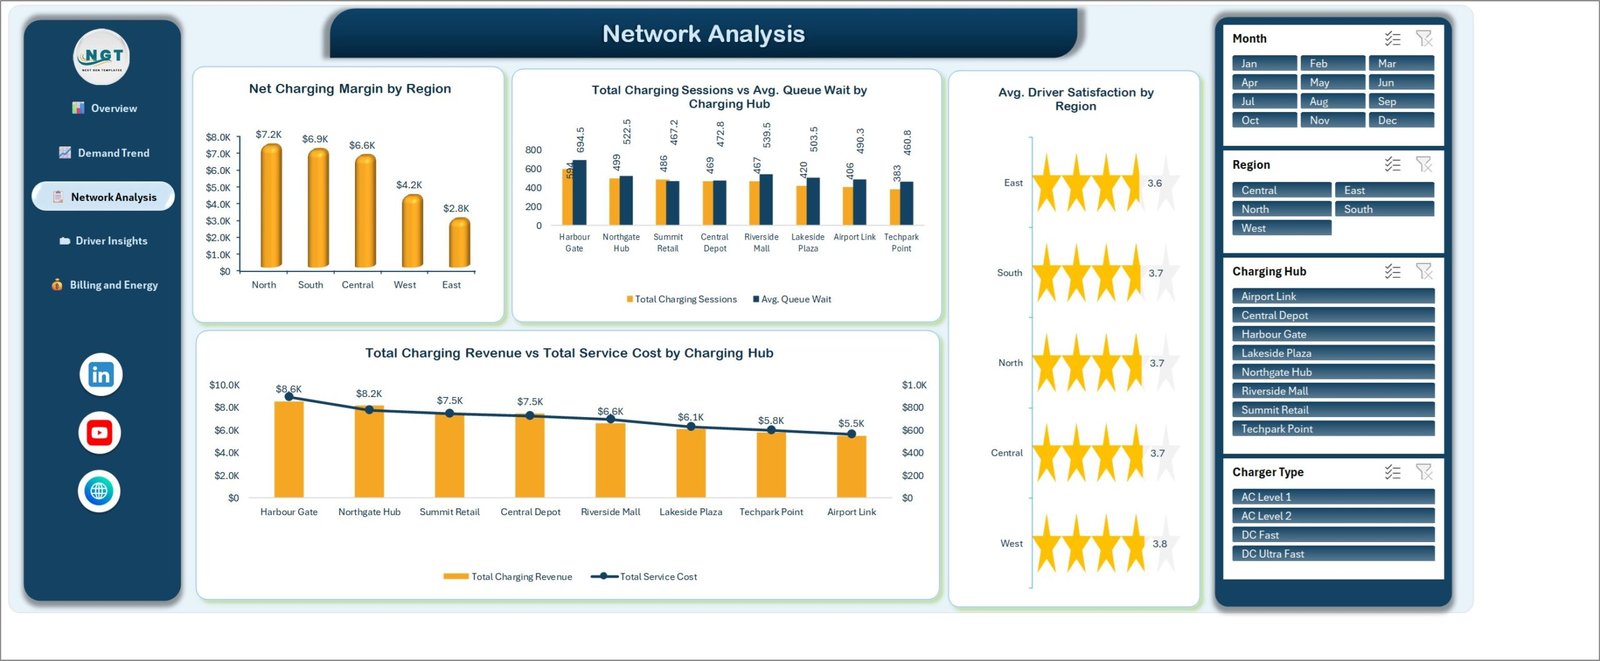
Site-level performance: Net Charging Margin by Region (North $7.2K down to East $2.8K), Total Charging Sessions vs Avg. Queue Wait by Charging Hub, Avg. Driver Satisfaction by Region shown as star rows from 3.6 to 3.8, and Total Charging Revenue vs Total Service Cost by Charging Hub ranking Harbour Gate at $8.6K down to Airport Link at $5.5K.
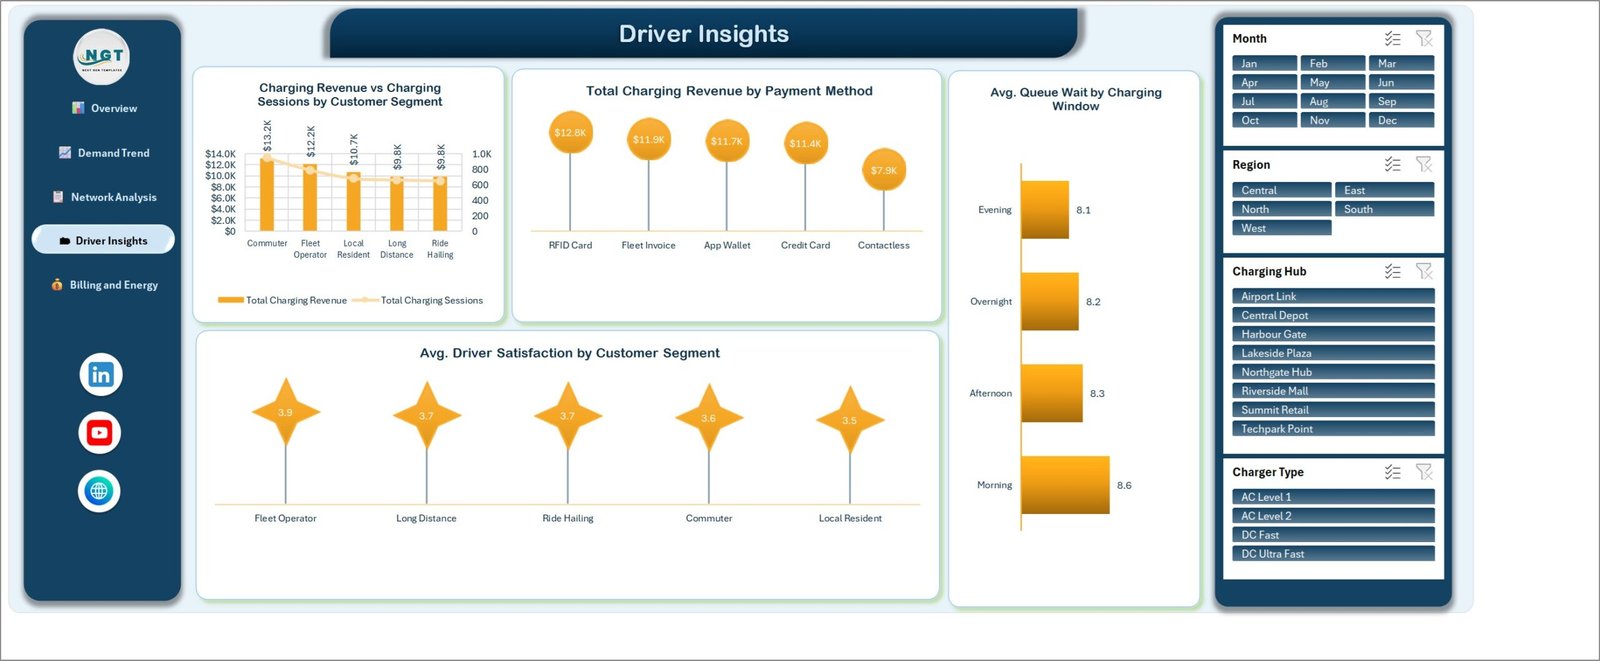
Page 4 – Driver Insights
Who is charging and how they pay: Charging Revenue vs Charging Sessions by Customer Segment across Commuter, Fleet Operator, Local Resident, Long Distance and Ride Hailing; Total Charging Revenue by Payment Method (RFID Card $12.8K, Fleet Invoice $11.9K, App Wallet $11.7K, Credit Card $11.4K, Contactless $7.9K); Avg. Queue Wait by Charging Window; and Avg. Driver Satisfaction by Customer Segment.
Page 5 – Billing and Energy
The commercial close: Charging Revenue vs Charge Point Days by Billing Status (Settled $46.5K, Pending $6.0K, Disputed $2.0K, Written Off $1.3K), Total Charging Revenue vs Net Charging Margin by Tariff Plan, Settlement % by Tariff Plan, and Energy Delivered vs Renewable Energy by Charger Type.

In the download
A single ZIP containing the .xlsx workbook and a user manual PDF. The workbook holds the five report pages plus the data sheet the whole model reads from.
Excel vs. Google Sheets vs. a Paid CPMS or Charging SaaS – Where This Fits
| This Excel template | Google Sheets equivalent | Paid CPMS / charging SaaS | |
|---|---|---|---|
| Cost | One-time purchase | One-time purchase | Per-charger monthly fee, typically an annual contract |
| Platform | Microsoft Excel, desktop | Browser, Google account | Vendor cloud platform |
| Setup time | Paste your data, refresh – minutes | Copy the file, paste, refresh | Weeks: hardware onboarding, OCPP integration, tariff configuration |
| Real-time team collaboration | Via OneDrive or SharePoint co-authoring | Yes, natively | Yes |
| Mobile access | Excel mobile app, read-focused | Yes, browser | Yes, dedicated app |
| Customisable fields | Fully – it is your workbook | Fully | Only what the vendor exposes |
| Share with a link | Via cloud storage | Yes | Yes, per seat |
| Year-1 cost at 5 users | The purchase price, once | The purchase price, once | Subscription x 5 seats, plus per-charger fees |
| Live charger telemetry | No – you paste exported data | No | Yes, that is the point of a CPMS |
| Automated settlement and invoicing | No – it reports on settlement status you supply | No | Yes |
The honest summary: if you need chargers to be remotely started, metered and invoiced, buy a CPMS. If you already have that data – or you export it monthly from an operator portal – and you want a management report your finance and operations people can actually read, this workbook does that job for a one-time price.
Who This Template Is For – and Who It’s Not For
The Electric Vehicle Charging Dashboard in Excel is aimed at people who already hold the data and need to present it, not at people looking for an operating platform.
A good fit if you are: a charge point operator or site host running a handful to a few dozen hubs and reporting monthly; a fleet or facilities manager who receives charging exports and has to summarise cost and utilisation; an energy or sustainability analyst building a recurring pack; a consultant preparing a board-level review; an Excel user who wants a working PivotTable-and-slicer model to learn from and adapt.
Not a good fit if you need: live telemetry or remote charger control; automated OCPP or CPMS integration; a billing engine that issues invoices or reconciles payments; regulator-grade energy accounting, grid compliance or emissions reporting; or a multi-tenant system with user logins and permissions. This workbook makes no claim about charger performance, tariff correctness or energy accounting – it reports the numbers you put into it, nothing more.
How to Use the Electric Vehicle Charging Dashboard
- Unzip and open the workbook in Microsoft Excel. Excel 2016 or later, or Microsoft 365, on Windows or Mac. There are no macros, so nothing to enable.
- Look at the demo data first. All five pages ship populated with sample rows so you can see how a filter propagates before you change anything.
- Open the data sheet and replace the sample rows with your export. Keep the column headers exactly as they are – the PivotTables read them by name.
- Match your list values to the template’s categories or rename the template’s to match yours: charging hubs, regions, charger types (AC Level 1, AC Level 2, DC Fast, DC Ultra Fast), tariff plans, billing statuses, customer segments, payment methods and charging windows.
- Refresh. Data > Refresh All. Every PivotTable, chart and KPI card updates together.
- Use the slicers to read the story. Click one region and read margin, queue wait, satisfaction and settlement for that region alone; then one charger type to see how DC Ultra Fast economics differ from AC Level 2.
- Save a copy per reporting period so each month’s pack is a fixed artefact rather than a moving file.
Real-World Use Cases
Priya runs eight retail-site chargers for a property group. Each month she exports sessions from the operator portal, pastes them in, refreshes, and reads Settlement % by Charging Hub. The two sites at the bottom of that ranking are the conversation she takes to the operator, and the Revenue vs Service Cost by Charging Hub chart tells her whether a low-settlement site is also an expensive one.
Daniel manages a delivery fleet that charges on contract tariffs. He filters to Fleet Contract on the Billing and Energy page, checks net charging margin against the standard plan, and uses Avg. Queue Wait by Charging Window to decide whether shifting depot charging to Overnight would cut driver downtime.
Anita is an energy analyst preparing a quarterly review. She reads Total Charging Revenue vs Total Energy Cost by Quarter and Energy Delivered vs Renewable Energy by Charger Type, exports the two pages to PDF, and drops them into the board pack. She notes explicitly that the renewable split is what the supplier reported, not a measured figure – which is exactly how this workbook is meant to be used.
Frequently Asked Questions
Does this connect to my chargers or to an OCPP network?
No. This is a Microsoft Excel reporting template. It does not connect to any charger, OCPP network, CPMS, billing platform or utility meter, and it imports nothing automatically. You paste or link your own exported data and refresh.
Are the figures in the screenshots real?
No. Every utilisation, uptime, energy, satisfaction and revenue figure shown is buyer-entered demo data, included so the pages are readable before you load your own records. Replace it and the dashboard reports on yours.
Is this the same as your EV Charging Stations Dashboard or your Electric Vehicle Charging KPI Dashboard?
No – and the names are close enough to be worth spelling out. This is the analytical dashboard line. The KPI Dashboard and the KPI Scorecard lines are different templates with a different structure – a month picker, target-versus-actual traffic lights and a trend page. Buy the one whose layout matches the report you have to produce.
Do I need macros, Power Query or a Power BI licence?
None of them. The workbook is native Excel: formulas, PivotTables, slicers and standard charts. It opens and refreshes offline.
Can I add my own hubs, tariff plans or charger types?
Yes. Add the rows to the data sheet and refresh – the PivotTables pick up new category values automatically. Renaming an existing category is just as safe. Adding a brand-new measure means adding a column and a field to a PivotTable, which the manual walks through.
What exactly do I download?
One ZIP file containing the .xlsx workbook and a user manual PDF. Download is instant after checkout and your access does not expire.
Can I use it for client work?
Yes – use it inside your own business or for your clients’ reporting. You may not resell or redistribute the template file itself.
About the Author
Built by PK – Microsoft Certified Professional with 15+ years of Excel, Google Sheets, and Power BI experience. Founder of NextGenTemplates, reaching 300K+ subscribers across YouTube channels. Every template is hand-built and tested before release. Tutorials at youtube.com/@PKAnExcelExpert.
Explore Related Templates
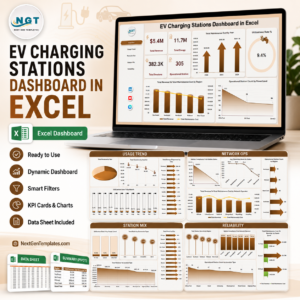
- EV Charging Stations Dashboard in Excel – a station-focused view of the same industry.
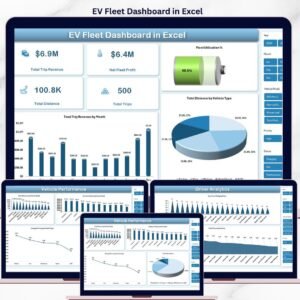
- EV Fleet Dashboard in Excel – for the vehicles rather than the chargers.
- Electric Vehicle Charging KPI Dashboard in Excel – the target-versus-actual scorecard layout.
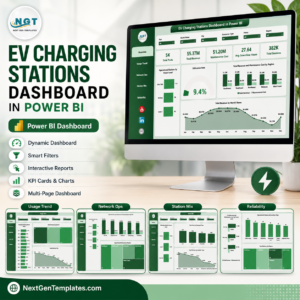
- EV Charging Stations Dashboard in Power BI – if your reporting already lives in Power BI.
- Micro-Mobility Platforms Dashboard in Excel – adjacent transport reporting.
- Browse the full Excel Dashboard category or the Operations templates.
A full page-by-page walkthrough of this workbook is published on the blog: Electric Vehicle Charging Dashboard in Excel – page-by-page guide.
Add the Electric Vehicle Charging Dashboard in Excel to your cart and download immediately – the workbook, the manual, and lifetime access to the file you paid for. Remember that the sample rows are demo data: your report begins the moment you paste your own.
Last updated: 12 September 2026.