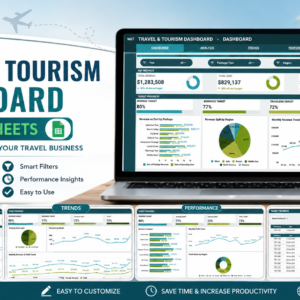
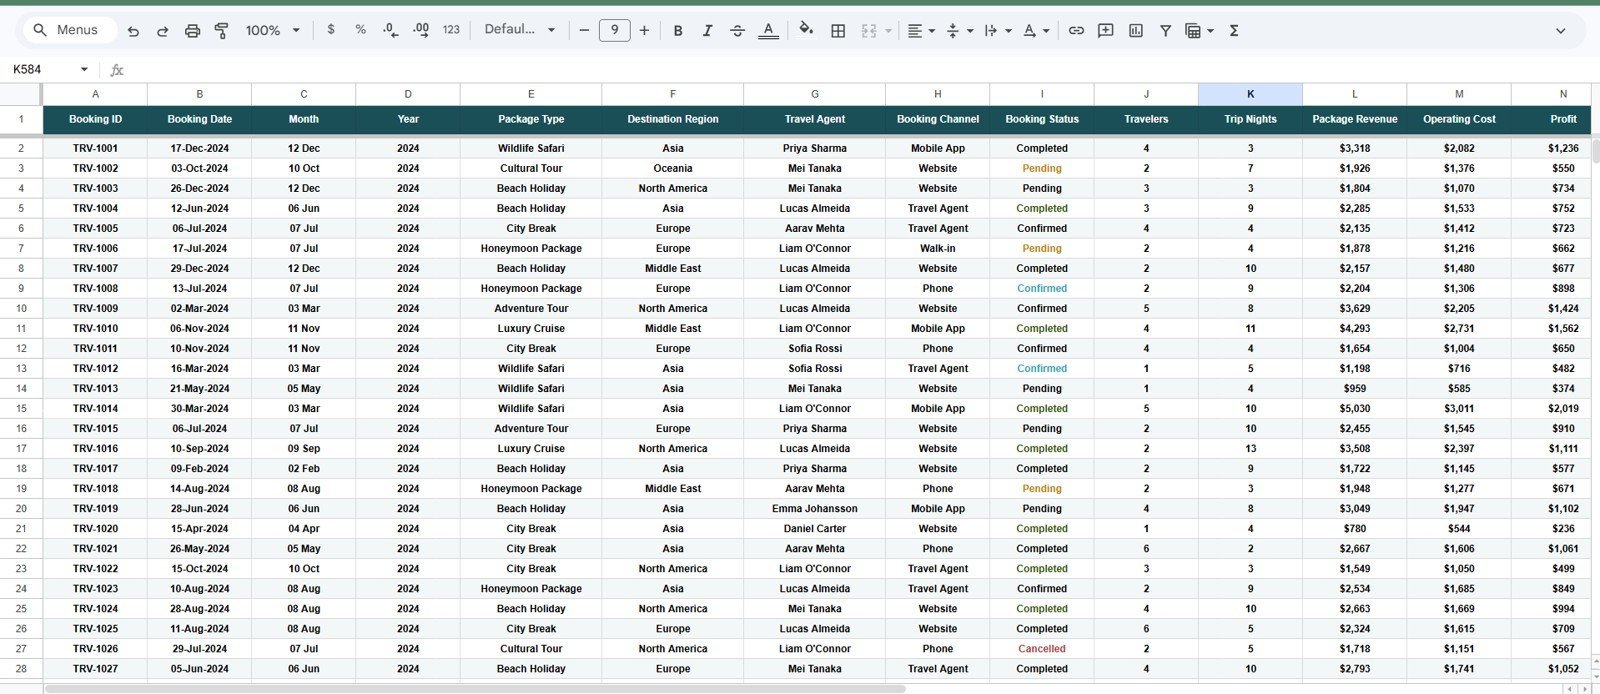

Travel and Tourism Dashboard in Google Sheets helps travel agencies, tour operators, tourism boards, and destination teams monitor revenue, cost, bookings, travelers, and profit in one editable dashboard. WTTC reported that travel and tourism reached US$11.6 trillion in global GDP contribution in 2025 and supported 366 million jobs worldwide, so small reporting gaps can become expensive fast. This template gives you a no-subscription way to review sample data, replace it with your own booking records, and check the dashboard before making operational decisions.
Key Features of Travel and Tourism Dashboard in Google Sheets
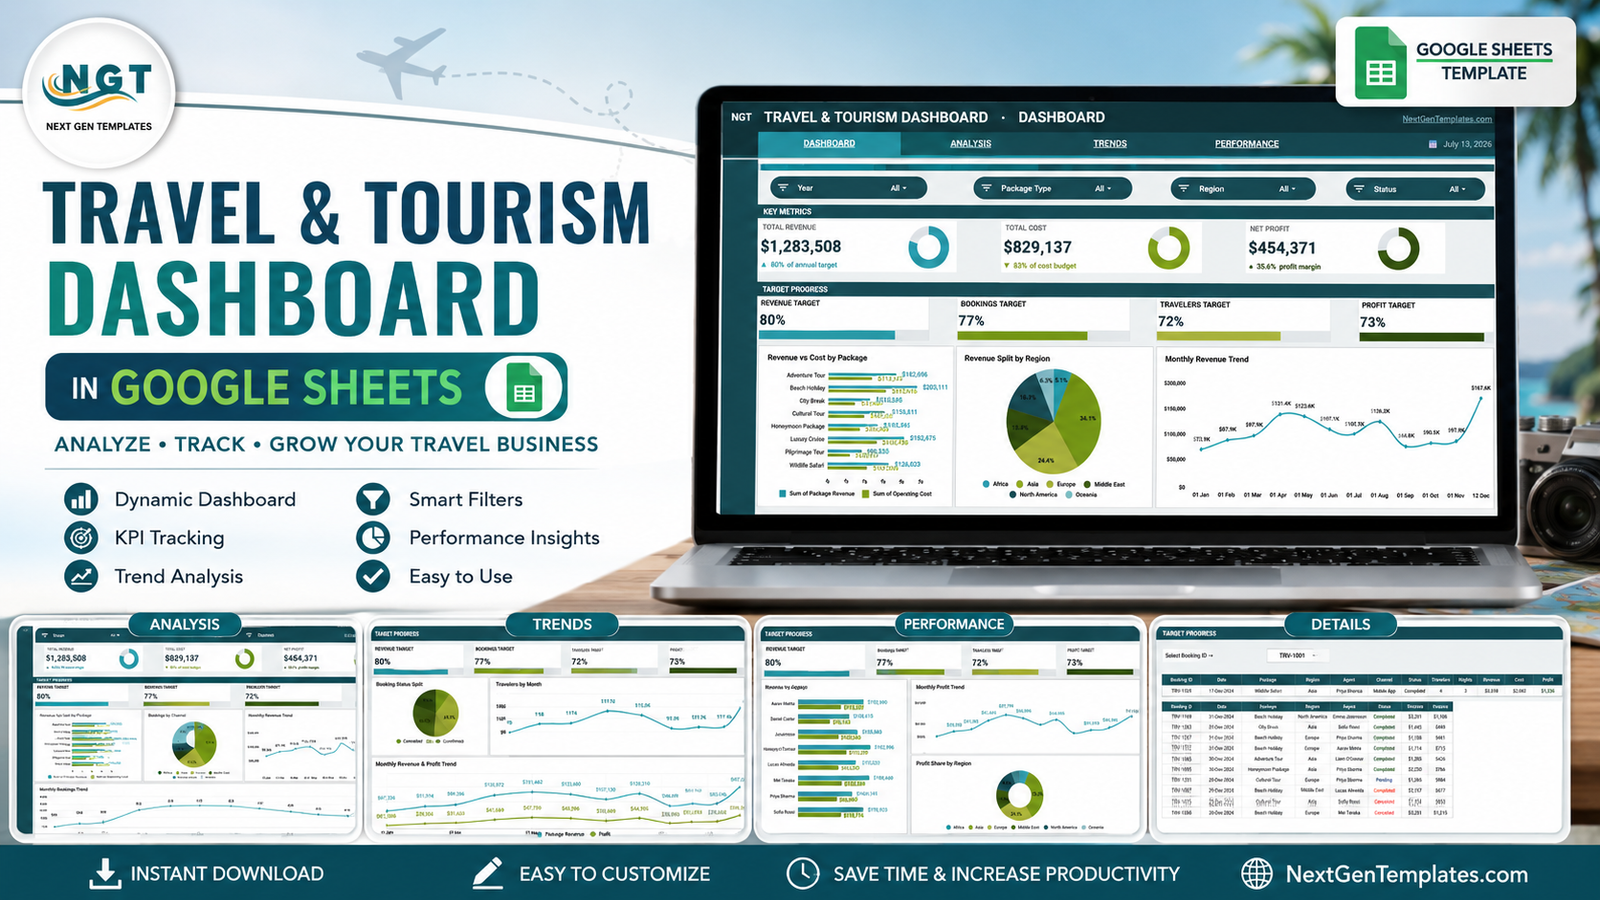
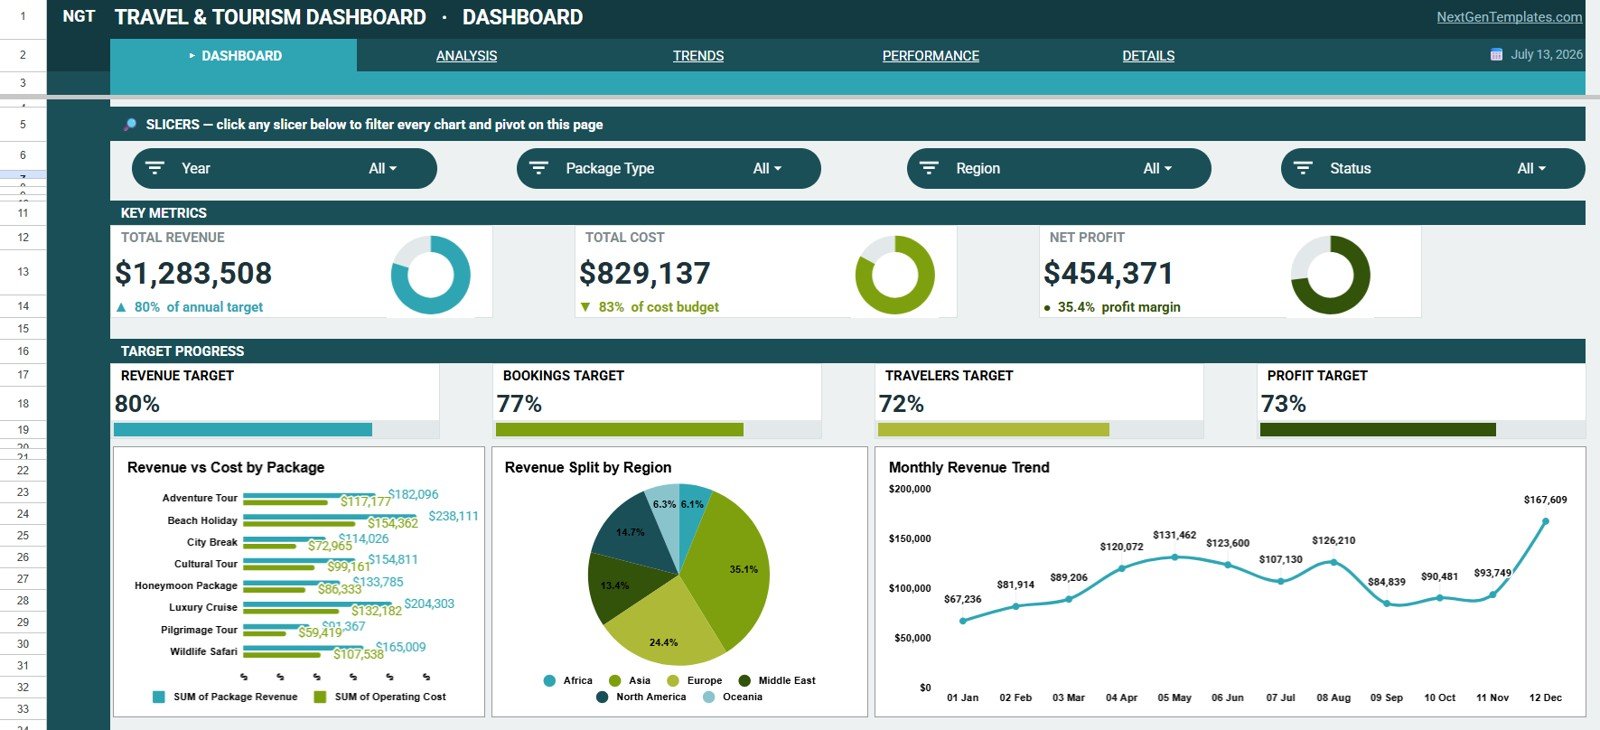
- Seven KPI cards: Track Total Revenue, Total Cost, Net Profit, Revenue Target, Bookings Target, Travelers Target, and Profit Target from the Overview page.
- Six structured tabs: Overview, Analysis, Trends, Performance, Details, and Data Sheet keep reporting organized by decision type.
- Interactive slicers: Filter dashboard views quickly by available fields so managers can review specific periods, regions, packages, channels, agents, or statuses.
- Revenue, cost, and profit charts: Compare financial performance by package, region, agent, booking ID, and month without building charts from scratch.
- Booking and traveler analysis: Review bookings by channel, status, month, and individual booking record to understand demand and service flow.
- Google Sheets collaboration: Share the editable file with authorized team members and update records in a familiar browser-based spreadsheet.
What’s Inside the Travel and Tourism Dashboard in Google Sheets
1. Overview Page
The Overview page presents the executive cards and high-level charts. Revenue and Cost by Package shows which tour packages drive income and expense, Revenue by Region shows geographic contribution, and Revenue by Month helps identify seasonal movement.
2. Analysis Tab
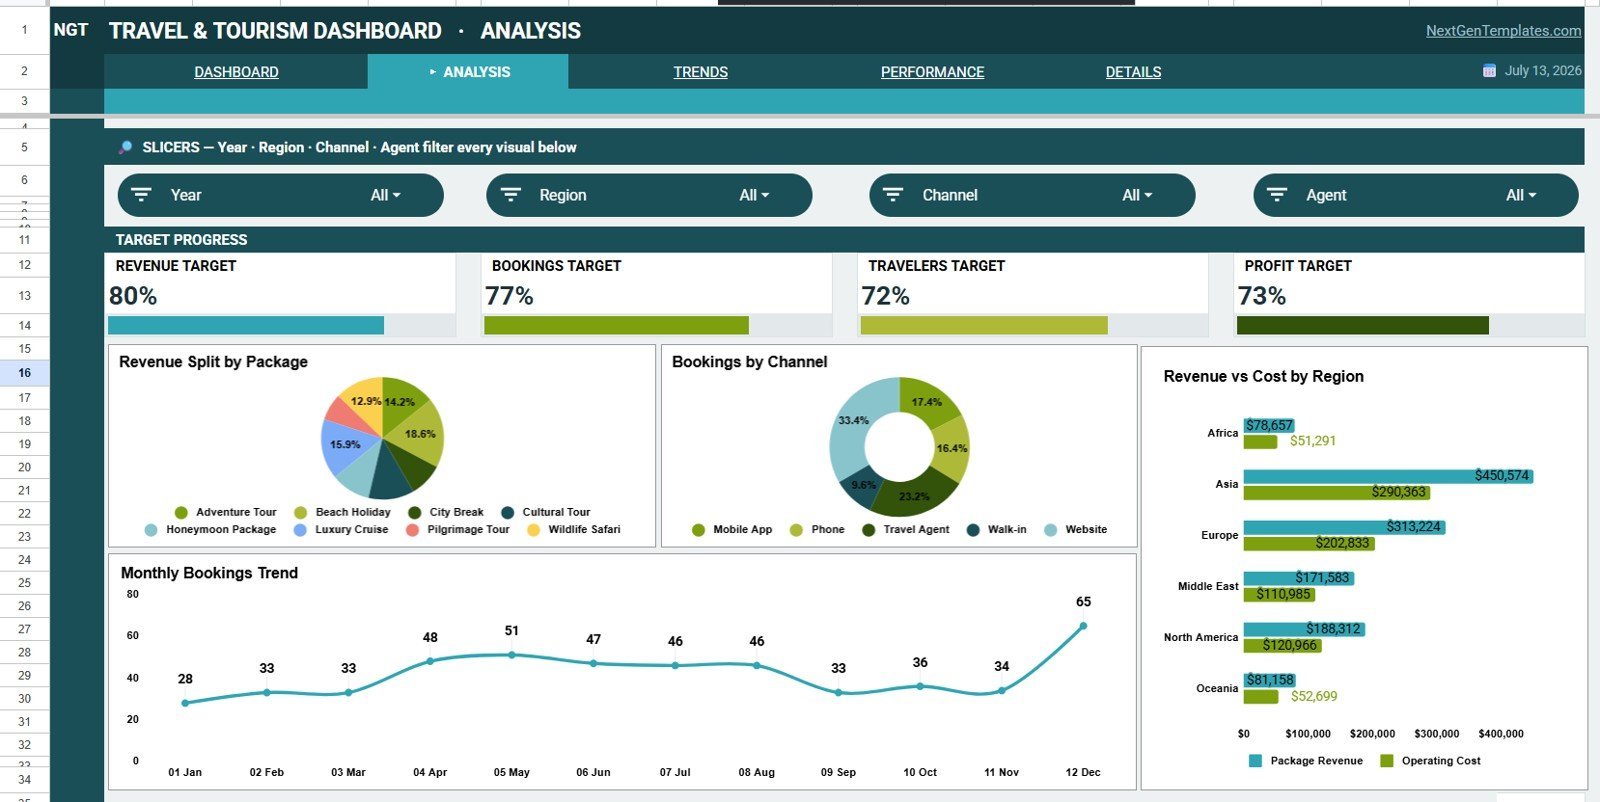
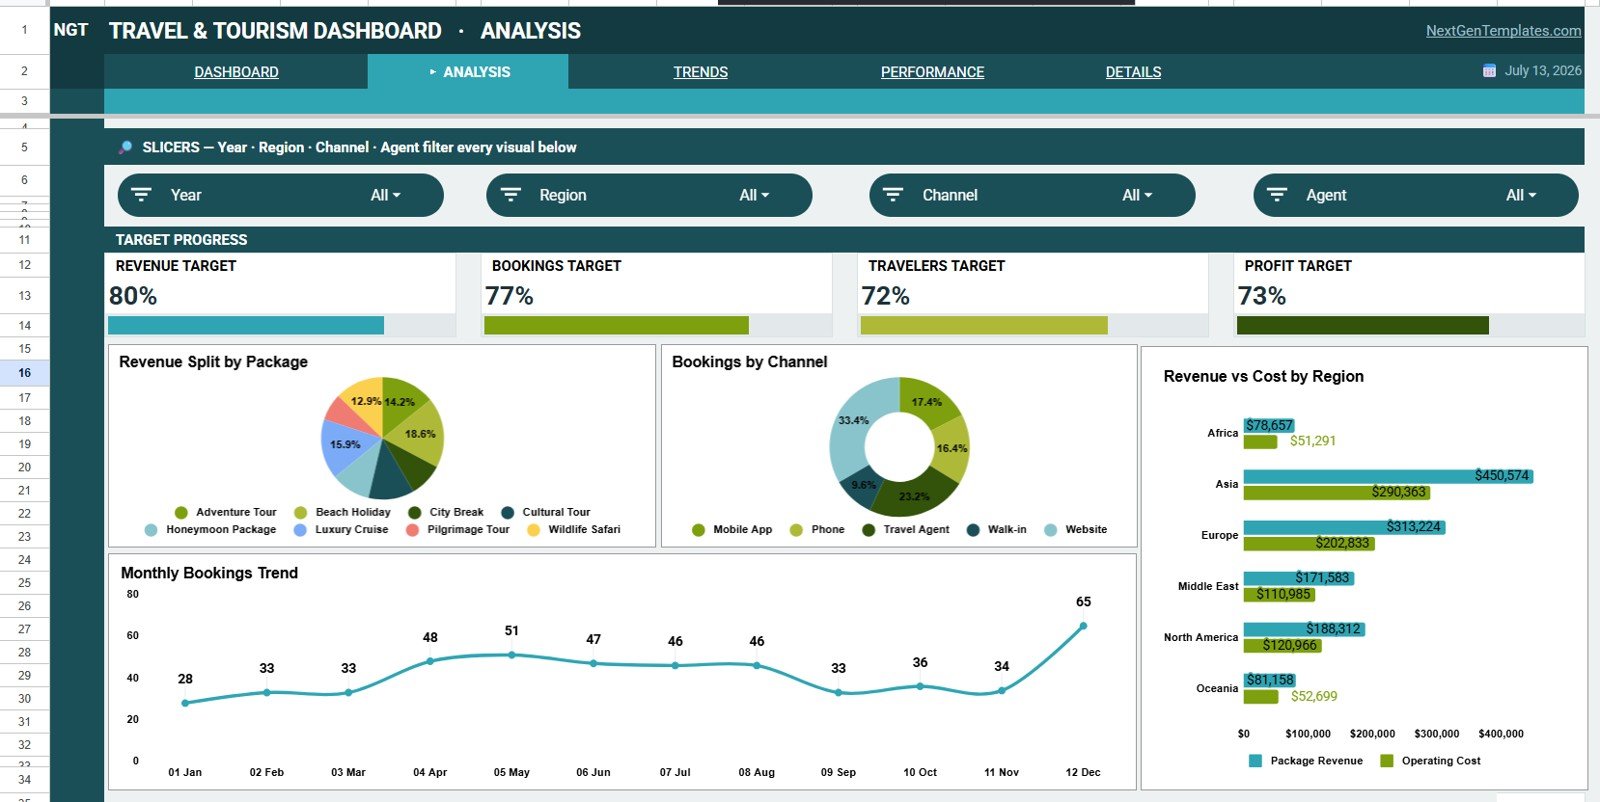
The Analysis tab focuses on Revenue by Package, Bookings by Channel, Revenue and Cost by Region, and Bookings by Month. These charts help teams see which packages, channels, and regions deserve closer attention.
3. Trends Tab
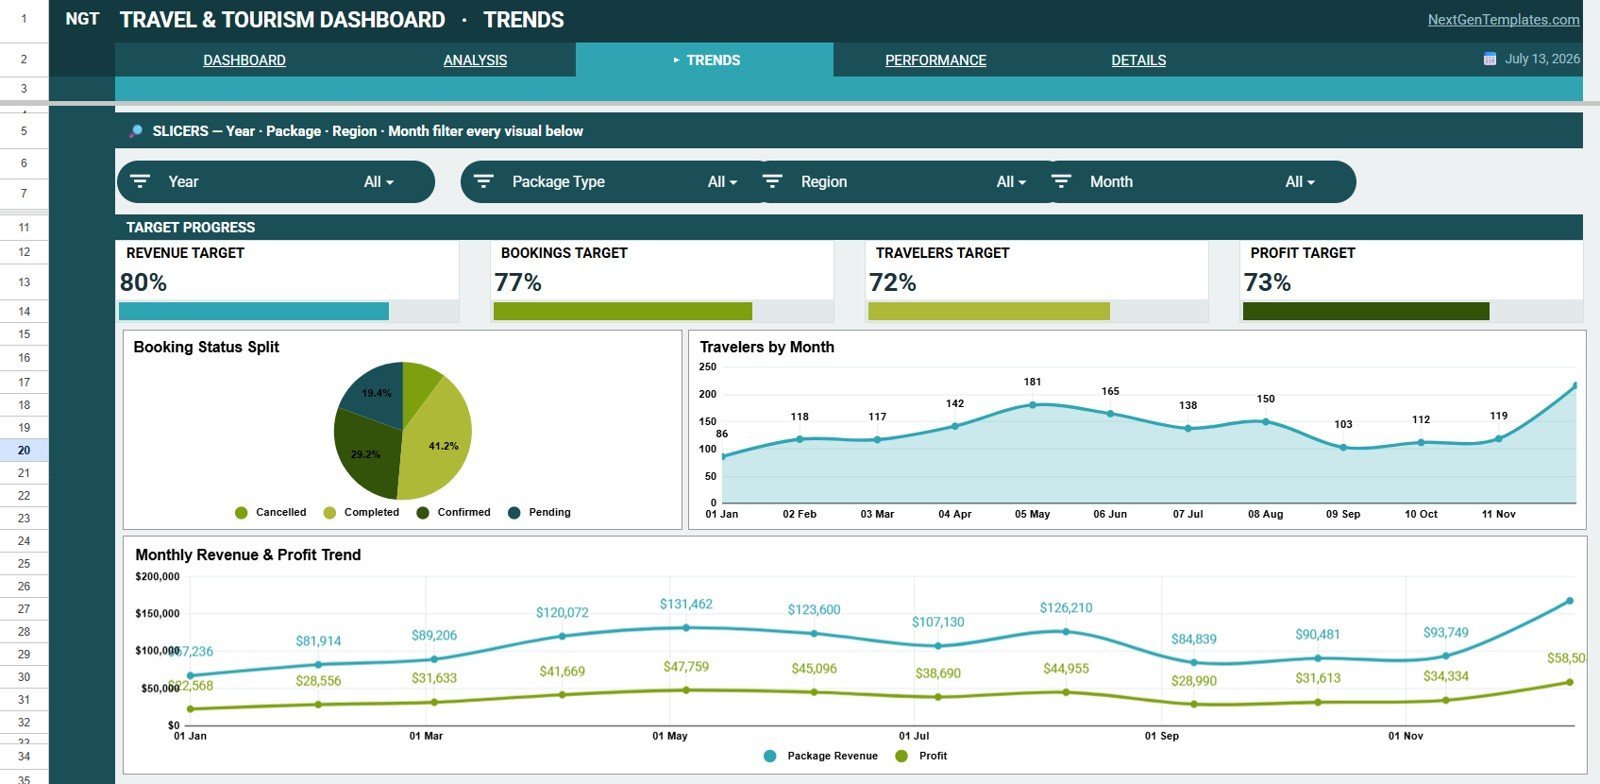
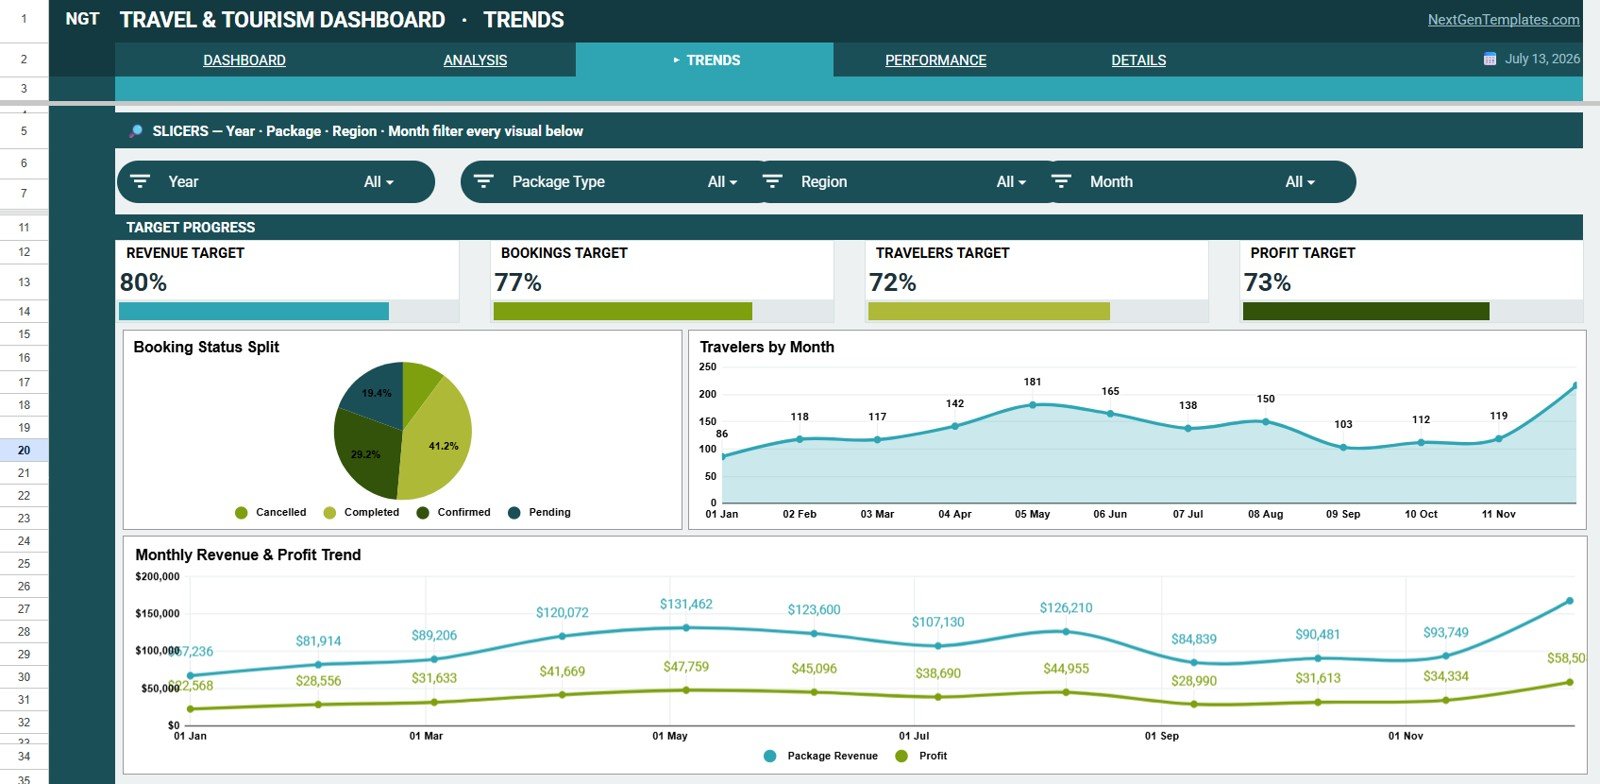
The Trends tab reviews Bookings by Status, Travelers by Month, and Revenue and Profit by Month. It is useful for spotting booking pipeline movement, traveler seasonality, and whether revenue growth is translating into profit.
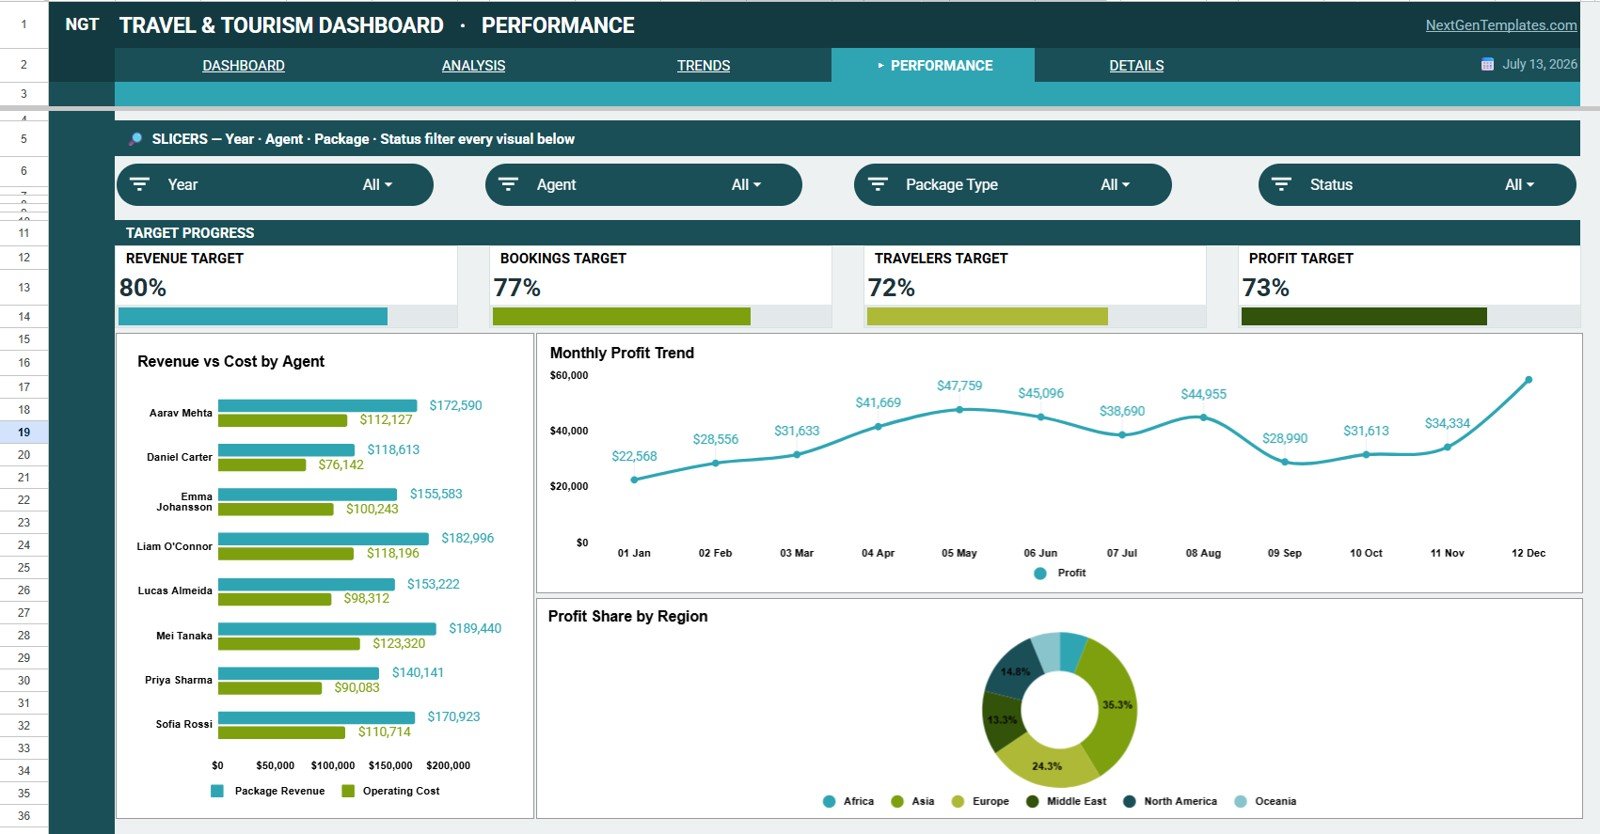
4. Performance Tab
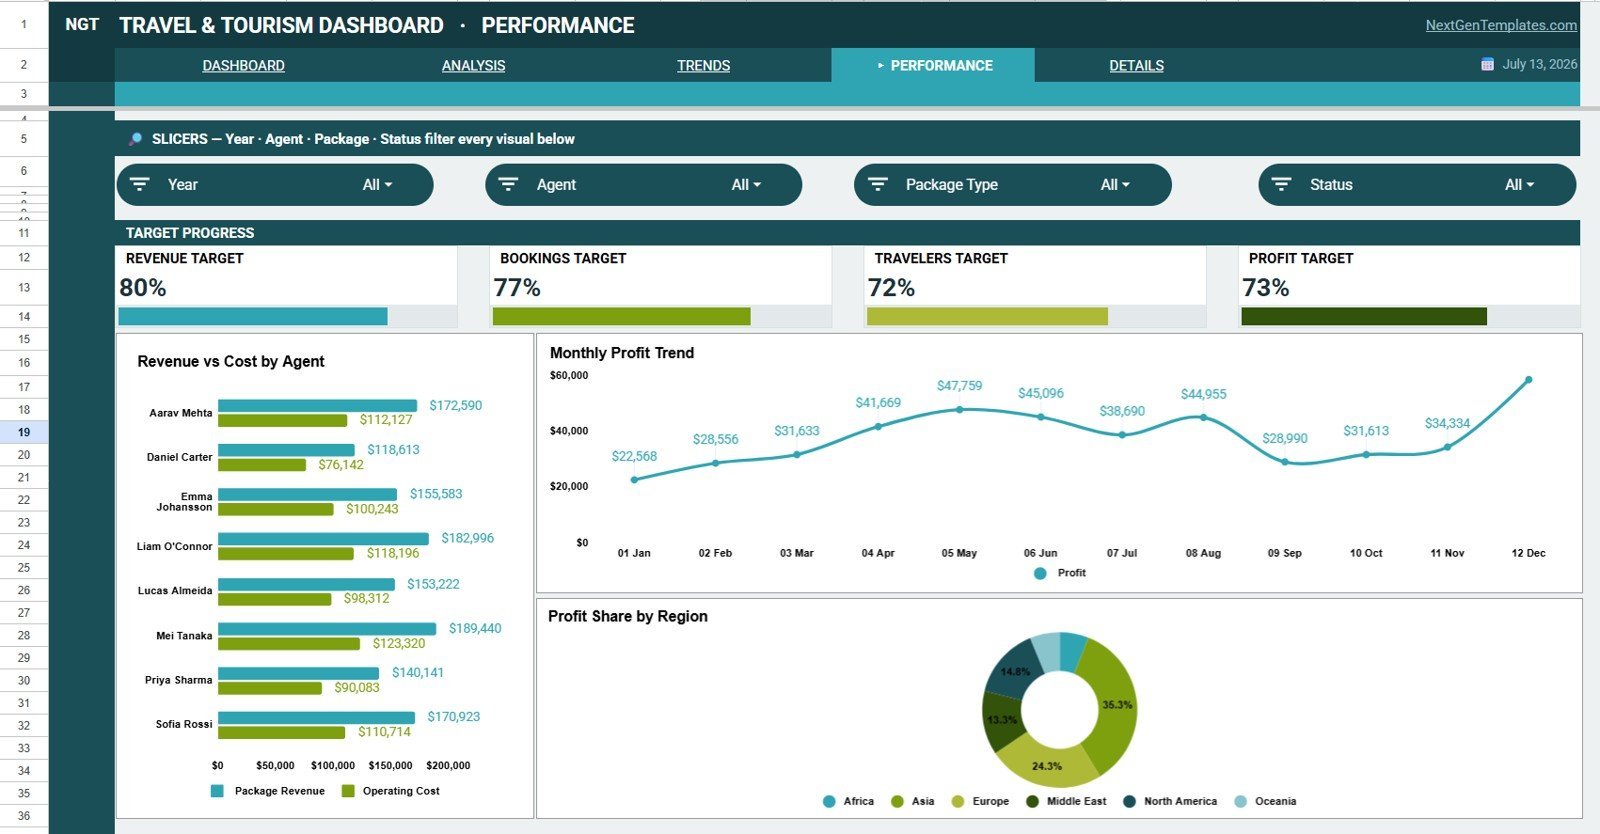
The Performance tab compares Revenue and Cost by Agent, Profit by Month, and Profit by Region. It helps managers review sales contribution, monthly profitability, and regional margin patterns.
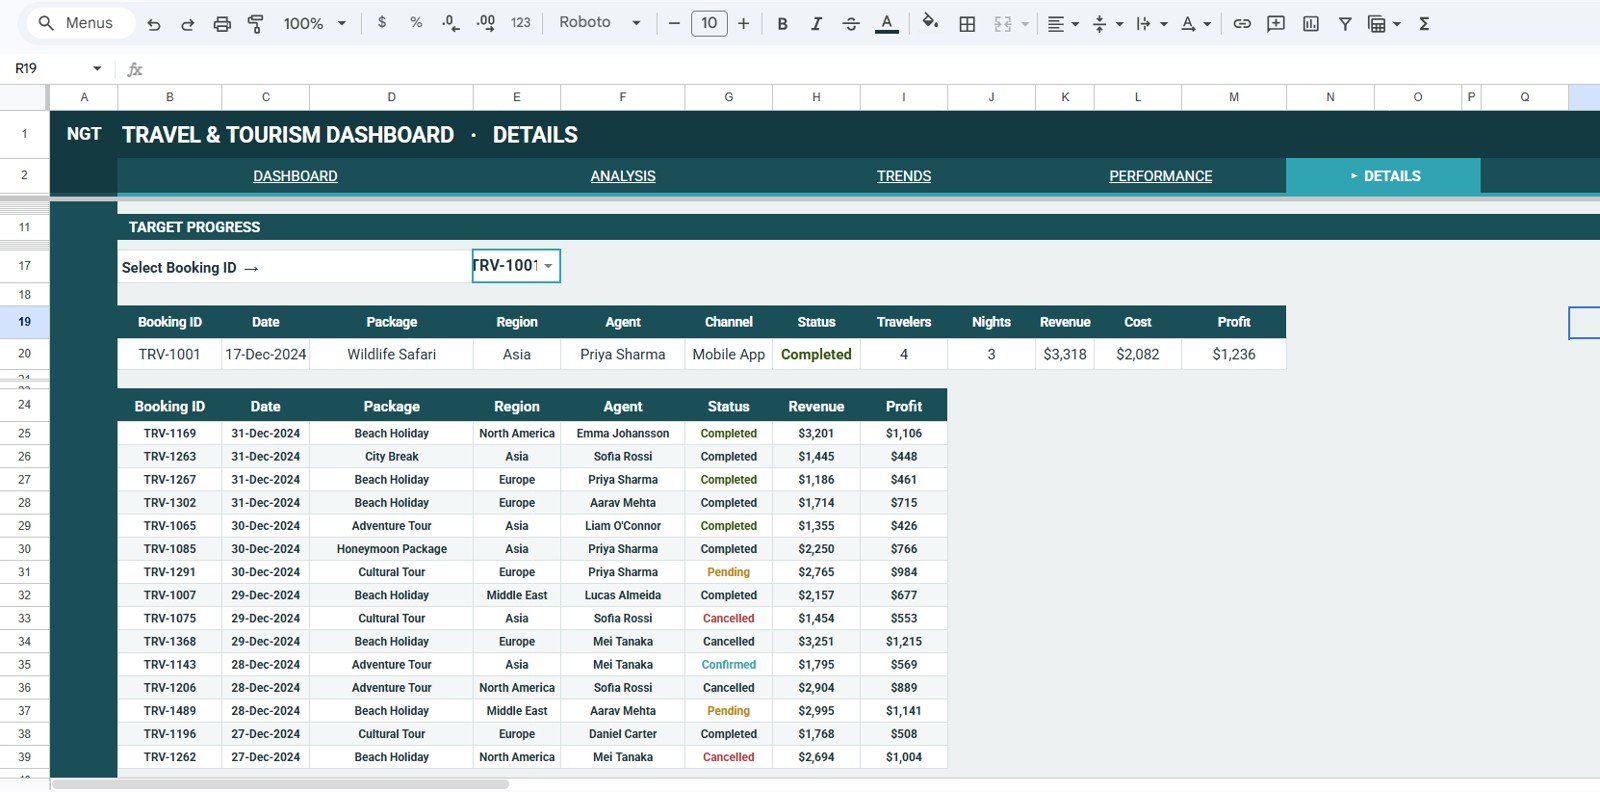
5. Details Tab
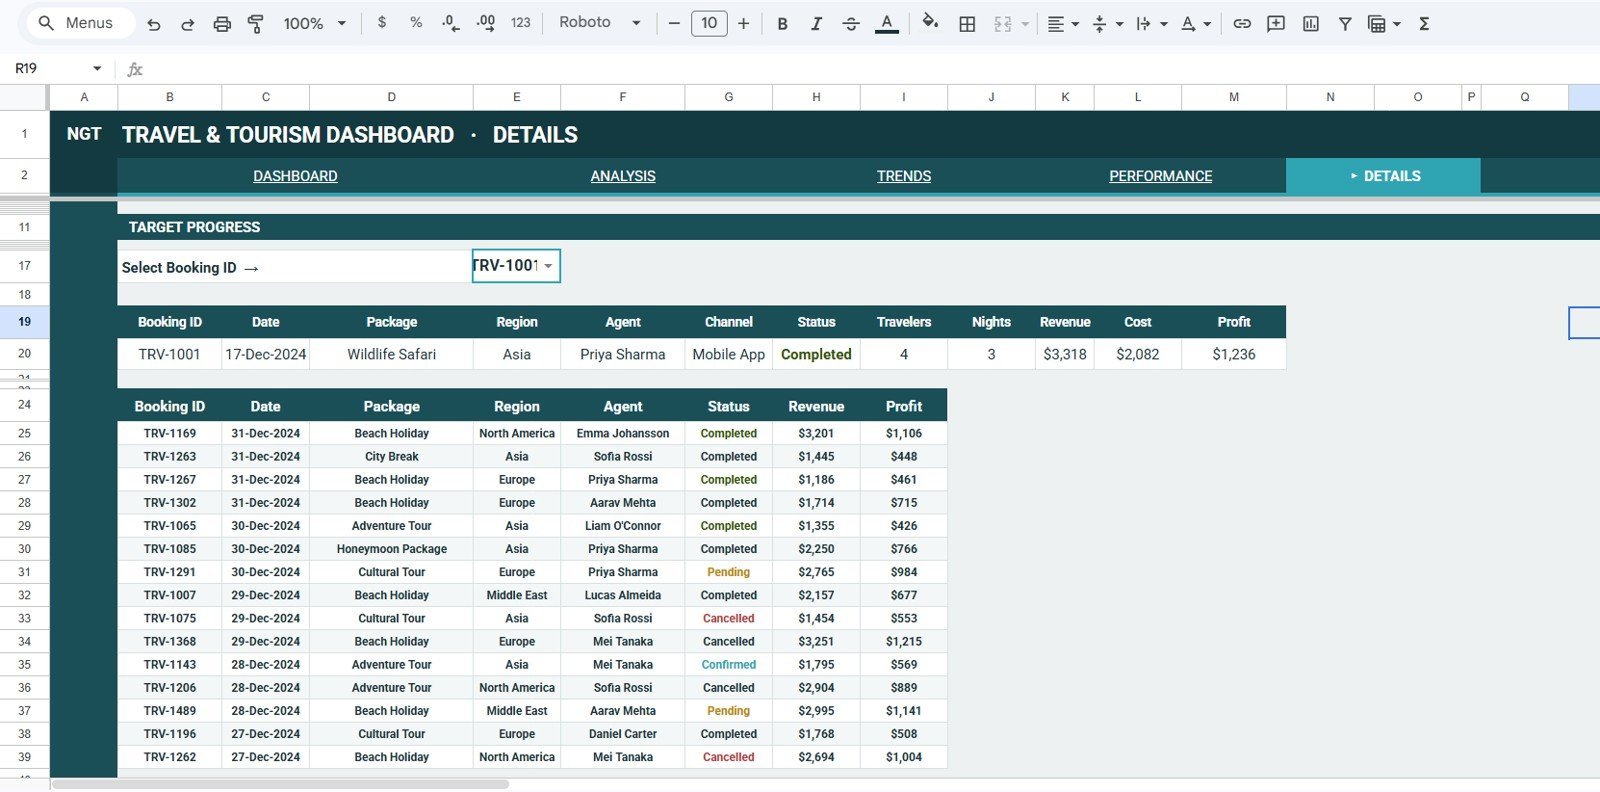
The Details tab gives booking-level visibility through Booking Records by Booking ID, Revenue by Booking ID, and Profit by Booking ID. Use it when a manager needs to investigate specific bookings behind the summary numbers.
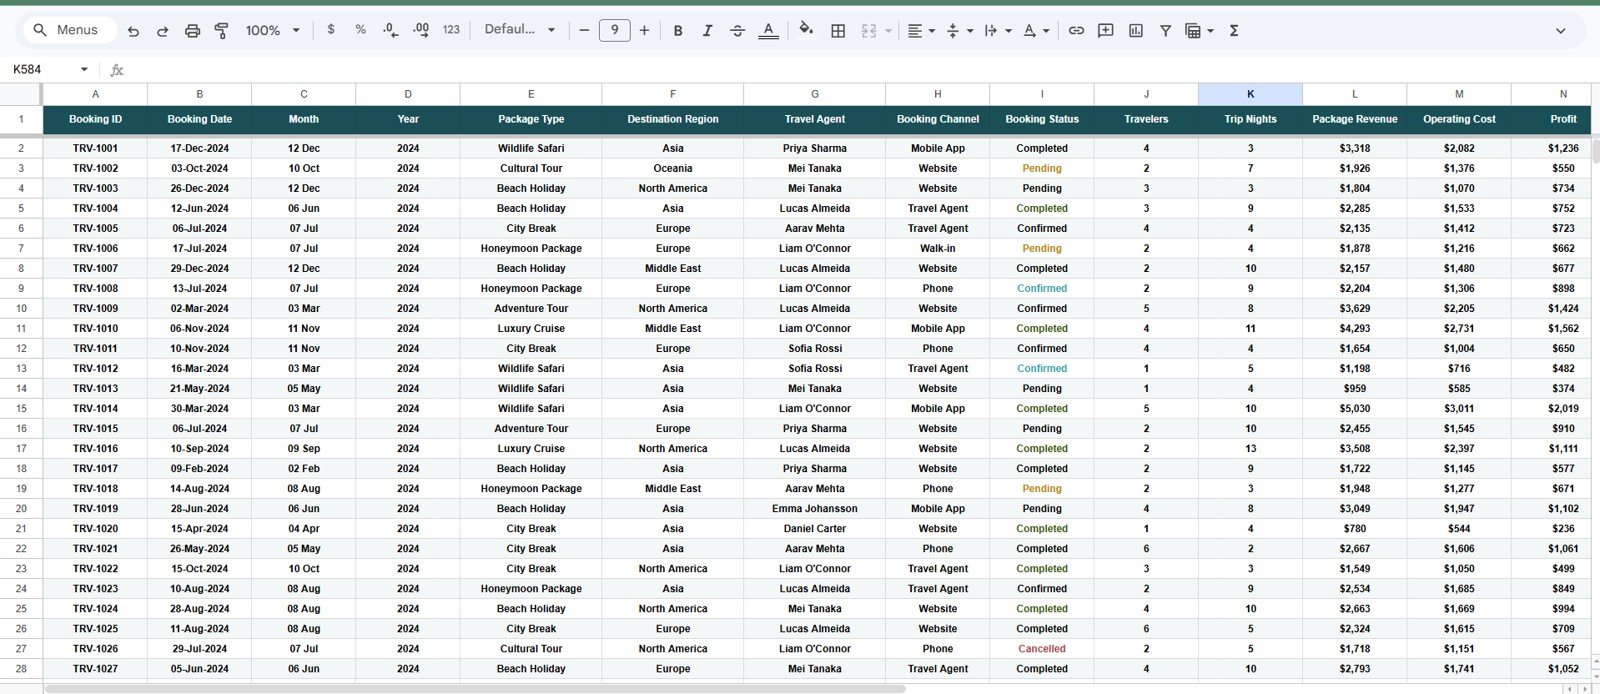
6. Data Sheet Tab
The Data Sheet is where you add your booking data in the same format as the sample records. Keeping the structure consistent helps the cards, slicers, and charts update correctly.
Travel and Tourism Dashboard in Google Sheets vs. Microsoft Excel vs. Paid CRM/SaaS – Where This Fits
| Option | Best fit | Tradeoff |
|---|---|---|
| This Google Sheets dashboard | Fast shared reporting for bookings, revenue, travelers, regions, packages, channels, and agents | Requires clean data entry in the Data Sheet |
| Microsoft Excel dashboard | Offline spreadsheet reporting and advanced desktop modeling | Real-time collaboration usually needs OneDrive or SharePoint |
| Paid travel CRM or booking SaaS | End-to-end reservations, customer records, payments, and automation | Higher recurring cost and longer setup |
Who This Template Is For – and Who It’s Not For
This template is for travel agency owners, tour operators, destination marketers, tourism analysts, finance coordinators, and operations managers who already have booking records and want a clean reporting layer. It is not a replacement for a booking engine, payment gateway, CRM, accounting system, or live reservation platform. If you need automated API imports, role-based enterprise controls, or customer lifecycle automation, use this dashboard as a reporting companion rather than the system of record.
How to Use the Travel and Tourism Dashboard in Google Sheets
- Open the PDF guide from your download and create your editable Google Sheets copy.
- Go to the Data Sheet tab and replace sample rows with your booking records.
- Keep package, region, channel, agent, status, month, revenue, cost, profit, and traveler fields consistent.
- Review the Overview page first, then move to Analysis, Trends, Performance, and Details for explanations.
- Use slicers to filter the dashboard during monthly reviews or campaign meetings.
Real-World Use Cases
Anita, travel agency owner: Reviews revenue, booking targets, and channel mix before deciding where to spend next month’s promotion budget.
Rohan, tour operations manager: Checks package-level cost, regional profit, and agent performance before adjusting itinerary pricing.
Meera, tourism analyst: Uses traveler trends and booking status charts to explain seasonal movement to a destination marketing team.
Frequently Asked Questions
Can I edit the dashboard after purchase?
Yes. After creating your copy in Google Sheets, you can edit labels, sample data, formulas, charts, slicers, colors, and sheet names.
Does this template include a data input sheet?
Yes. The Data Sheet tab stores booking records in a structured format so the dashboard can update from the same table layout.
Can I track targets?
Yes. The Overview page includes Revenue Target, Bookings Target, Travelers Target, and Profit Target cards for fast target review.
Is this suitable for small travel agencies?
Yes. It is especially useful for small and mid-sized teams that need a practical dashboard before investing in a larger SaaS tool.
Does it connect automatically to my booking system?
No. This is a Google Sheets template. You add, paste, or import your data into the Data Sheet tab.
Can multiple users work in the file?
Yes, Google Sheets supports sharing and collaboration, as long as you set the right access permissions for your team.
About the Author
Built by PK – Microsoft Certified Professional with 15+ years of Excel, Google Sheets, and Power BI experience. Founder of NextGenTemplates, reaching 300K+ subscribers across YouTube channels. Every template is hand-built and tested before release.
Explore Related Templates
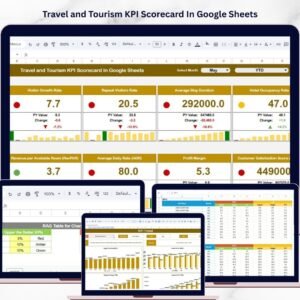
- Travel and Tourism KPI Scorecard in Google Sheets
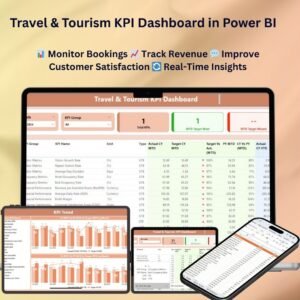
- Travel & Tourism KPI Dashboard in Power BI
- Google Sheets templates
- Google Sheets dashboard templates<
Watch the step-by-step video Demo:
Get the Travel and Tourism Dashboard
Last updated: July 13, 2026.