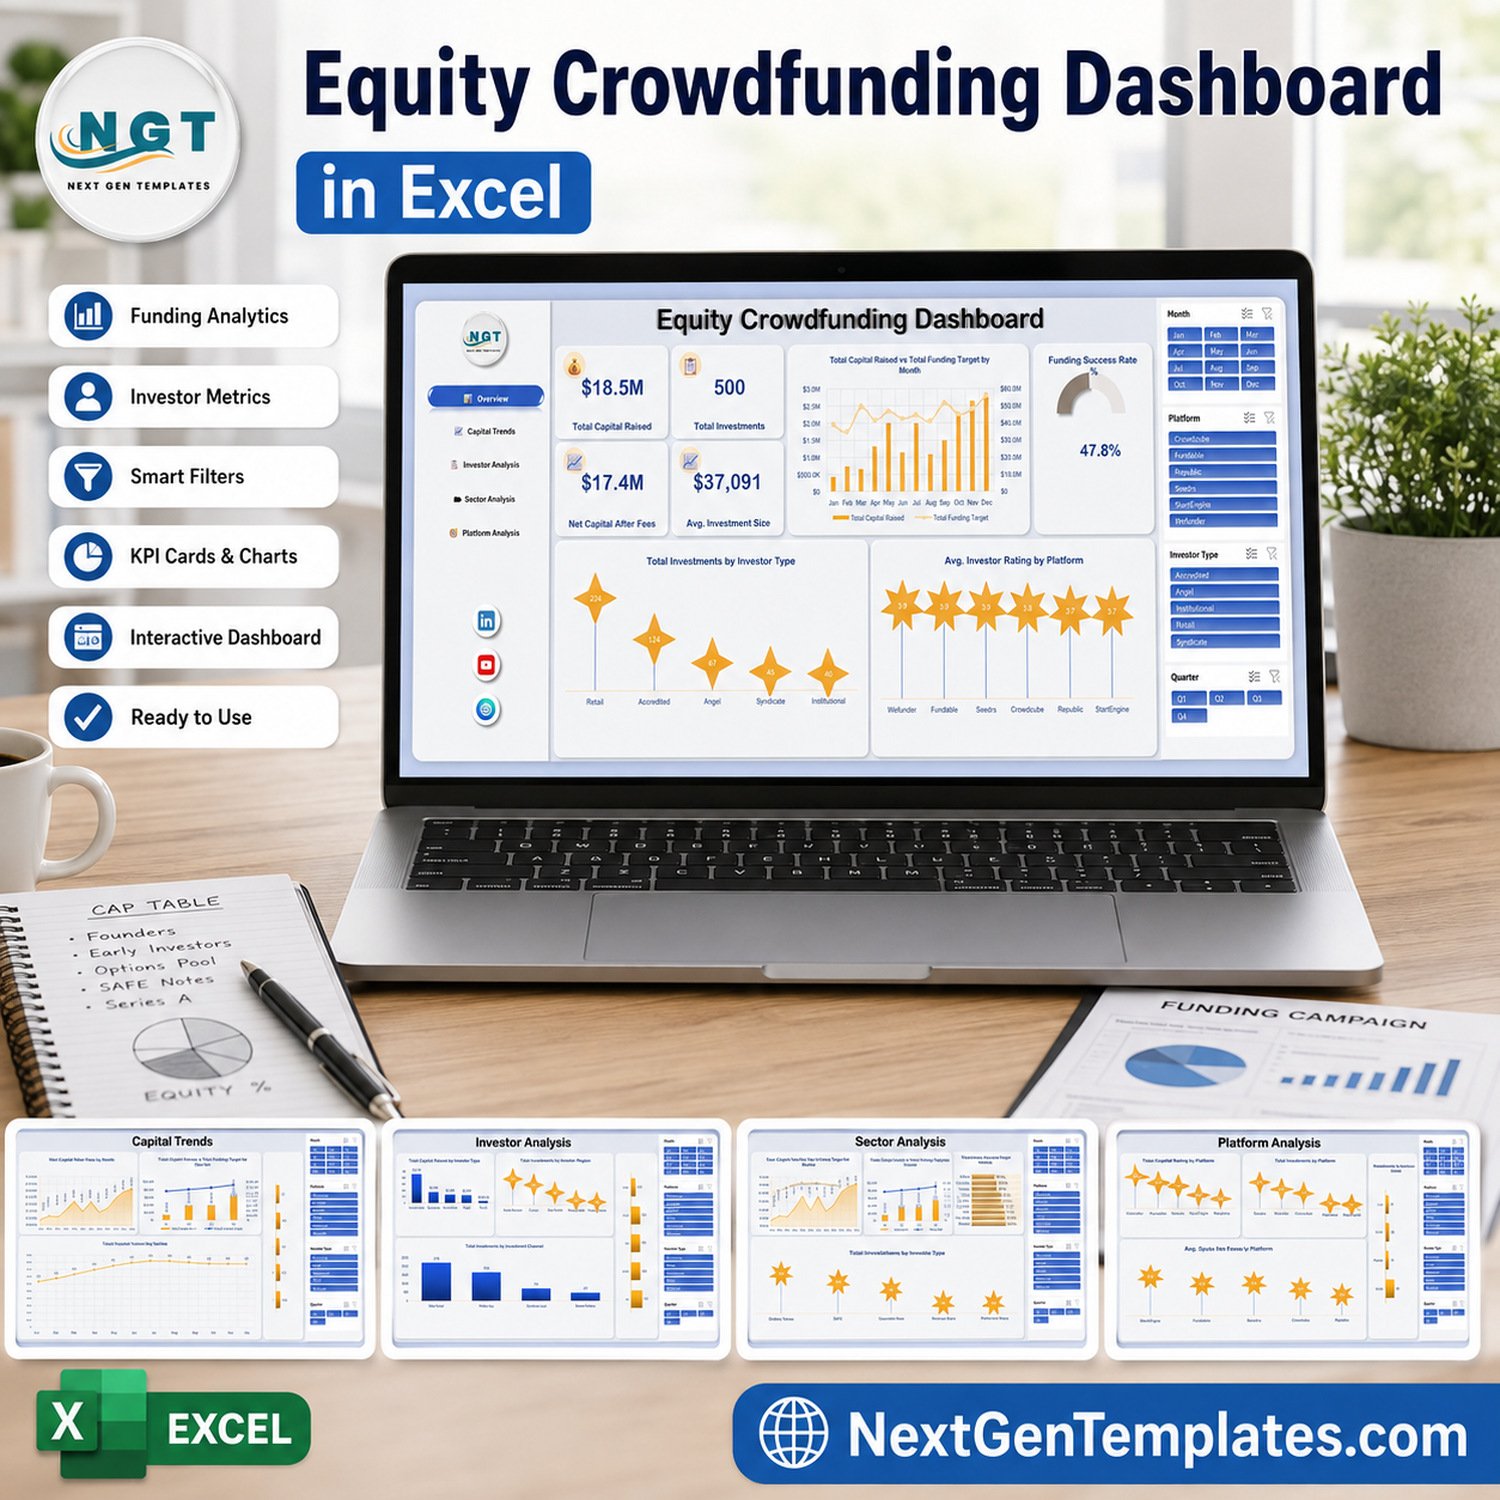
Equity Crowdfunding Dashboard in Excel turns campaign, investor, sector, platform, and funding-stage records into five interactive analysis pages. The sample overview demonstrates $18.5M capital raised, 500 investments, $17.4M net capital after fees, a $37,091 average investment, and a 47.8% funding success rate. Month, platform, investor type, and quarter slicers help users explore the example data. Replace it with your own validated records and refresh the analysis. This is an analytical template, not investment advice, a securities valuation, a forecast, or a substitute for regulated reporting and professional review.

Key Features of Equity Crowdfunding Dashboard in Excel
- Five analysis pages: Overview, Capital Trends, Investor Analysis, Sector Analysis, and Platform Analysis.
- Four headline KPIs: capital raised, investment count, net capital after fees, and average investment size.
- Funding success gauge: compare raised capital with funding targets in the supplied data.
- Four shared slicer groups: Month, Platform, Investor Type, and Quarter.
- Multi-angle analysis: compare campaigns by investor, region, channel, sector, security type, stage, and platform.
- Customer ZIP: includes the Excel workbook and Excel Dashboard User Manual PDF.
What’s Inside the Excel Crowdfunding Dashboard
Overview Page
The landing page combines the four KPI cards with Total Capital Raised vs Total Funding Target by Month, Total Investments by Investor Type, Average Investor Rating by Platform, and the funding success gauge. Values shown in screenshots are sample data, not performance claims.
Capital Trends
Review Net Capital After Fees by Month, raised capital versus target by quarter, Total Investments by Month, and Capital Raised by Funding Stage. This page helps users identify timing and stage patterns in historical records.

Investor Analysis
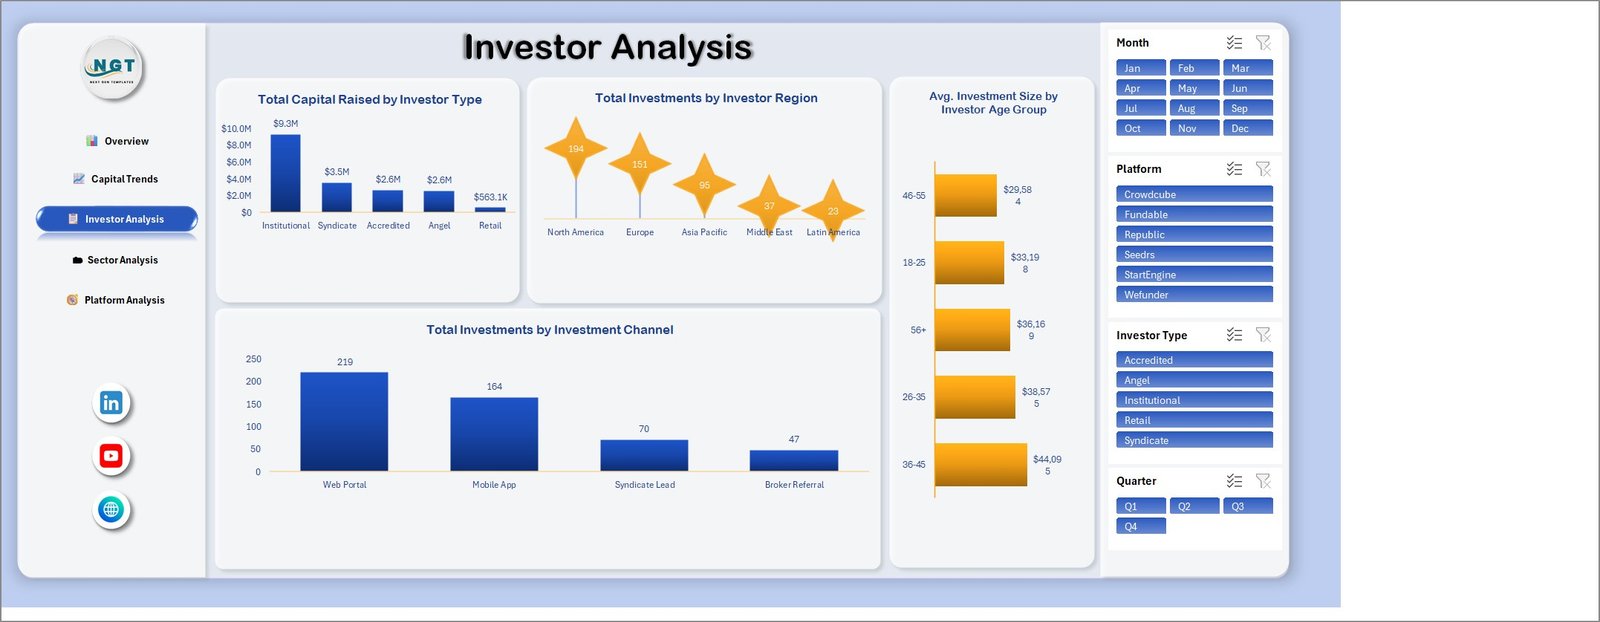
Compare capital by investor type, investment count by region and channel, and average investment size by age group. Use only data you are permitted to analyze and avoid drawing suitability conclusions from demographic categories.
Sector Analysis
Assess capital raised against funding targets by sector, funding success rate by sector, the top ten startups by capital raised, and investments by security type.

Platform Analysis
Compare capital raised, investment counts, average days to close, and campaign status across example platforms. Platform names are illustrative categories in the supplied dataset and do not imply endorsement.

Excel Dashboard vs. Power BI vs. Paid Investment Software – Where This Fits
| Consideration | This Excel dashboard | Power BI alternative | Paid investment software |
|---|---|---|---|
| Commercial model | One-time template | Desktop file plus licensing as applicable | Recurring subscription |
| Best fit | Structured historical analysis | Larger connected models | Operational deal workflows |
| Offline use | Yes | Desktop analysis | Varies |
| Interactive filters | Excel slicers | Report slicers | Vendor-dependent |
| Automated data connections | Not preconfigured | Often configurable | Often included |
| Regulatory reporting | Not included | Not included by default | Vendor-dependent |
Who This Template Is For – and Who It’s Not For
It fits crowdfunding analysts, finance teams, platform operators, accelerators, consultants, and academic or internal research teams that already have structured historical data. It is not a cap-table system, investor portal, transaction ledger, due-diligence tool, valuation model, securities recommendation engine, or filing platform.
How to Use This Excel Dashboard
- Download and unzip the package.
- Open the workbook in Microsoft Excel desktop.
- Keep an untouched backup of the sample file.
- Replace sample records with complete, validated source data using the existing columns.
- Refresh calculations and confirm totals against source records.
- Use Month, Platform, Investor Type, and Quarter slicers to explore results.
- Have qualified finance, legal, or compliance reviewers validate any decision or external report.
Real-World Use Cases
A platform analyst can compare campaign status and closing duration by platform. A finance manager can review capital raised versus target and net capital after fees. An accelerator can explore sectors, stages, and channels represented in its historical portfolio. A consultant can prepare an internal descriptive review after reconciling the source dataset.
A monthly review can begin on Overview, move to Capital Trends for timing, then use Investor, Sector, and Platform pages to investigate drivers. Record the active filter selections whenever screenshots or findings are shared so readers understand which subset produced the visible totals. When platform, sector, or investor labels change, standardize the source values before refresh to avoid splitting one category into multiple chart entries.
Frequently Asked Questions
Does the dashboard predict campaign success?
No. It summarizes entered historical data and does not provide forecasts or guarantees.
Is this investment advice?
No. It is an analytical template and does not recommend securities, platforms, campaigns, or investor actions.
Can I replace the sample data?
Yes. Use the existing structure and validate totals after refresh.
Which filters are included?
Month, platform, investor type, and quarter slicers appear across the dashboard pages.
Does it handle cap tables or transactions?
No. Use approved specialist systems for ownership records, transactions, investor onboarding, and filings.
Is a user manual included?
Yes. The ZIP contains the Excel workbook and Excel Dashboard User Manual PDF.
Are the figures live market data?
No. The screenshots contain illustrative sample records. The workbook has no preconfigured live market feed.
About the Author
Built by PK – Microsoft Certified Professional with 15+ years of Excel, Google Sheets, and Power BI experience. Founder of NextGenTemplates, reaching 300K+ subscribers across YouTube channels. Every template is hand-built and tested before release.
Explore Related Templates
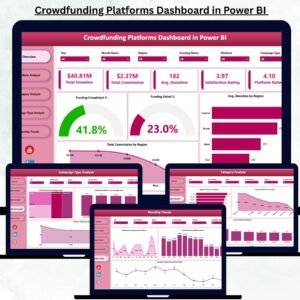
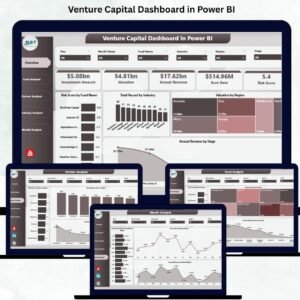
Compare the Crowdfunding Platforms Dashboard in Excel, Power BI edition, Venture Capital Dashboard in Excel, and Crowdfunding Platforms KPI Dashboard. Browse more Excel dashboards. Microsoft explains how to use slicers to filter data.
Build a clearer descriptive view of equity crowdfunding data. Download the dashboard, replace the sample records, reconcile the results, and use the five pages for internal analysis.
Last updated: September 10, 2026.