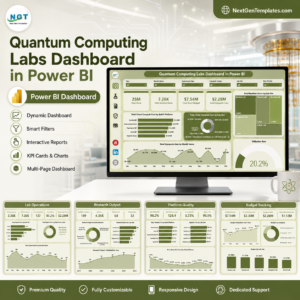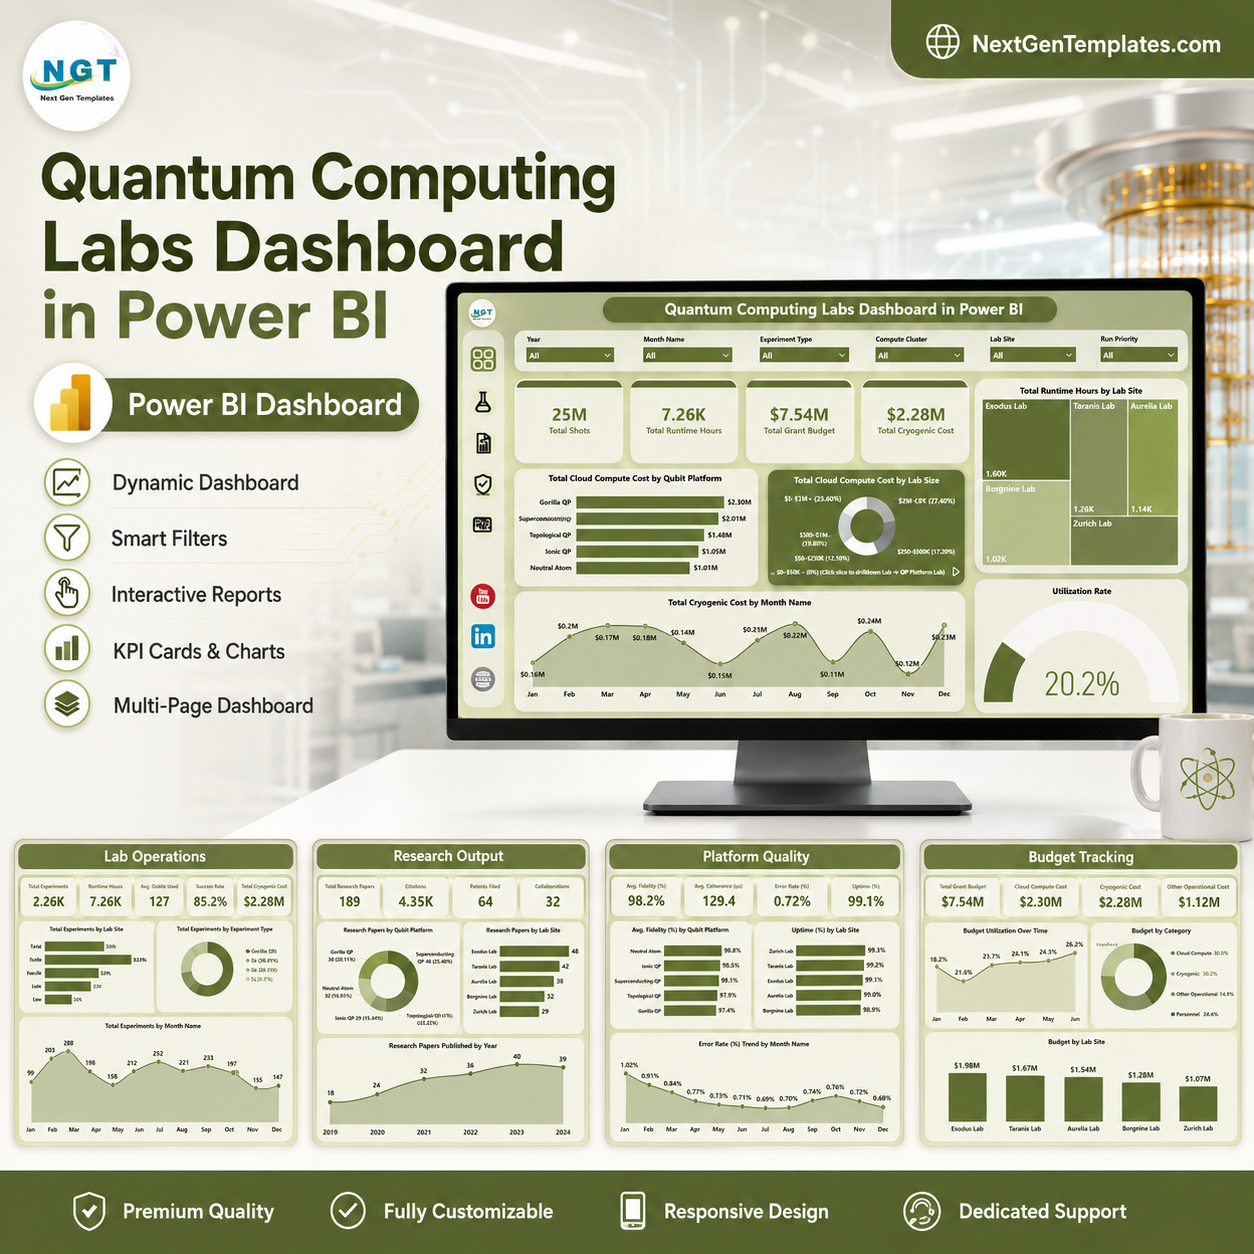
Last updated: July 30, 2026. Quantum labs can run thousands of shots across platforms, teams, lab sites, and monthly funding cycles, while leaders still need clear answers on runtime, validation, grant budget, cloud compute cost, and cryogenic cost. The Quantum Computing Labs Dashboard in Power BI gives research teams a ready-to-use PBIX dashboard with 5 report pages, 4 high-level cards, multiple slicers, and focused charts for lab operations, research output, platform quality, and budget tracking. It is an instant download, one-time payment, no subscription, and fully editable in Power BI Desktop.
Key Features of Quantum Computing Labs Dashboard in Power BI
- 5 Power BI report pages covering Overview, Lab Operations, Research Output, Platform Quality, and Budget Tracking.
- 4 executive KPI cards for Total Shots, Total Runtime Hours, Total Grant Budget, and Total Cryogenic Cost.
- Multiple slicers to quickly filter the dashboard by key lab, platform, team, priority, status, and time fields.
- Cloud compute cost analysis by qubit platform, lab site, and research team.
- Research quality views for fidelity score and validated experiment count.
- Budget utilization reporting by lab site, quarter, experiment type, and month.
What’s Inside the Quantum Computing Labs Dashboard in Power BI
The Overview Page gives leadership a fast view of Total Shots, Total Runtime Hours, Total Grant Budget, and Total Cryogenic Cost. It includes slicers and charts for Total Cloud Compute Cost by Qubit Platform, Total Cloud Compute Cost by Lab Site, Total Runtime Hours by Lab Site, Total Cryogenic Cost by Month Name, and Validation Rate.
Total Cloud Compute Cost by Qubit Platform: Compare compute spending across qubit platforms and identify which platforms drive the largest cloud cost.
Total Cloud Compute Cost by Lab Site: Review cloud cost by location so finance and operations can compare site-level usage.
Total Runtime Hours by Lab Site: See where experimental runtime is concentrated and which locations use the most lab capacity.
Total Cryogenic Cost by Month Name: Track cooling-related spending over time and spot monthly cost spikes.
Validation Rate: Review the share of experiments that passed validation and monitor quality progress.
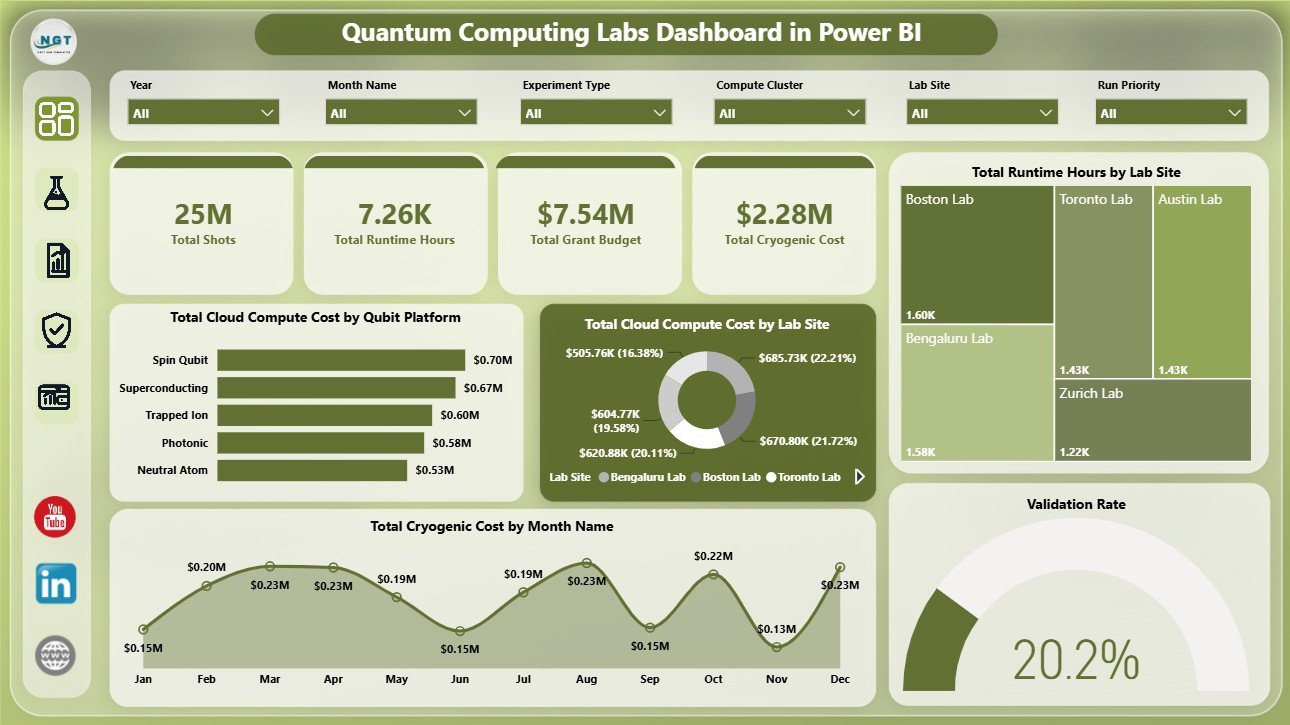
Quantum Computing Labs Dashboard in Power BI
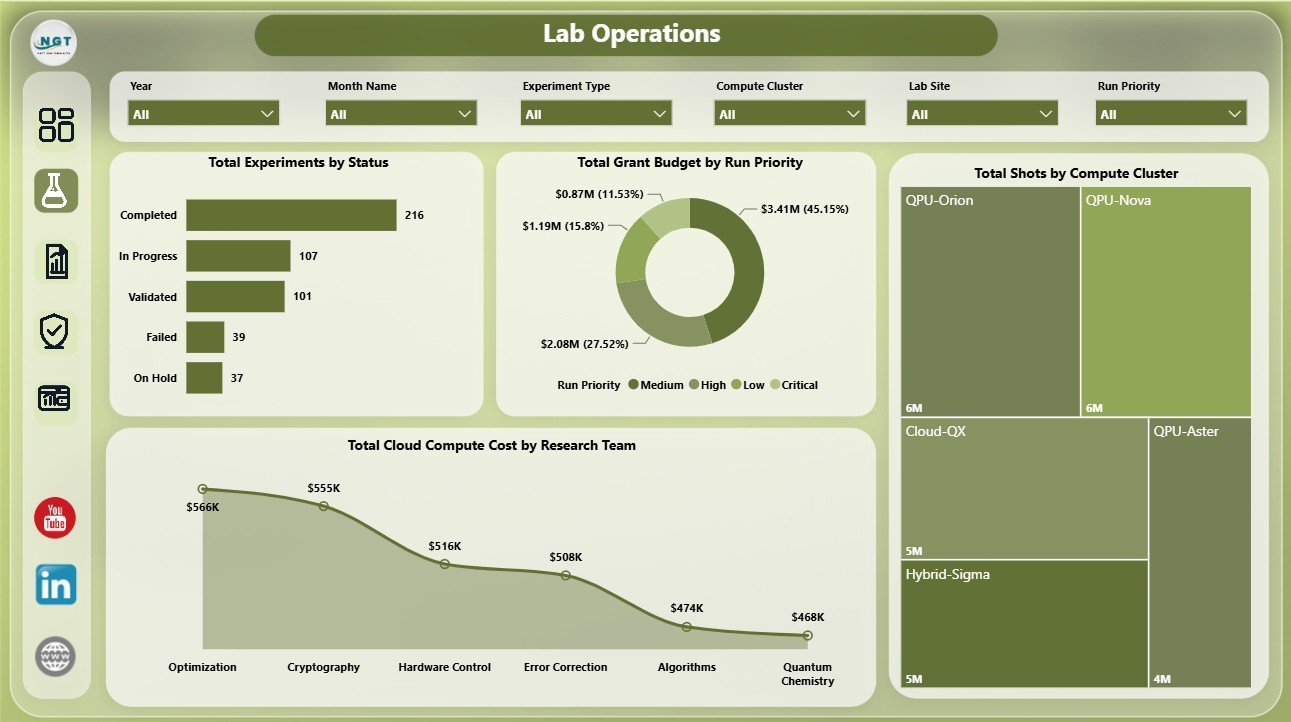
The Lab Operations page analyzes Total Experiments by Status, Total Grant Budget by Run Priority, Total Shots by Compute Cluster, and Total Cloud Compute Cost by Research Team.
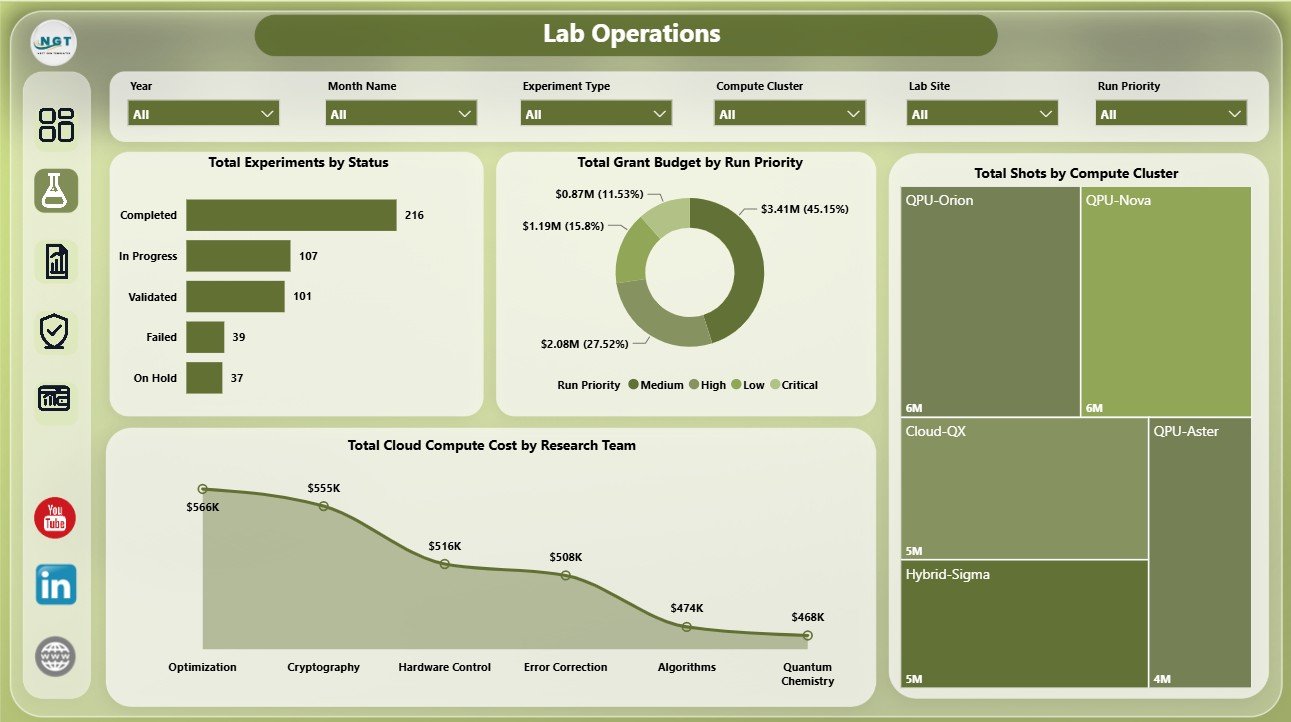
Lab Operations
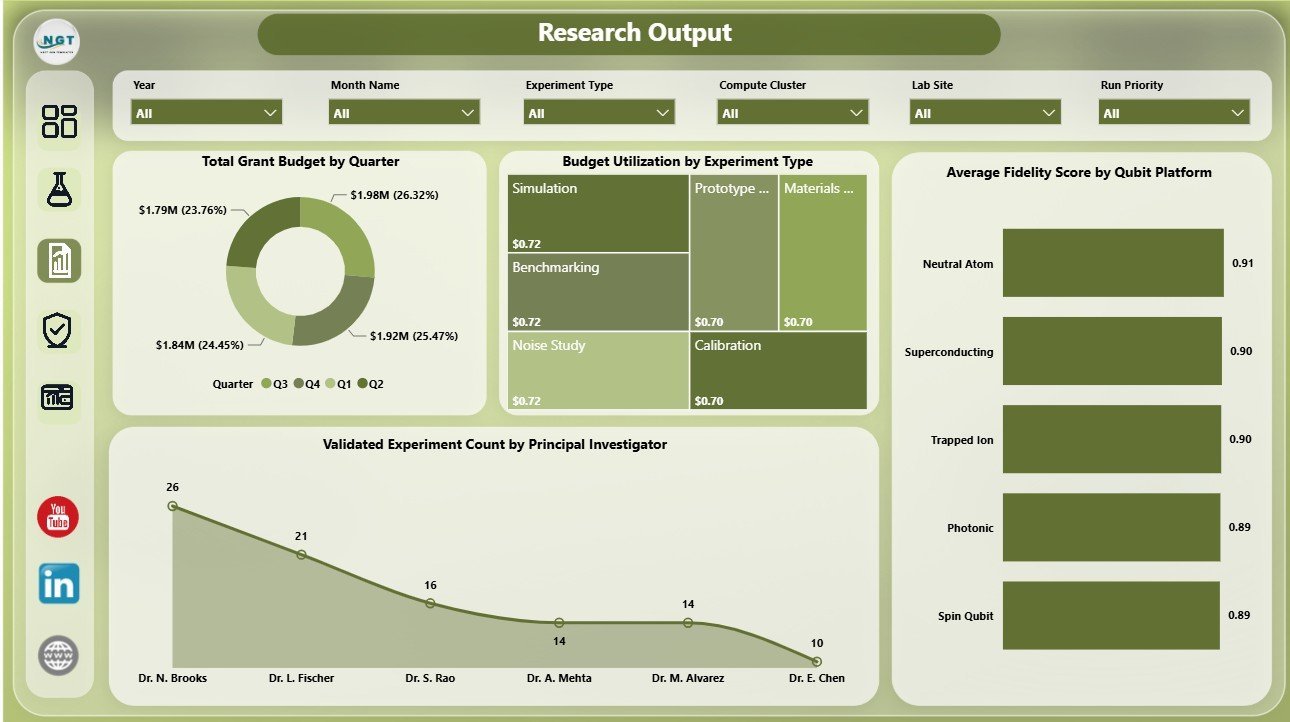
The Research Output page includes Total Grant Budget by Quarter, Budget Utilization by Experiment Type, Average Fidelity Score by Qubit Platform, and Validated Experiment Count by Principal Investigator.
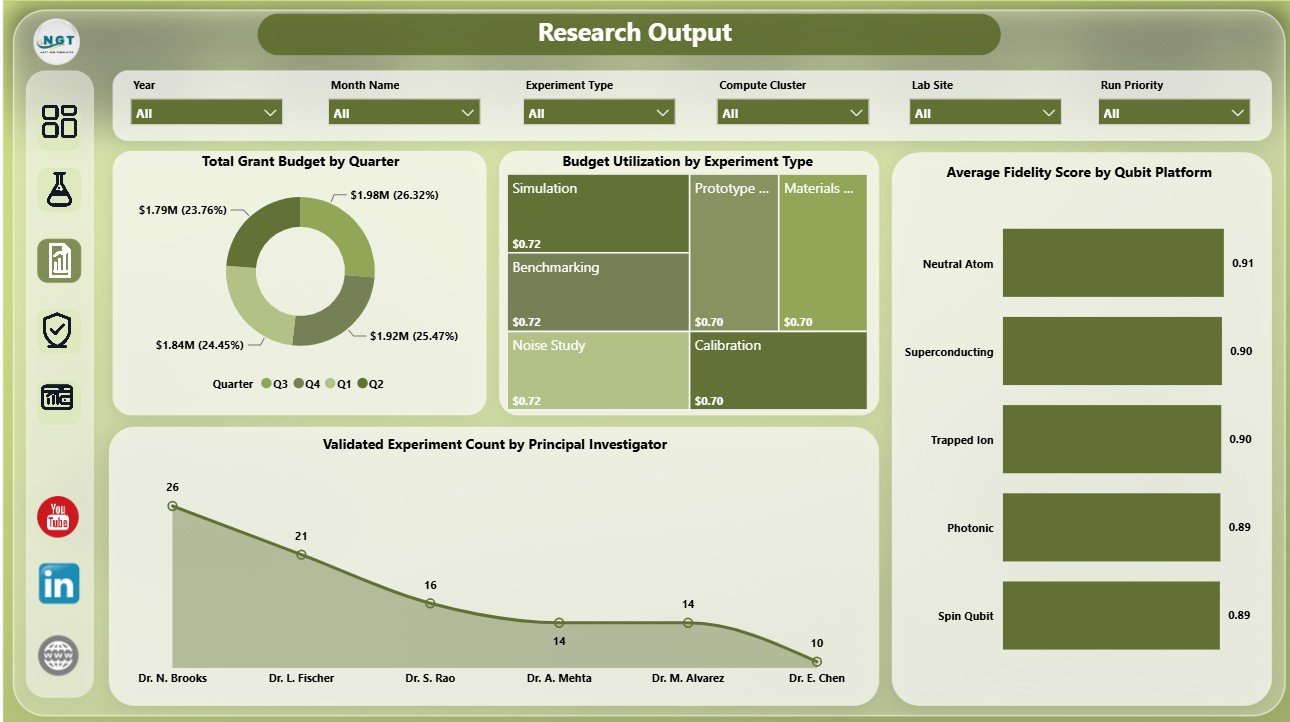
Research Output
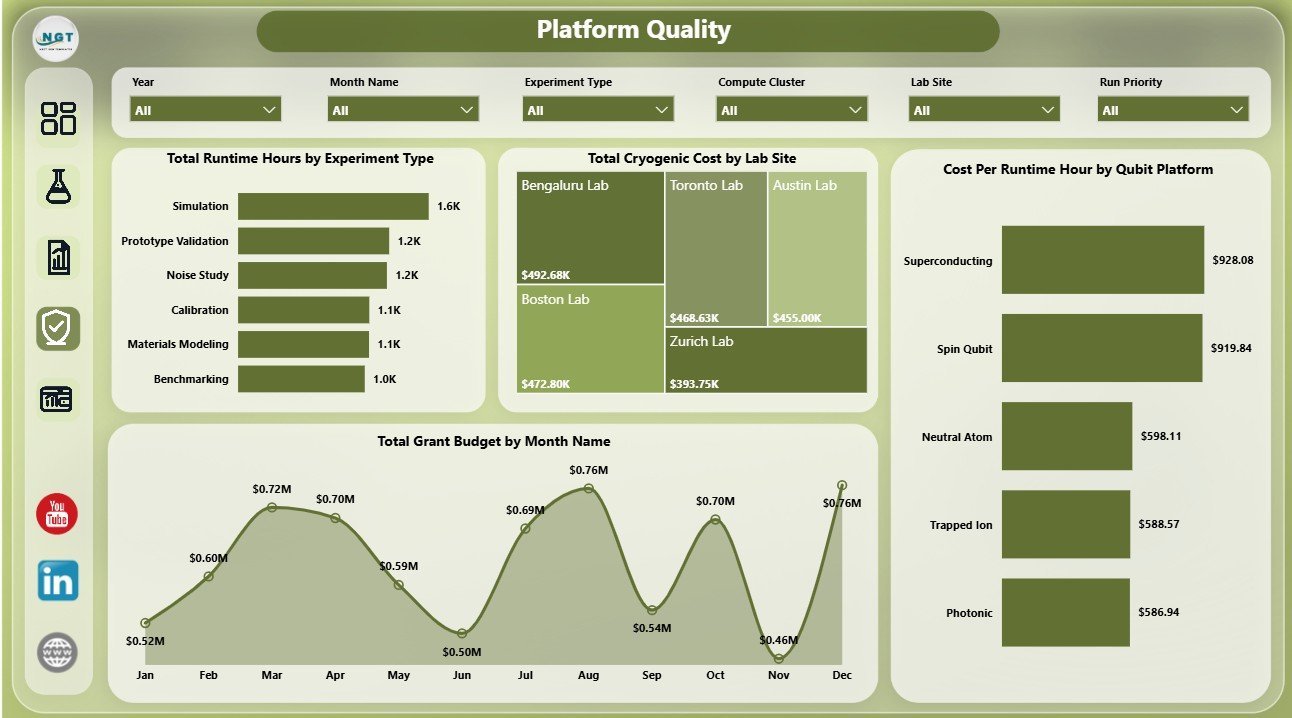
The Platform Quality page includes Total Runtime Hours by Experiment Type, Total Cryogenic Cost by Lab Site, Cost Per Runtime Hour by Qubit Platform, and Total Grant Budget by Month Name.
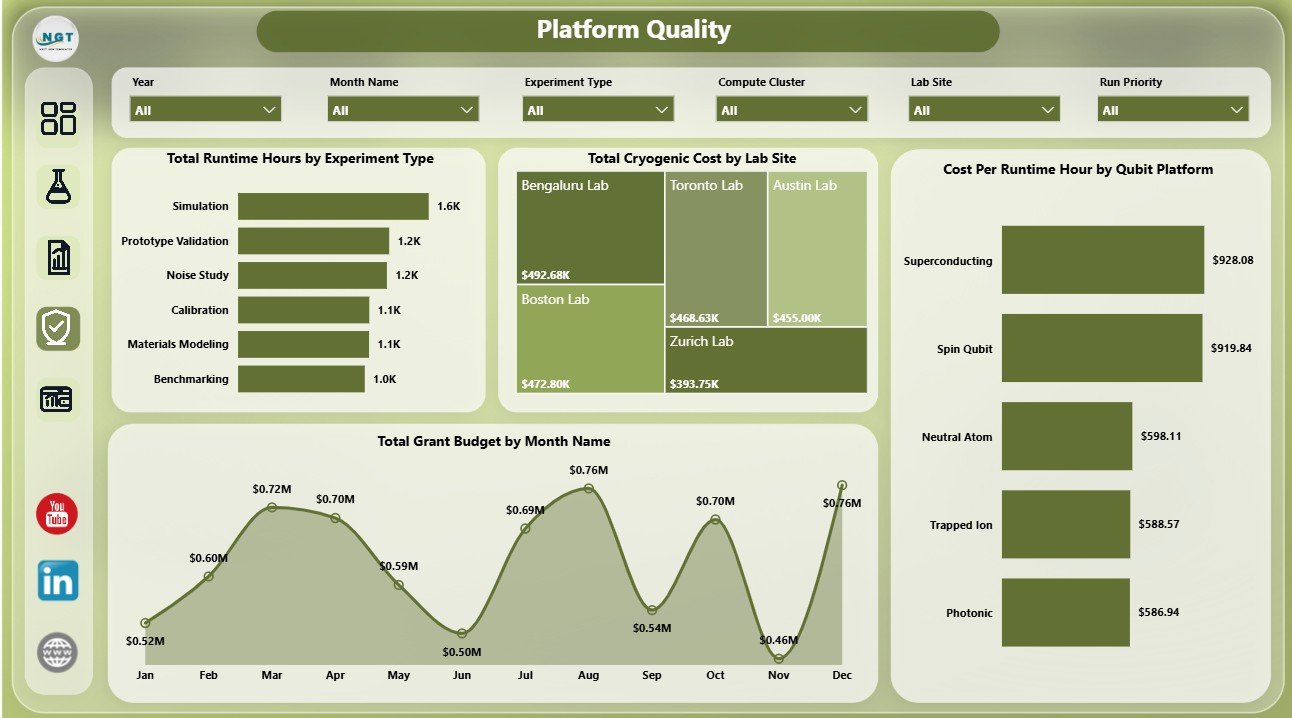
Platform Quality
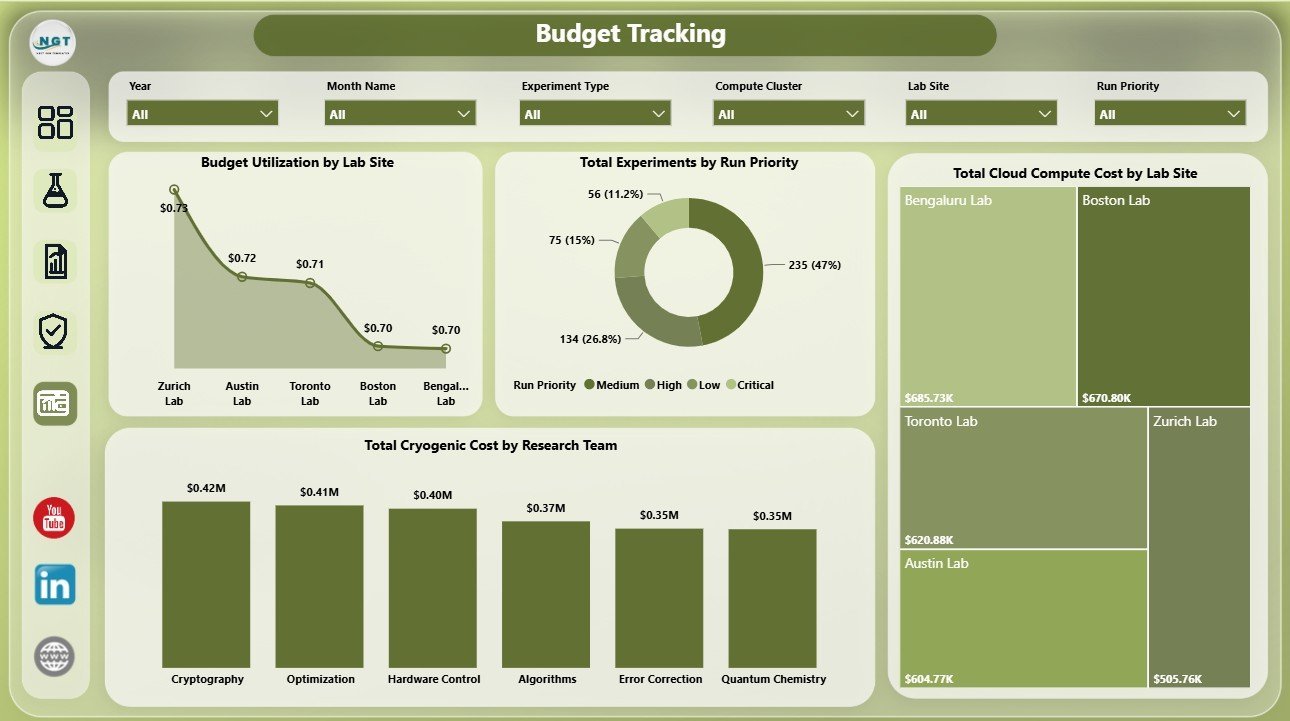
The Budget Tracking page includes Budget Utilization by Lab Site, Total Experiments by Run Priority, Total Cloud Compute Cost by Lab Site, and Total Cryogenic Cost by Research Team.
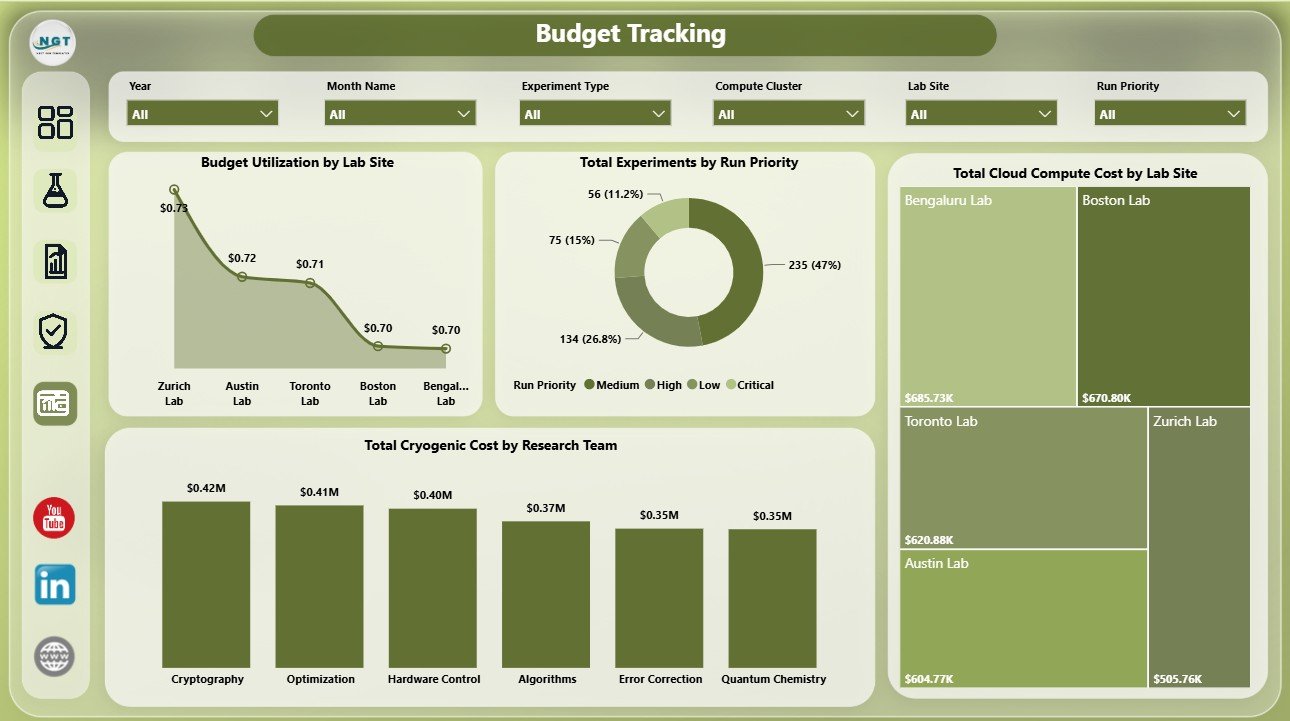
Budget Tracking
Quantum Computing Labs Dashboard in Power BI vs. Tableau vs. Paid CRM/SaaS – Where This Fits
| Feature | This Power BI dashboard | Tableau or Qlik alternative | Paid SaaS alternative |
|---|---|---|---|
| Cost | $17.99 one-time | License plus build time | Monthly or annual subscription |
| Setup time | Open PBIX, replace source data, refresh | Build model and visuals | Onboarding and configuration |
| Customizable fields | Edit visuals, model, measures, and pages | Editable with BI skills | Limited by product settings |
| Quantum lab metrics | Built around shots, runtime, fidelity, grants, cryogenic cost, and platforms | Possible with custom build | Depends on vendor fit |
Who This Template Is For – and Who It’s Not For
This template is for quantum research directors, lab operations managers, principal investigators, grant analysts, university research teams, R&D teams, and consultants who already maintain structured experiment data and want a faster reporting layer in Power BI. It is not a lab execution, approval, instrument control, or regulated audit system.
How to Use the Quantum Computing Labs Dashboard in Power BI
- Download and unzip the product file.
- Open the PBIX file in Power BI Desktop.
- Replace or connect the sample source with your quantum lab data.
- Refresh the report.
- Use slicers to filter the 5 report pages.
- Customize visuals, fields, measures, or pages if needed.
Real-World Use Cases
Research Director: Review validation rate, fidelity score, runtime hours, and grant budget before quarterly governance meetings.
Lab Operations Manager: Compare experiment status, shots by compute cluster, cloud compute cost, and lab-site runtime to plan weekly capacity.
Grant Analyst: Track budget utilization, cryogenic cost, and compute cost by lab site and research team for funding reports.
Frequently Asked Questions
What does this Power BI dashboard track?
It tracks shots, runtime hours, grant budget, cryogenic cost, cloud compute cost, validation rate, experiment status, fidelity score, budget utilization, and cost per runtime hour.
How many pages are included?
The report includes 5 pages: Overview Page, Lab Operations, Research Output, Platform Quality, and Budget Tracking.
Do I need Power BI Desktop?
Yes. Power BI Desktop is required to open and edit the PBIX file. Power BI Service is optional for sharing and scheduled refresh.
Can I use my own quantum lab data?
Yes. Replace or connect the sample source with structured lab records, then refresh the report.
Does this replace lab management software?
No. It is a reporting dashboard template, not a lab execution, approval, permission, or instrument control system.
About the Author
Built by PK – Microsoft Certified Professional with 15+ years of Excel, Google Sheets, and Power BI experience. Founder of NextGenTemplates, reaching 300K+ subscribers across YouTube channels. Every template is hand-built and tested before release.
Explore Related Templates
Explore more templates in the Power BI category and the Power BI Dashboard category. Related templates include Quantum Computing Labs Dashboard in Excel, Craft Winery and Vineyard Dashboard in Power BI, and Postal Services Dashboard in Power BI.
Download the Quantum Computing Labs Dashboard in Power BI today and turn lab operations, research output, platform quality, and budget data into an editable PBIX report.
Last updated: July 30, 2026